Download to read offline


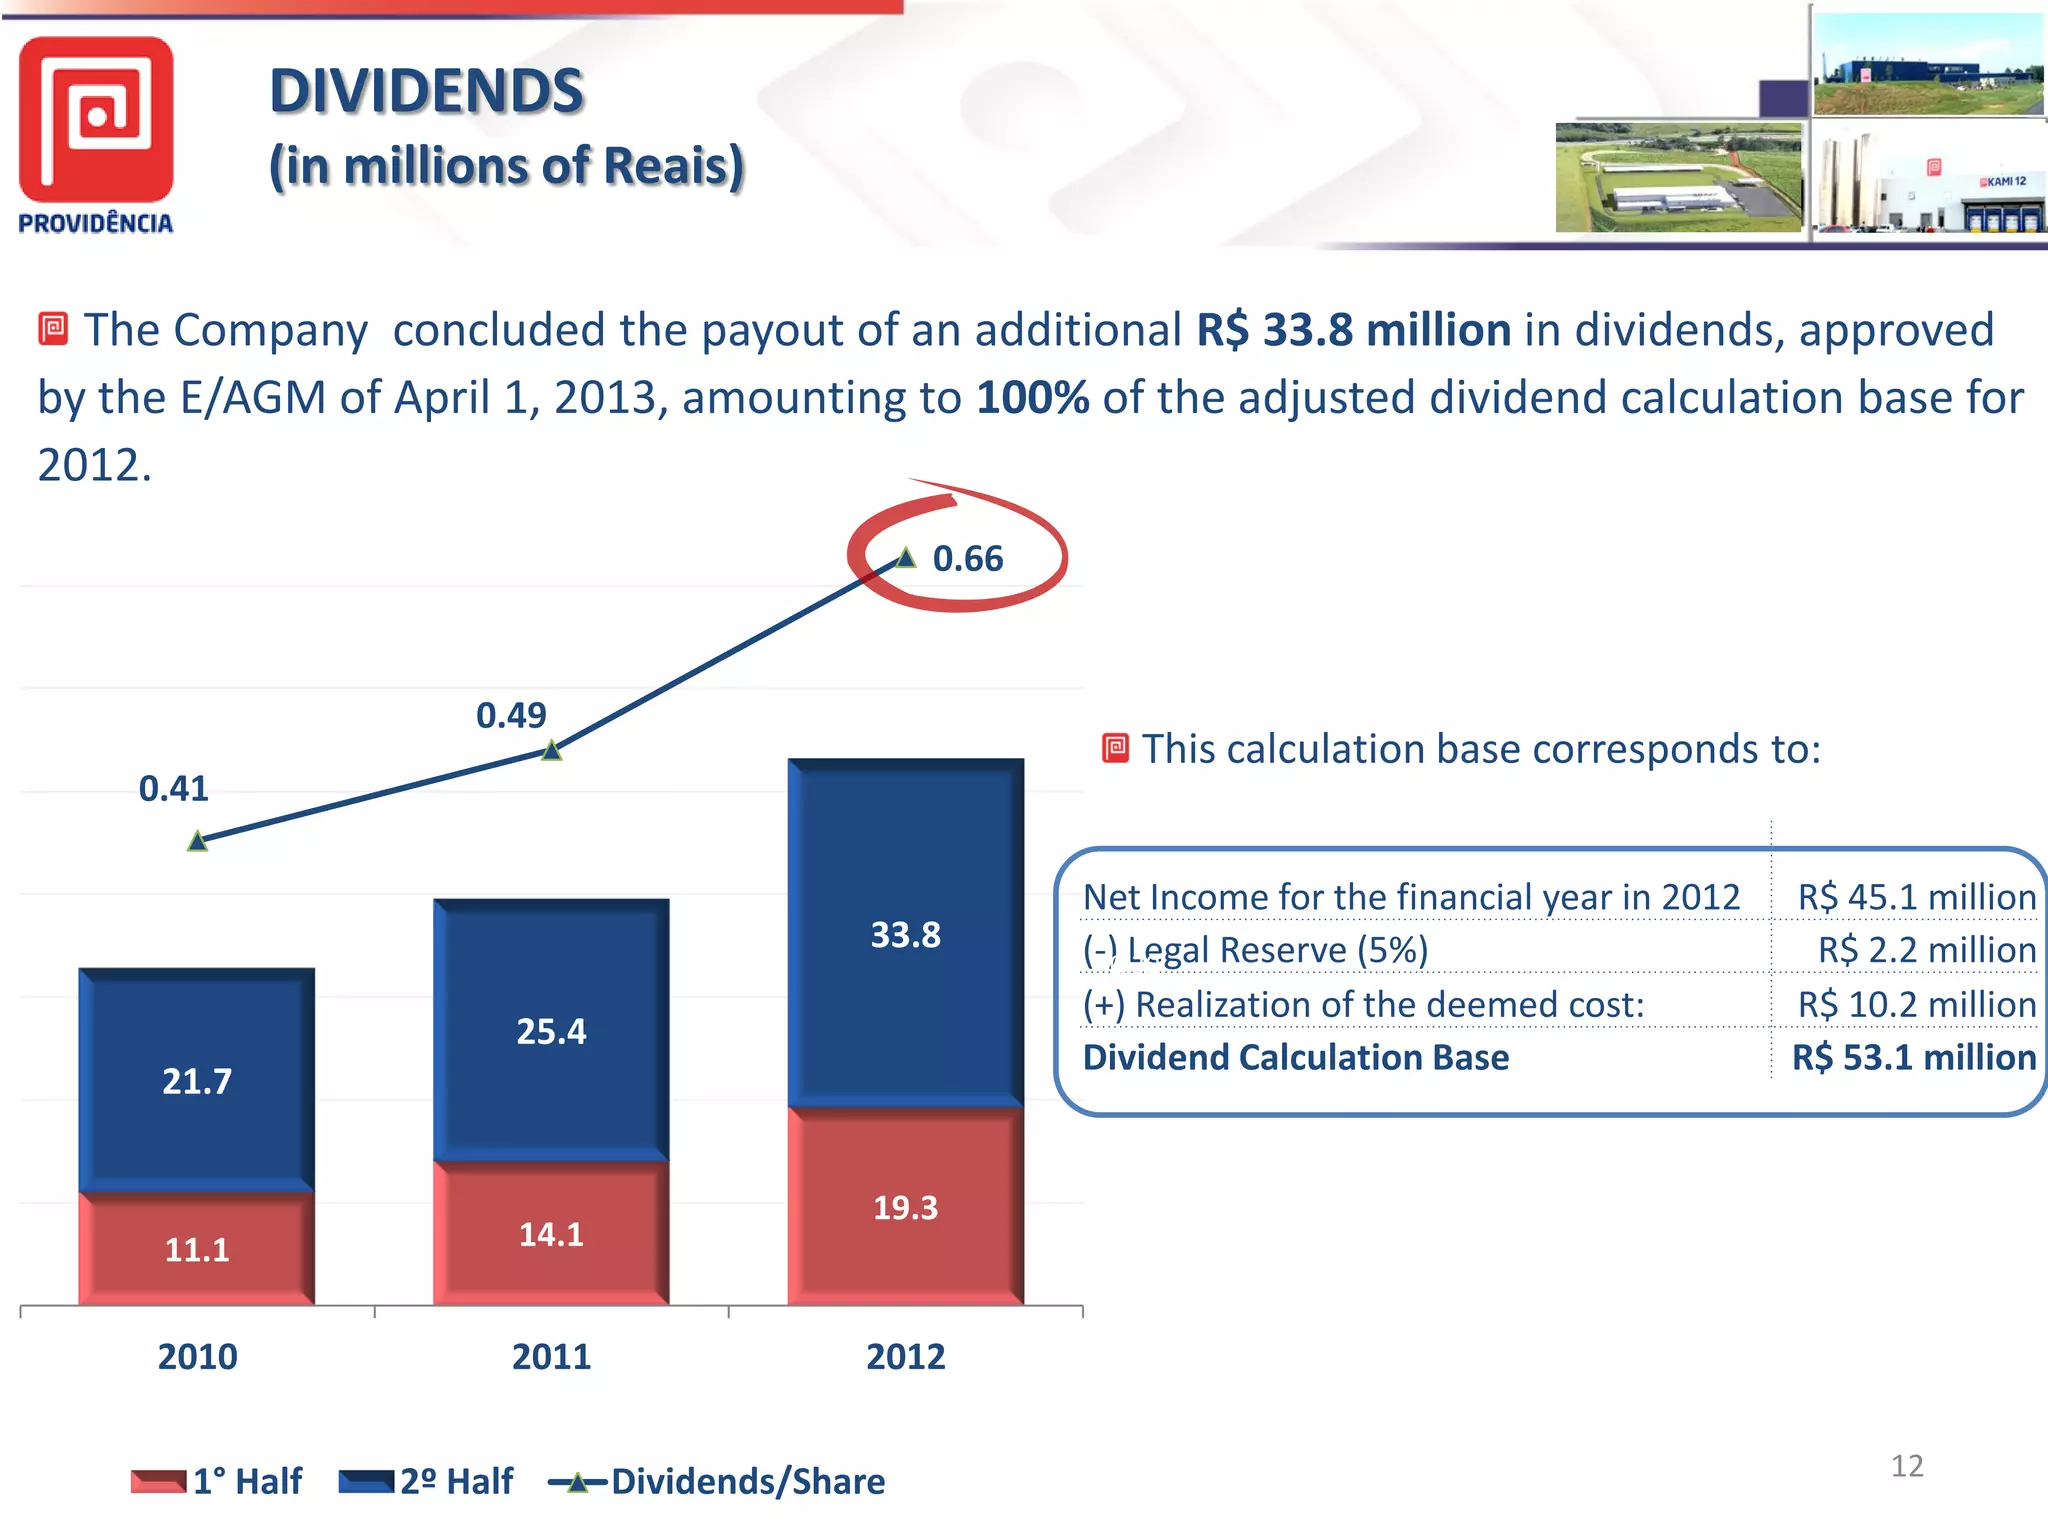


The document summarizes Providência USA's 2Q13 results. Highlights include the ramp up of production from their 13th production line exceeding expectations, concluding dividend payouts of R$33.8 million approved in April 2013, sales volume growth of 24.1% compared to 2Q12, and net income growth of 5.0% compared to 2Q12. Key financial metrics like net revenue, costs, EBITDA, and net income are also summarized. The outlook expects increased capacity utilization and sales growth as installed capacity reaches 140,000 tons/year by year-end.


