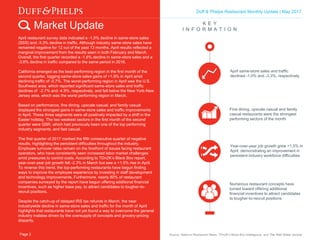
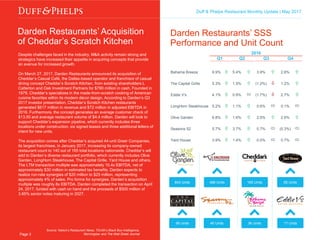
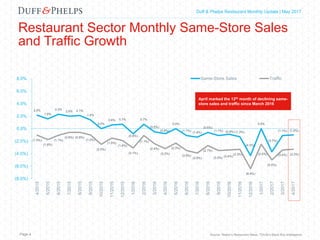
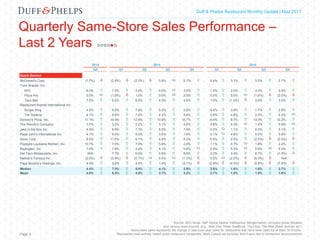
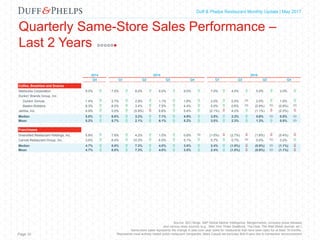
SlideShare a Scribd company logo
1
M a y 2 0 1 7
Restaurant Monthly
Update
Duff & Phelps Restaurant Monthly Update | May 2017
Market Update K E Y
I N F O R M A T I O N
Fine dining, upscale casual and family
casual restaurants were the strongest
performing sectors of the month
April same-store sales and traffic
declined -1.0% and -3.3%, respectively
Year-over-year job growth grew +1.5% in
April, demonstrating an improvement in
persistent industry workforce difficulties
Numerous restaurant concepts have
turned toward offering additional
financial incentives to attract candidates
to tougher-to-recruit positions
April restaurant survey data indicated a -1.0% decline in same-store sales
(SSS) and -3.3% decline in traffic. Although industry same-store sales have
remained negative for 12 out of the past 13 months, April results reflected a
marginal improvement from the results seen in both February and March.
Overall, the first quarter recorded a -1.6% decline in same-store sales and a
-3.6% decline in traffic compared to the same period in 2016.
California emerged as the best-performing region in the first month of the
second quarter, logging same-store sales gains of +1.9% in April amid
declining traffic of -0.7%. The worst-performing region in April was the U.S.
Southwest area, which reported significant same-store sales and traffic
declines of -2.7% and -4.9%, respectively, and fell below the New York-New
Jersey area, which was the worst performing region in March.
Based on performance, fine dining, upscale casual, and family casual
displayed the strongest gains in same-store sales and traffic improvements
in April. These three segments were all positively impacted by a shift in the
Easter holiday. The two weakest sectors in the first month of the second
quarter were QSR, which had previously been one of the top performing
industry segments, and fast casual.
The first quarter of 2017 marked the fifth consecutive quarter of negative
results, highlighting the persistent difficulties throughout the industry.
Employee turnover rates remain on the forefront of issues facing restaurant
operators, who have consistently seen increased labor market challenges
amid pressures to control costs. According to TDn2K’s Black Box report,
year-over-year job growth fell -2.3% in March but saw a +1.5% rise in April.
To reverse this trend, the top-performing restaurants have begun finding
ways to improve the employee experience by investing in staff development
and technology improvements. Furthermore, nearly 80% of restaurant
companies surveyed by the report have begun offering additional financial
incentives, such as higher base pay, to attract candidates to tougher-to-
recruit positions.
Despite the catch-up of delayed IRS tax refunds in March, the near
industrywide decline in same-store sales and traffic for the month of April
highlights that restaurants have not yet found a way to overcome the general
industry malaise driven by the oversupply of concepts and grocery-pricing
disparity.
Source: Nation’s Restaurant News, TDn2K’s Black Box Intelligence, and The Wall Street JournalPage 2
Duff & Phelps Restaurant Monthly Update | May 2017
Darden Restaurants’ Acquisition
of Cheddar’s Scratch Kitchen
Despite challenges faced in the industry, M&A activity remain strong and
strategics have increased their appetite in acquiring concepts that provide
an avenue for increased growth.
On March 27, 2017, Darden Restaurants announced its acquisition of
Cheddar’s Casual Café, the Dallas-based operator and franchisor of casual
dining concept Cheddar’s Scratch Kitchen, from existing shareholders L
Catterton and Oak Investment Partners for $780 million in cash. Founded in
1979, Cheddar’s specializes in the made-from-scratch cooking of American
cuisine favorites within its modern décor design. According to Darden’s Q3
2017 investor presentation, Cheddar’s Scratch Kitchen restaurants
generated $617 million in revenue and $72 million in adjusted EBITDA in
2016. Furthermore, the concept generates an average customer check of
$13.50 and average restaurant volume of $4.4 million. Darden will look to
support Cheddar’s expansion pipeline, which currently includes three
locations under construction, six signed leases and three additional letters of
intent for new units.
The acquisition comes after Cheddar’s acquired 44-unit Greer Companies,
its largest franchisee, in January 2017, increasing its company-owned
restaurant count to 140 out of 165 total locations nationwide. Cheddar’s will
add to Darden’s diverse restaurant portfolio, which currently includes Olive
Garden, LongHorn Steakhouse, The Capital Grille, Yard House and others.
The LTM transaction multiple was approximately 10.4x EBITDA, net of
approximately $30 million in estimated tax benefits. Darden expects to
realize run-rate synergies of $20 million to $25 million, representing
approximately 4% of sales. Pro forma for synergies, Darden’s acquisition
multiple was roughly 8x EBITDA. Darden completed the transaction on April
24, 2017, funded with cash on hand and the proceeds of $500 million of
3.85% senior notes maturing in 2027.
Page 3
Source: Nation’s Restaurant News, TDn2K’s Black Box Intelligence,
Morningstar and The Wall Street Journal
$269M $264M
$89M
33.0%
margin
$93M
34.6%
margin
56 Units
843 Units
36 Units
165 Units
17 Units
65 Units
2016
Q1 Q2 Q3 Q4
Bahama Breeze 9.9%  5.4%  3.9%  2.6% 
The Capital Grille 5.3%  1.5%  (1.2%)  1.2% 
Eddie V's 4.1%  0.9%  (1.7%)  2.7% 
LongHorn Steakhouse 5.2%  1.1%  0.6%  0.1% 
Olive Garden 6.8%  1.6%  2.0%  2.6% 
Seasons 52 5.7%  3.7%  0.7%  (0.3%) 
Yard House 3.9%  1.4%  0.0%  0.7% 
Darden Restaurants’ SSS
Performance and Unit Count
40 Units
488 Units
Capital Markets Industry Insights | Q1 2016Duff & Phelps Restaurant Monthly Update | May 2017
2.2%
1.6%
2.3%
2.0% 2.1%
1.4%
0.0%
0.6% 0.7%
(0.8%)
0.7%
(0.5%)
(0.8%)
0.0%
(1.1%)
(1.4%)
(0.6%)
(1.1%) (0.9%) (1.3%)
(4.3%)
0.0%
(3.7%)
(1.1%) (1.0%)
(1.0%)
(1.8%)
(1.1%)
(0.6%) (0.6%)
(1.0%)
(2.5%)
(1.5%)
(1.9%)
(3.1%)
(1.1%)
(2.4%)
(3.2%)
(2.3%)
(3.5%)
(3.9%)
(2.7%)
(3.5%) (3.4%)
(3.3%)
(6.4%)
(2.5%)
(5.0%)
(3.4%) (3.3%)
(8.0%)
(6.0%)
(4.0%)
(2.0%)
0.0%
2.0%
4.0%
6.0%
8.0%
4/2015
5/2015
6/2015
7/2015
8/2015
9/2015
10/2015
11/2015
12/2015
1/2016
2/2016
3/2016
4/2016
5/2016
6/2016
7/2016
8/2016
9/2016
10/2016
11/2016
12/2016
1/2017
2/2017
3/2017
4/2017
Same-Store Sales Traffic
Restaurant Sector Monthly Same-Store Sales
and Traffic Growth
Source: Nation’s Restaurant News, TDn2k’s Black Box Intelligence
April marked the 12th month of declining same-
store sales and traffic since March 2016
Page 4
Capital Markets Industry Insights | Q1 2016Duff & Phelps Restaurant Monthly Update | May 2017
Quarterly Same-Store Sales Performance –
Last 2 Years
Source: SEC filings, S&P Global Market Intelligence, Mergermarket, company press releases
and various news sources (e.g., New York Times DealBook, The Deal, The Wall Street Journal, etc.)
Same-store sales represents the change in year-over-year sales for restaurants that have been open for at least 18 months.
Represents most actively traded public restaurant companies; Mass Casual set excludes Bob Evans due to transaction announcementPage 5
2014 2015 2016
Q4 Q1 Q2 Q3 Q4 Q1 Q2 Q3 Q4
Mass Casual
Cracker Barrel Old Country Store, Inc. 7.9%  5.2%  3.8%  2.5%  0.6%  2.3%  3.2%  1.3%  0.6% 
Brinker International, Inc.
Chili's Grill & Bar 4.2%  2.2%  0.1%  (1.1%)  (2.1%)  (3.6%)  (1.8%)  (1.4%)  (3.1%) 
Maggiano's Little Italy 2.3%  0.1%  (0.1%)  (1.7%)  (1.8%)  0.2%  (1.7%)  (0.6%)  (0.8%) 
Bloomin' Brands, Inc.
Bonefish Grill 0.7%  0.9%  (4.6%)  (6.1%)  (5.4%)  (2.7%)  0.9%  1.7%  (1.9%) 
Carrabba's Italian Grill 0.3%  1.9%  0.9%  (2.0%)  (4.0%)  (2.0%)  (4.8%)  (2.1%)  (2.3%) 
Fleming's Prime Steakhouse & Wine Bar 3.4%  3.0%  3.2%  (0.6%)  (0.3%)  1.3%  (0.8%)  (1.9%)  0.2% 
Outback Steakhouse 6.4%  5.0%  4.0%  0.1%  (2.2%)  (1.3%)  (2.5%)  (0.7%)  (4.8%) 
DineEquity, Inc.
Applebee's 2.8%  2.9%  1.0%  (0.5%)  (2.5%)  (3.7%)  (4.2%)  (5.2%)  (7.2%) 
IHOP 6.1%  4.8%  6.2%  5.8%  1.4%  1.5%  0.2%  (0.1%)  (2.1%) 
Biglari Holdings Inc. 2.9%  6.0%  4.8%  3.0%  3.6%  1.8%  (0.7%)  0.2%  (0.4%) 
Denny's Corporation 4.7%  7.2%  7.3%  6.1%  2.9%  2.5%  (0.5%)  1.0%  0.5% 
Red Robin Gourmet Burgers Inc. 4.3%  3.8%  3.6%  3.7%  (1.6%)  (2.2%)  (3.2%)  (3.6%)  (4.3%) 
Ruby Tuesday, Inc. (1.0%)  (0.3%)  (1.7%)  0.6%  0.8%  (3.1%)  (3.7%)  (2.7%)  (4.1%) 
Luby's, Inc. 0.2%  3.1%  (1.0%)  0.2%  1.2%  3.1%  (0.6%)  0.7%  (2.3%) 
Ignite Restaurant Group, Inc.
Brick House Tavern + Tap 5.7%  5.4%  2.8%  (0.7%)  (2.8%)  (4.5%)  (6.3%)  (8.9%)  N/A
Joe's Crab Shack (4.5%)  (3.8%)  (4.0%)  (6.6%)  (2.9%)  (1.3%)  (6.8%)  (6.5%)  N/A
Famous Dave's of America Inc. (4.0%)  (4.9%)  (9.2%)  (9.8%)  (10.6%)  (7.7%)  (6.4%)  (1.0%)  (5.0%) 
Median 2.9%  3.0%  1.0%  (0.5%)  (1.8%)  (1.3%)  (1.8%)  (1.0%)  (2.3%) 
Mean 2.5%  2.5%  1.0%  (0.4%)  (1.5%)  (1.1%)  (2.3%)  (1.8%)  (2.5%) 
Capital Markets Industry Insights | Q1 2016Duff & Phelps Restaurant Monthly Update | May 2017
Quarterly Same-Store Sales Performance –
Last 2 Years
Page 6
2014 2015 2016
Q4 Q1 Q2 Q3 Q4 Q1 Q2 Q3 Q4
Specialty Casual
Darden Restaurants, Inc.
Bahama Breeze (0.6%)  3.2%  1.7%  1.8%  2.4%  9.9%  5.4%  3.9%  2.6% 
The Capital Grille 5.0%  6.1%  4.4%  7.2%  1.5%  5.3%  1.5%  (1.2%)  1.2% 
Eddie V's 4.9%  9.6%  5.2%  5.1%  1.1%  4.1%  0.9%  (1.7%)  2.7% 
LongHorn Steakhouse 2.6%  5.4%  5.2%  4.4%  2.6%  5.2%  1.1%  0.6%  0.1% 
Olive Garden 0.5%  2.2%  3.4%  2.7%  1.0%  6.8%  1.6%  2.0%  2.6% 
Seasons 52 1.2%  5.2%  3.1%  3.9%  4.5%  5.7%  3.7%  0.7%  (0.3%) 
Yard House 3.7%  5.4%  3.2%  3.4%  1.7%  3.9%  1.4%  0.0%  0.7% 
Texas Roadhouse, Inc. 6.8%  8.7%  8.0%  7.0%  4.4%  4.3%  4.5%  3.4%  1.2% 
Buffalo Wild Wings Inc. 5.5%  6.5%  3.3%  2.6%  1.0%  (2.0%)  (2.1%)  (1.7%)  (4.0%) 
Dave & Buster's Entertainment, Inc. 10.5%  9.9%  11.0%  8.8%  6.0%  3.6%  1.0%  5.9%  3.2% 
BJ's Restaurants, Inc. 1.2%  3.2%  0.5%  2.3%  0.7%  0.6%  (0.2%)  (3.4%)  (2.2%) 
Chuy's Holdings, Inc. 3.8%  1.9%  3.2%  4.2%  3.2%  3.2%  1.0%  0.3%  (1.1%) 
Median 3.8%  5.4%  3.4%  4.1%  2.1%  4.2%  1.3%  0.5%  1.0% 
Mean 3.8%  5.6%  4.4%  4.5%  2.5%  4.2%  1.7%  0.7%  0.6% 
Source: SEC filings, S&P Global Market Intelligence, Mergermarket, company press releases
and various news sources (e.g., New York Times DealBook, The Deal, The Wall Street Journal, etc.)
Same-store sales represents the change in year-over-year sales for restaurants that have been open for at least 18 months.
Represents most actively traded public restaurant companies; Mass Casual set excludes Bob Evans due to transaction announcement
Capital Markets Industry Insights | Q1 2016Duff & Phelps Restaurant Monthly Update | May 2017
Quarterly Same-Store Sales Performance –
Last 2 Years
Page 7
2014 2015 2016
Q4 Q1 Q2 Q3 Q4 Q1 Q2 Q3 Q4
Polished Casual
The Cheesecake Factory Incorporated 1.4%  4.2%  2.8%  2.2%  1.1%  1.7%  0.3%  1.7%  1.1% 
J. Alexander's Holdings, Inc.
J. Alexander's/Redlands Grill N/A N/A N/A (0.2%)  1.4%  (3.0%)  (1.8%)  1.4%  1.8% 
Stoney River Steakhouse and Grill N/A N/A N/A 4.7%  6.2%  0.7%  1.8%  1.8%  (1.7%) 
Kona Grill Inc. 3.1%  2.2%  1.0%  1.6%  3.2%  3.6%  2.5%  0.7%  (4.1%) 
Bravo Brio Restaurant Group, Inc.
Bravo! Cucina Italiana (3.9%)  (1.7%)  (2.1%)  (3.1%)  (5.2%)  (4.1%)  (8.4%)  (8.0%)  (7.5%) 
Brio Tuscan Grille (4.2%)  (1.0%)  (1.6%)  (3.8%)  (4.3%)  (2.1%)  (6.4%)  (3.7%)  (4.3%) 
Median (1.3%)  0.6%  (0.3%)  0.7%  1.3%  (0.7%)  (0.8%)  1.1%  (2.9%) 
Mean (0.9%)  0.9%  0.0%  0.2%  0.4%  (0.5%)  (2.0%)  (1.0%)  (2.5%) 
Fine Dining
Ruth's Hospitality Group Inc. 5.0%  2.8%  4.2%  3.3%  3.2%  3.1%  1.5%  2.1%  0.0% 
Fogo de Chao, Inc. N/A N/A 4.2%  2.8%  3.5%  1.1%  (1.6%)  0.6%  (1.0%) 
Del Frisco's Restaurant Group, Inc.
Del Frisco's Double Eagle Steak House 4.8%  2.3%  1.0%  (1.4%)  (1.6%)  (0.1%)  (1.9%)  (3.7%)  0.1% 
Del Frisco's Grille N/A (3.5%)  (6.3%)  (3.5%)  (4.5%)  (2.8%)  (2.0%)  (1.4%)  2.1% 
Sullivan's Steakhouse 1.8%  4.8%  (3.0%)  1.2%  (1.8%)  (1.8%)  2.9%  (3.2%)  0.9% 
The ONE Group Hospitality, Inc. 2.6%  (3.5%)  3.1%  0.3%  (0.8%)  2.8%  (5.2%)  (4.2%)  (6.0%) 
Median 3.7%  2.3%  2.1%  0.8%  (1.2%)  0.5%  (1.8%)  (2.3%)  0.1% 
Mean 3.6%  0.6%  0.5%  0.5%  (0.3%)  0.4%  (1.1%)  (1.6%)  (0.7%) 
Source: SEC filings, S&P Global Market Intelligence, Mergermarket, company press releases
and various news sources (e.g., New York Times DealBook, The Deal, The Wall Street Journal, etc.)
Same-store sales represents the change in year-over-year sales for restaurants that have been open for at least 18 months.
Represents most actively traded public restaurant companies; Mass Casual set excludes Bob Evans due to transaction announcement
Capital Markets Industry Insights | Q1 2016Duff & Phelps Restaurant Monthly Update | May 2017
Quarterly Same-Store Sales Performance –
Last 2 Years
Page 8
2014 2015 2016
Q4 Q1 Q2 Q3 Q4 Q1 Q2 Q3 Q4
Fast Casual
Chipotle Mexican Grill, Inc. 16.1%  10.4%  4.3%  2.6%  (14.6%)  (29.7%)  (23.6%)  (21.9%)  (4.8%) 
Panera Bread Company 3.0%  0.7%  1.8%  2.8%  2.3%  4.7%  2.3%  1.7%  0.7% 
Shake Shack Inc. 7.2%  11.7%  12.9%  17.1%  11.0%  9.9%  4.5%  2.9%  1.6% 
El Pollo Loco Holdings, Inc. 7.6%  5.1%  1.3%  0.6%  1.8%  0.7%  2.4%  1.6%  (1.3%) 
Zoe's Kitchen, Inc. 7.8%  7.7%  5.6%  4.5%  7.7%  8.1%  4.0%  2.4%  0.7% 
The Habit Restaurants, Inc. 13.2%  12.6%  8.9%  2.9%  3.3%  2.0%  4.0%  0.2%  1.7% 
Noodles & Company 1.3%  0.9%  0.1%  (0.9%)  (1.1%)  (0.1%)  (1.0%)  (0.7%)  (0.8%) 
Potbelly Corporation 3.7%  5.4%  4.9%  3.7%  3.7%  3.7%  1.7%  0.6%  0.1% 
Fiesta Restaurant Group, Inc.
Pollo Tropical 7.7%  6.4%  4.3%  4.2%  0.4%  0.0%  (1.4%)  (1.0%)  (4.0%) 
Taco Cabana 6.1%  3.8%  5.6%  4.8%  3.3%  1.7%  (3.8%)  (4.1%)  (3.5%) 
Wingstop Inc. 12.5%  10.7%  9.0%  6.3%  5.9%  4.6%  3.1%  4.1%  1.0% 
Median 7.6%  6.4%  4.9%  3.7%  3.3%  2.0%  2.3%  0.6%  0.1% 
Mean 7.8%  6.9%  5.3%  4.4%  2.2%  0.5%  (0.7%)  (1.3%)  (0.8%) 
Source: SEC filings, S&P Global Market Intelligence, Mergermarket, company press releases
and various news sources (e.g., New York Times DealBook, The Deal, The Wall Street Journal, etc.)
Same-store sales represents the change in year-over-year sales for restaurants that have been open for at least 18 months.
Represents most actively traded public restaurant companies; Mass Casual set excludes Bob Evans due to transaction announcement
Capital Markets Industry Insights | Q1 2016Duff & Phelps Restaurant Monthly Update | May 2017
Quarterly Same-Store Sales Performance –
Last 2 Years
Page 9
2014 2015 2016
Q4 Q1 Q2 Q3 Q4 Q1 Q2 Q3 Q4
Quick Service
McDonald's Corp. (1.7%)  (2.6%)  (2.0%)  0.9%  5.7%  5.4%  3.1%  3.5%  2.7% 
Yum! Brands, Inc.
KFC 6.0%  7.0%  3.0%  0.0%  3.0%  1.0%  2.0%  4.0%  3.0% 
Pizza Hut 0.0%  (1.0%)  1.0%  0.0%  2.0%  5.0%  0.0%  (1.0%)  (2.0%) 
Taco Bell 7.0%  6.0%  6.0%  4.0%  4.0%  1.0%  (1.0%)  3.0%  3.0% 
Restaurant Brands International Inc.
Burger King 4.2%  6.9%  7.9%  5.2%  2.8%  4.4%  3.9%  1.7%  2.8% 
Tim Hortons 4.1%  8.9%  7.0%  4.3%  5.8%  5.8%  4.8%  2.0%  0.2% 
Domino's Pizza, Inc. 11.1%  14.5%  12.8%  10.5%  10.7%  6.4%  9.7%  13.0%  12.2% 
The Wendy's Company 1.7%  3.2%  2.2%  3.1%  4.8%  3.6%  0.3%  1.4%  0.8% 
Jack in the Box Inc. 4.4%  8.9%  7.3%  6.2%  1.4%  0.0%  1.1%  2.0%  3.1% 
Papa John's International Inc. 4.1%  6.5%  5.5%  3.0%  1.9%  0.1%  4.8%  5.5%  3.8% 
Sonic Corp. 8.5%  11.5%  6.1%  4.9%  5.3%  6.5%  2.0%  (2.0%)  (2.0%) 
Popeyes Louisiana Kitchen, Inc. 10.7%  7.0%  7.9%  5.6%  2.0%  1.1%  0.7%  1.8%  2.4% 
Bojangles', Inc. 7.0%  7.9%  4.4%  4.1%  0.6%  2.0%  0.2%  0.8%  5.5% 
Del Taco Restaurants, Inc. N/A 7.7%  6.0%  5.6%  5.8%  3.2%  3.3%  6.7%  (1.3%) 
Nathan's Famous Inc. (2.0%)  (2.8%)  (0.7%)  0.5%  (1.3%)  0.2%  (2.2%)  (6.3%)  N/A
Papa Murphy's Holdings, Inc. 8.4%  5.6%  4.5%  1.4%  (3.1%)  (2.8%)  (4.0%)  (5.8%)  (7.8%) 
Median 4.4%  7.0%  5.8%  4.1%  2.9%  2.6%  1.6%  1.9%  2.7% 
Mean 4.9%  6.0%  4.9%  3.7%  3.2%  2.7%  1.8%  1.9%  1.8% 
Source: SEC filings, S&P Global Market Intelligence, Mergermarket, company press releases
and various news sources (e.g., New York Times DealBook, The Deal, The Wall Street Journal, etc.)
Same-store sales represents the change in year-over-year sales for restaurants that have been open for at least 18 months.
Represents most actively traded public restaurant companies; Mass Casual set excludes Bob Evans due to transaction announcement
Capital Markets Industry Insights | Q1 2016Duff & Phelps Restaurant Monthly Update | May 2017
Quarterly Same-Store Sales Performance –
Last 2 Years
Page 10
Source: SEC filings, S&P Global Market Intelligence, Mergermarket, company press releases
and various news sources (e.g., New York Times DealBook, The Deal, The Wall Street Journal, etc.)
Same-store sales represents the change in year-over-year sales for restaurants that have been open for at least 18 months.
Represents most actively traded public restaurant companies; Mass Casual set excludes Bob Evans due to transaction announcement
2014 2015 2016
Q4 Q1 Q2 Q3 Q4 Q1 Q2 Q3 Q4
Coffee, Breakfast and Snacks
Starbucks Corporation 5.0%  7.0%  8.0%  9.0%  9.0%  7.0%  4.0%  5.0%  3.0% 
Dunkin' Brands Group, Inc.
Dunkin' Donuts 1.4%  2.7%  2.9%  1.1%  1.8%  2.0%  0.5%  2.0%  1.9% 
Baskin-Robbins 9.3%  8.0%  3.4%  7.5%  4.4%  5.0%  0.6%  (0.9%)  (0.9%) 
Jamba, Inc. 4.9%  5.0%  (5.9%)  6.6%  5.4%  (2.1%)  4.2%  (1.1%)  (2.2%) 
Median 5.0%  6.0%  3.2%  7.1%  4.9%  3.5%  2.3%  0.6%  0.5% 
Mean 5.2%  5.7%  2.1%  6.1%  5.2%  3.0%  2.3%  1.3%  0.5% 
Franchisees
Diversified Restaurant Holdings, Inc. 5.8%  7.6%  4.2%  1.5%  0.8%  (1.0%)  (2.7%)  (1.8%)  (5.4%) 
Carrols Restaurant Group, Inc. 3.6%  8.4%  10.3%  6.5%  5.1%  5.7%  0.7%  0.0%  3.2% 
Median 4.7%  8.0%  7.3%  4.0%  3.0%  2.4%  (1.0%)  (0.9%)  (1.1%) 
Mean 4.7%  8.0%  7.3%  4.0%  3.0%  2.4%  (1.0%)  (0.9%)  (1.1%) 
Capital Markets Industry Insights | Q1 2016Duff & Phelps Restaurant Monthly Update | May 2017
Indexed Stock Price Performance – Last 12 Months
Page 11
Sector index weight based upon company market capitalization at valuation date
(1) Calculation of Market Sector LTM EV/EBITDA multiples excludes companies lacking analyst estimates for 2017E EBITDA figures
Source: S&P Global Market Intelligence; data as of 4/30/2017. Fast Casual index includes Chipotle Mexican Grill, Shake Shack Inc., Wingstop Inc., Fiesta Restaurant Group, El Pollo Loco Holdings,
Zoe’s Kitchen, The Habit Restaurants, Potbelly Corporation, Noodles & Company. Quick Service index includes McDonald’s Corp, Yum! Brands, Restaurant Brands International Inc., Domino’s Pizza,
The Wendy’s Company, Jack in the Box Inc., Papa John’s International Inc., Sonic Corp., Bojangles, Del Taco Restaurants, Nathan’s Famous Inc., Papa Murphy’s Holdings. Coffee, Breakfast and
Snacks index includes Starbucks Corporation, Dunkin’ Brands Group, Jamba. Franchisees index includes Carrols Restaurant Group, Inc., Diversified Restaurant Holdings, Inc. Mass Casual index
includes Brinker International, Cracker Barrel Old Country Store, Bloomin’ Brands, DineEquity, Biglari Holdings, Denny’s Corporation, Red Robin Gourmet Burgers, Ruby Tuesday, Luby’s, Ignite
Restaurant Group, Famous Dave’s of America. Specialty Casual index includes Darden Restaurants, Texas Roadhouse, Buffalo Wild Wings, Dave & Buster’s Entertainment, BJ’s Restaurants, Chuy’s
Holdings. Polished Casual index includes The Cheesecake Factory, J. Alexander’s Holdings, Kona Grill, Bravo Brio Restaurant Group. Fine Dining index includes Ruth’s Hospitality Group, Fogo de Chao,
Del Frisco’s Restaurant Group, The ONE Group Hospitality.
Represents most actively traded public restaurant companies
-40.0%
-30.0%
-20.0%
-10.0%
0.0%
10.0%
20.0%
30.0%
40.0%
50.0%
4/30/2016
5/31/2016
6/30/2016
7/31/2016
8/31/2016
9/30/2016
10/31/2016
11/30/2016
12/31/2016
1/31/2017
2/28/2017
3/31/2017
4/30/2017
Mass Casual Specialty Casual Polished Casual Fine Dining Fast Casual Quick Service Coffee, Breakfast & Snacks Franchisees
Capital Markets Industry Insights | Q1 2016Duff & Phelps Restaurant Monthly Update | May 2017
Sector Stock Price Performance
Sector index weight based upon company market capitalization at valuation date
(1) Calculation of Market Sector LTM EV/EBITDA multiples excludes companies lacking analyst estimates for 2017E EBITDA figures
Source: S&P Global Market Intelligence; data as of 4/30/2017. Fast Casual index includes Chipotle Mexican Grill, Shake Shack Inc., Wingstop Inc., Fiesta Restaurant Group, El Pollo Loco Holdings,
Zoe’s Kitchen, The Habit Restaurants, Potbelly Corporation, Noodles & Company. Quick Service index includes McDonald’s Corp, Yum! Brands, Restaurant Brands International Inc., Domino’s Pizza,
The Wendy’s Company, Jack in the Box Inc., Papa John’s International Inc., Sonic Corp., Bojangles, Del Taco Restaurants, Nathan’s Famous Inc., Papa Murphy’s Holdings. Coffee, Breakfast and
Snacks index includes Starbucks Corporation, Dunkin’ Brands Group, Jamba. Franchisees index includes Carrols Restaurant Group, Inc., Diversified Restaurant Holdings, Inc. Mass Casual index
includes Brinker International, Cracker Barrel Old Country Store, Bloomin’ Brands, DineEquity, Biglari Holdings, Denny’s Corporation, Red Robin Gourmet Burgers, Ruby Tuesday, Luby’s, Ignite
Restaurant Group, Famous Dave’s of America. Specialty Casual index includes Darden Restaurants, Texas Roadhouse, Buffalo Wild Wings, Dave & Buster’s Entertainment, BJ’s Restaurants, Chuy’s
Holdings. Polished Casual index includes The Cheesecake Factory, J. Alexander’s Holdings, Kona Grill, Bravo Brio Restaurant Group. Fine Dining index includes Ruth’s Hospitality Group, Fogo de Chao,
Del Frisco’s Restaurant Group, The ONE Group Hospitality.
Represents most actively traded public restaurant companiesPage 12
($ in millions, except per share data) Avg. Equity Avg. % Change Avg. EV /
Number of Market Value in Market Value EBITDA Multiple
Companies 28-Apr-17 1 Month 3 Months 12 Months LTM
(1)
2017E
Market Sector
Mass Casual 10 $1,206 2.6% 4.4% 1.2% 10.1x 10.0x
Specialty Casual 6 3,448 4.4% 15.2% 33.4% 11.2x 10.4x
Polished Casual 4 812 1.6% 6.7% 19.9% 8.9x 7.3x
Fine Dining 4 386 1.1% 15.4% 16.0% 10.2x 9.3x
Fast Casual 9 1,975 5.8% 10.3% 9.1% 18.6x 12.1x
Quick Service 12 14,333 6.0% 11.0% 13.2% 13.9x 13.2x
Coffee, Breakfast and Snacks 3 30,935 3.0% 8.7% 8.0% 17.3x 12.7x
Franchisees 2 286 2.8% 9.4% 14.7% 8.5x 7.9x
Market Indices
S&P 500 Index $2,384 0.9% 4.6% 15.4%
Dow Jones Industrials 20,941 1.3% 5.4% 17.8%
Russell 2000 Index 1,400 1.0% 2.8% 23.8%
S&P Restaurant Index 1,313 5.3% 10.9% 11.8%
Capital Markets Industry Insights | Q1 2016Duff & Phelps Restaurant Monthly Update | May 2017
Public Restaurant Valuations
Source: S&P Global Market Intelligence as of April 28, 2017
Represents most actively traded public restaurant companies; Mass Casual set excludes Bob Evans due to transaction announcementPage 13
($ in millions, except per share data) Stock Enterprise Value as a Multiple of LTM
Price % of Market Enterprise Revenue EBITDA EBITDA
% Franchised 28-Apr-17 52 Wk High Value Value LTM 2017E 2018E LTM 2017E 2018E Margin
Mass Casual
Cracker Barrel Old Country Store, Inc. 0% $160.19 91.5% $3,851 $4,072 1.39x 1.35x 1.30x 10.6x 10.1x 9.7x 13.2%
Brinker International, Inc. 40% 44.19 79.1% 2,160 3,480 1.08x 1.10x 1.08x 7.6x 8.0x 8.0x 14.2%
Bloomin' Brands, Inc. 20% 21.69 100.0% 2,235 3,156 0.75x 0.74x 0.73x 7.6x 7.3x 7.3x 9.8%
DineEquity, Inc. 99% 56.54 63.9% 1,017 2,295 3.66x 3.66x 3.63x 9.8x 9.6x 9.5x 37.4%
Denny's Corporation 90% 12.70 89.1% 895 1,153 2.27x 2.19x 2.12x 12.0x 11.2x 10.7x 19.0%
Biglari Holdings Inc. 37% 426.63 86.8% 882 1,064 1.25x 1.24x 1.21x 19.5x 18.6x 17.2x 6.4%
Red Robin Gourmet Burgers, Inc. 16% 58.75 87.6% 756 1,045 0.81x 0.76x 0.75x 7.6x 7.1x 6.8x 10.6%
Ruby Tuesday, Inc. 12% 2.55 56.0% 152 333 0.34x NA NA 8.5x NA NA 4.0%
Luby's, Inc. 37% 2.94 57.6% 86 121 0.31x NA NA 9.3x NA NA 3.3%
Famous Dave's of America, Inc. 80% 4.00 59.4% 28 35 0.35x 0.38x 0.36x 8.4x 7.7x 11.9x 4.2%
Median 82.9% $889 $1,109 0.94x 1.17x 1.14x 8.9x 8.8x 9.6x 10.2%
Mean 77.1% $1,206 $1,676 1.22x 1.43x 1.40x 10.1x 10.0x 10.1x 12.2%
Capital Markets Industry Insights | Q1 2016Duff & Phelps Restaurant Monthly Update | May 2017
Public Restaurant Valuations
Source: S&P Global Market Intelligence as of April 28, 2017
Represents most actively traded public restaurant companiesPage 14
($ in millions, except per share data) Stock Enterprise Value as a Multiple of LTM
Price % of Market Enterprise Revenue EBITDA EBITDA
% Franchised 28-Apr-17 52 Wk High Value Value LTM 2017E 2018E LTM 2017E 2018E Margin
Specialty Casual
Darden Restaurants, Inc. 3% $85.19 98.6% $10,592 $10,642 1.51x 1.47x 1.42x 11.3x 10.6x 10.0x 13.4%
Texas Roadhouse, Inc. 16% 46.88 92.8% 3,324 3,251 1.59x 1.49x 1.36x 12.4x 11.4x 10.2x 12.8%
Dave & Buster's Entertainment, Inc. 0% 64.01 99.2% 2,741 2,985 2.97x 2.55x 2.29x 12.5x 10.8x 9.8x 23.8%
Buffalo Wild Wings, Inc. 49% 157.55 90.0% 2,543 2,887 1.43x 1.36x 1.37x 10.1x 9.7x 9.1x 14.2%
BJ's Restaurants, Inc. 0% 45.10 94.8% 986 1,145 1.14x 1.09x 1.03x 9.1x 9.1x 8.5x 12.5%
Chuy's Holdings, Inc. 0% 29.80 78.9% 503 489 1.48x 1.28x 1.12x 12.0x 10.7x 9.5x 12.4%
Median 93.8% $2,642 $2,936 1.50x 1.41x 1.36x 11.6x 10.7x 9.6x 13.1%
Mean 92.4% $3,448 $3,567 1.69x 1.54x 1.43x 11.2x 10.4x 9.5x 14.8%
Polished Casual
The Cheesecake Factory Incorporated 7% $64.16 98.2% $2,955 $2,997 1.32x 1.27x 1.21x 10.4x 10.4x 9.8x 12.7%
J. Alexander's Holdings, Inc. 0% 11.00 90.9% 162 179 0.81x 0.77x 0.73x 9.0x 7.3x 7.1x 9.0%
Bravo Brio Restaurant Group, Inc. 1% 4.85 55.9% 73 114 0.28x 0.28x 0.29x NM 4.0x 4.1x (9.7%)
Kona Grill, Inc. 0% 5.70 39.5% 57 88 0.52x 0.44x 0.41x 7.3x 7.7x 5.4x 7.1%
Median 73.4% $118 $146 0.67x 0.60x 0.57x 9.0x 7.5x 6.2x 8.0%
Mean 71.1% $812 $844 0.73x 0.69x 0.66x 8.9x 7.3x 6.6x 4.8%
Capital Markets Industry Insights | Q1 2016Duff & Phelps Restaurant Monthly Update | May 2017
Public Restaurant Valuations
Page 15
Source: S&P Global Market Intelligence as of April 28, 2017
Represents most actively traded public restaurant companies; Fast Casual set excludes Panera Bread Company due to transaction announcement
($ in millions, except per share data) Stock Enterprise Value as a Multiple of LTM
Price % of Market Enterprise Revenue EBITDA EBITDA
% Franchised 28-Apr-17 52 Wk High Value Value LTM 2017E 2018E LTM 2017E 2018E Margin
Fine Dining
Ruth's Hospitality Group, Inc. 53% $19.90 96.8% $636 $647 1.68x 1.55x 1.49x 10.6x 10.0x 9.5x 15.8%
Fogo de Chao, Inc. 0% 16.95 98.6% 479 595 2.06x 1.87x 1.71x 11.0x 9.7x 8.8x 18.8%
Del Frisco's Restaurant Group, Inc. 0% 17.20 91.5% 375 389 1.10x 1.06x 0.99x 9.0x 8.2x 7.5x 12.2%
The ONE Group Hospitality, Inc. 0% 2.22 64.7% 56 71 0.98x 0.94x NA NM 9.4x NM NM
Median 94.2% $427 $492 1.39x 1.31x 1.49x 10.6x 9.6x 8.8x 15.8%
Mean 87.9% $386 $425 1.45x 1.36x 1.40x 10.2x 9.3x 8.6x 15.6%
Fast Casual
Chipotle Mexican Grill, Inc. 0% $474.47 95.4% $13,600 $13,023 3.15x 2.81x 2.49x 39.4x 23.7x 17.8x 8.0%
Panera Bread Company 55% 312.68 98.9% 7,105 7,439 2.62x 2.51x 2.32x 17.6x 16.8x 15.1x 14.9%
Wingstop Inc. 98% 29.43 88.1% 849 991 10.85x 9.90x 8.90x 30.8x 24.9x 21.3x 35.3%
Shake Shack Inc. 44% 33.94 79.0% 864 849 3.16x 2.39x 1.89x 20.1x 15.1x 12.1x 15.8%
Fiesta Restaurant Group, Inc. 11% 24.35 71.9% 656 724 1.02x 1.00x 0.94x 8.3x 7.9x 7.3x 12.2%
El Pollo Loco Holdings, Inc. 56% 12.55 85.9% 483 578 1.52x 1.42x 1.31x 9.4x 8.8x 8.1x 16.1%
Zoe's Kitchen, Inc. 1% 18.05 43.2% 352 376 1.36x 1.16x 0.97x 16.5x 0.9x 12.1x 8.3%
The Habit Restaurants, Inc. 7% 18.90 94.5% 382 368 1.30x 1.08x 0.91x 12.6x 10.8x 9.3x 10.3%
Potbelly Corporation 11% 13.95 95.7% 350 323 0.79x 0.71x 0.66x 7.8x 7.4x 6.7x 10.1%
Noodles & Company 15% 5.85 50.4% 240 301 0.62x 0.65x 0.63x 22.1x 9.6x 8.7x 2.8%
Median 87.0% $569 $651 1.44x 1.29x 1.14x 17.0x 10.2x 10.7x 11.3%
Mean 80.3% $2,488 $2,497 2.64x 2.36x 2.10x 18.5x 12.6x 11.9x 13.4%
Capital Markets Industry Insights | Q1 2016Duff & Phelps Restaurant Monthly Update | May 2017
Public Restaurant Valuations
Page 16
Source: S&P Global Market Intelligence as of April 28, 2017
Represents most actively traded public restaurant companies
($ in millions, except per share data) Stock Enterprise Value as a Multiple of LTM
Price % of Market Enterprise Revenue EBITDA EBITDA
% Franchised 28-Apr-17 52 Wk High Value Value LTM 2017E 2018E LTM 2017E 2018E Margin
Quick Service
McDonald's Corporation 85% $139.93 98.0% $114,288 $139,083 5.70x 6.22x 7.04x 14.6x 14.1x 14.0x 39.0%
Yum! Brands, Inc. 94% 65.75 71.5% 23,162 31,744 4.99x 5.68x 6.97x 16.2x 15.6x 15.1x 30.9%
Restaurant Brands International Inc. 100% 56.17 95.8% 13,235 27,357 6.47x 6.05x 5.64x 14.7x 13.2x 12.1x 44.0%
Domino's Pizza, Inc. 97% 181.39 94.5% 8,723 10,851 4.24x 3.94x 3.58x 21.7x 19.3x 17.2x 19.5%
The Wendy's Company 95% 14.74 98.7% 3,632 5,991 4.17x 5.03x 4.87x 15.8x 14.9x 13.8x 26.5%
Jack in the Box Inc. 75% 101.97 90.0% 3,227 4,411 2.73x 2.77x 3.01x 12.7x 11.8x 11.3x 21.5%
Papa John's International, Inc. 85% 79.06 87.4% 2,912 3,206 1.87x 1.80x 1.73x 16.4x 15.5x 14.5x 11.4%
Sonic Corp. 93% 26.88 75.9% 1,141 1,720 3.09x 3.71x 3.73x 10.5x 11.5x 11.0x 29.4%
Bojangles', Inc. 57% 21.95 99.8% 803 971 1.83x 1.71x 1.61x 11.6x 11.9x 11.0x 15.7%
Del Taco Restaurants, Inc. 45% 13.15 85.8% 507 672 1.49x 1.42x 1.32x 10.2x 9.3x 8.6x 14.5%
Nathan's Famous, Inc. 98% 68.20 98.8% 285 360 3.73x NA NA 13.1x NA NA 28.4%
Papa Murphy's Holdings, Inc. 89% 4.88 37.7% 83 191 1.51x 1.46x 1.54x 8.7x 8.2x 7.5x 17.3%
Median 92.2% $3,069 $3,809 3.41x 3.71x 3.58x 13.9x 13.2x 12.1x 24.0%
Mean 86.2% $14,333 $18,880 3.48x 3.62x 3.73x 13.9x 13.2x 12.4x 24.8%
Capital Markets Industry Insights | Q1 2016Duff & Phelps Restaurant Monthly Update | May 2017
Public Restaurant Valuations
Page 17
Source: S&P Global Market Intelligence as of April 28, 2017
Represents most actively traded public restaurant companies
($ in millions, except per share data) Stock Enterprise Value as a Multiple of LTM
Price % of Market Enterprise Revenue EBITDA EBITDA
% Franchised 28-Apr-17 52 Wk High Value Value LTM 2017E 2018E LTM 2017E 2018E Margin
Coffee, Breakfast and Snacks
Starbucks Corporation 50% $60.06 97.0% $87,531 $89,110 4.05x 3.83x 3.46x 17.8x 15.5x 13.6x 22.8%
Dunkin' Brands Group, Inc. 100% 55.86 95.6% 5,143 7,250 8.75x 8.57x 8.15x 16.7x 15.3x 14.3x 52.3%
Jamba, Inc. 85% 8.52 63.9% 131 116 1.42x 1.54x 1.51x NM 7.3x 11.8x NM
Median 95.6% $5,143 $7,250 4.05x 3.83x 3.46x 17.3x 15.3x 13.6x 37.5%
Mean 85.5% $30,935 $32,159 4.74x 4.65x 4.37x 17.3x 12.7x 13.2x 37.5%
Franchisees
Carrols Restaurant Group, Inc. 0% $14.00 79.8% $499 $738 0.78x 0.71x 0.69x 8.5x 7.9x 7.4x 9.1%
Diversified Restaurant Holdings, Inc. 0% 2.74 98.2% 73 187 1.12x 1.07x NA 8.4x 7.8x NM 13.4%
Median 89.0% $286 $463 0.95x 0.89x 0.69x 8.5x 7.9x 7.4x 11.3%
Mean 89.0% $286 $463 0.95x 0.89x 0.69x 8.5x 7.9x 7.4x 11.3%
Capital Markets Industry Insights | Q1 2016Duff & Phelps Restaurant Monthly Update | May 2017
Mean: 11.8x
Mean: 9.9x
Mean: 11.2x
Mean: 10.0x
Historical Public Restaurant Trends
Enterprise Value as a Multiple of EBITDA(1)
Page 18
(1) Index calculation excludes any companies with non-meaningful trading multiples
Source: S&P Global Market Intelligence; LTM values as of 4/28/2017
Segments weighted based on market cap values at period end
Represents most actively traded public restaurant companies
10.8x
13.8x
10.0x
13.2x
11.4x
13.2x
11.2x
12.8x
8.8x
10.5x
8.6x
10.2x9.6x
10.4x
9.7x 9.4x
9.2x
11.3x
10.0x 10.4x
5.0x
7.0x
9.0x
11.0x
13.0x
15.0x
17.0x
19.0x
Mass Casual Specialty Casual Polished Casual Fine Dining
2013 2014 2015 2016 LTM
Capital Markets Industry Insights | Q1 2016Duff & Phelps Restaurant Monthly Update | May 2017
Historical Public Restaurant Trends
Page 19
Mean: 13.4x
Mean: 18.0x
Mean: 10.2x
Mean: 13.9x
Enterprise Value as a Multiple of EBITDA(1)
(1) Index calculation excludes any companies with non-meaningful trading multiples
Source: S&P Global Market Intelligence; LTM values as of 4/28/2017
Segments weighted based on market cap values at period end
Represents most actively traded public restaurant companies; LTM Fast Casual set excludes Panera Bread Company due to transaction announcement
15.1x
11.3x
18.9x
11.8x
14.3x
12.3x
16.7x
11.8x
13.5x
14.4x
19.8x
11.4x
12.9x
13.8x
16.8x
7.8x
13.8x
15.0x
17.6x
8.4x
5.0x
8.0x
11.0x
14.0x
17.0x
20.0x
23.0x
Fast Casual Quick Service Coffee, Breakfast and Snacks Franchisees
2013 2014 2015 2016 LTM
Capital Markets Industry Insights | Q1 2016Duff & Phelps Restaurant Monthly Update | May 2017
Recent Restaurant M&A Transaction Activity
Balmoral Funds Acquires MOOYAH Holdings
On April 28, 2017, Balmoral Funds acquired MOOYAH Holdings, a Plano,
Texas-based franchisor of fast casual burgers, for an undisclosed sum.
MOOYAH specializes in customizable burgers, milkshakes and fries with 73
locations in the U.S. and 20 international stores. Balmoral Funds will look to
utilize its resources and experience in the restaurant franchisee space to
continue geographic expansion and building the brand name.
General Atlantic Invests in Torchy’s Tacos
On April 18, 2017, General Atlantic made an undisclosed minority investment in
Torchy’s Tacos, the Austin, Texas-based fast-casual chain. The company,
which was founded with a single food trailer in South Austin in 2006, has grown
to 46 company-owned locations in three states over the past decade. The
transaction marks the third restaurant investment made by General Atlantic over
the past 18 months, with previous deals made with Barteca Holdings and Joe
and the Juice. Torchy’s Tacos will utilize the deal to fund new-unit expansion in
west Houston, Tulsa, Oklahoma, and other geographic markets.
JAB Holdings Acquires Panera Bread Company for $7.6B
On April 5, 2017, Netherlands-based JAB Holdings has acquired Panera Bread
Company, the St. Louis, Missouri-based operator and franchisor of over 2,000
fast casual bakery-cafes, for $315 per share in cash, equating to a total
transaction value of $7.6B. Panera has gained significant momentum in recent
months, with same-store sales increasing 11.5% on a two-year basis due to the
implementation of kiosks, table service and a smartphone app to speed service.
Backed by Germany’s billionaire Reimann family, JAB Holdings has spent
roughly $40B on deals in the U.S. over the past decade with the previous
acquisitions of Keurig Green Mountain, Peet’s Coffee and Krispy Kreme. The
transaction multiple was 17.7x Panera’s LTM EBITDA.
Kitchen Fund Invests in The Hummus & Pita Co.
On April 3, 2017, growth equity firm Kitchen Fund made an investment in The
Hummus & Pita Co., the New York-based fast casual Mediterranean concept.
Kitchen Fund was founded in 2016 by Dan Rowe and Greg Golkin, two
financiers who have made investments in a handful of concepts, including
Inday, The Pie Hole and Mr. Holmes Bakehouse, to make early-stage
investments in unique restaurant concepts. The Hummus & Pita Co. will look to
utilize the investment to begin franchising locations and expand its geographic
footprint outside of the New York area.
Source: Mergermarket Group IntelligencePage 20
Four Foods Group Acquires Little Caesars Restaurant Group
On March 29, 2017, Utah-based Four Foods Group acquired 48 Little
Caesars restaurants in Alabama and Louisiana for an undisclosed sum.
Founded in 2008, Four Foods Group currently operates 44 Kneaders
Bakery & Café restaurants, two R&R Barbecue locations and Gilbert,
Arizona-based The Soda Shop. The transaction announcement came the
day after Four Foods secured a $33M financing from CIT Group, private
investors and current shareholders.
Cava Group Receives $30M Investment from Existing Investors
On March 28, 2017, Washington, D.C.-based, Mediterranean-focused Cava
Group received a $30M investment from existing equity holders Invus,
Revolution Growth and Swan & Legend in a series C funding round. Cava
has 27 locations across Washington, D.C., Los Angeles, Orange County
and New York City and sells its packaged dips and spreads in more than
200 Whole Foods Market stores. The three investors were part of a $45M
Series B investment in the company in September 2015 and look to
continue ongoing innovation and footprint expansion in the future.
Darden Restaurants to Acquire Cheddar’s Casual Café for $780M
On March 27, 2017, Darden Restaurants agreed to acquire Cheddar’s
Casual Café, the Dallas-based operator and franchisor of casual dining
concept Cheddar’s Scratch Kitchen, for $780M in cash. The acquisition
comes after Cheddar’s acquired 44-unit Greer Companies, its largest
franchisee, in January 2017 and gives Darden Restaurants its eighth brand.
Cheddar’s 165 locations will add to Darden’s portfolio, which currently
includes LongHorn Steakhouse, The Capital Grille, Yard House and others.
The LTM transaction multiple was approximately 10.4x EBITDA.
Noodles & Co. Sells $31.5M of Shares to Mill Road Capital
On March 14, 2017, Mill Road Capital acquired $31.5M of newly issued
common stock in Noodles & Co, the Broomsfield, Colorado-based fast
casual noodles and pasta concept. The transaction marks the second stock
sale this year for Noodles & Co., which sold $18.5M in preferred stock to L
Catterton in February concurrently with its announcement to close 55
underperforming restaurants. The company, which has nearly 500 locations
nationwide, has faced a precipitous decline in same-store sales and traffic
over the past year, leading to a $71.7M loss on $487.5M in 2016 revenue.
Capital Markets Industry Insights | Q1 2016Duff & Phelps Restaurant Monthly Update | May 2017
Selected Recent Duff & Phelps Restaurant
Transactions
Page 21
has been acquired by
Sell-Side Advisor
a portfolio company of
has completed a leveraged
dividend recapitalization
transaction.
Board Advisor
a portfolio company of
has been acquired by
a portfolio company of
has been acquired by
a division of
has been acquired by
Sell-Side Advisor Sell-Side Advisor Sell-Side Advisor
has completed a spin-off of
Board Advisor
has been acquired by
Sell-Side Advisor
has been acquired by
Board Advisor
has secured senior debt
financing from
Placement Agent
a portfolio company of
has been acquired by
Sell-Side Advisor
has been acquired bya portfolio company of
has been acquired by
Duff & Phelps Restaurant Monthly Update | April 2017
Joshua Benn
Global Head of Restaurants
Retail, Consumer and Food
New York
+1 212 450 2840
joshua.benn@duffandphelps.com
Contact Us
For more information please visit:
www.duffandphelps.com
Duff & Phelps is the premier global valuation and
corporate finance advisor with expertise in complex
valuation, disputes and investigations, M&A, real
estate, restructuring, and compliance and regulatory
consulting. The firm’s more than 2,000 employees
serve a diverse range of clients from offices around
the world.
M&A advisory, capital raising and secondary market advisory services in the
United States are provided by Duff & Phelps Securities, LLC. Member
FINRA/SIPC. Pagemill Partners is a Division of Duff & Phelps Securities, LLC.
M&A advisory and capital raising services in Canada are provided by Duff &
Phelps Securities Canada Ltd., a registered Exempt Market Dealer. M&A
advisory and capital raising services in the United Kingdom and across Europe
are provided by Duff & Phelps Securities Ltd. (DPSL), which is authorized and
regulated by the Financial Conduct Authority. In Germany M&A advisory and
capital raising services are also provided by Duff & Phelps GmbH, which is a
Tied Agent of DPSL. Valuation Advisory Services in India are provided by Duff
& Phelps India Private Limited under a category 1 merchant banker license
issued by the Securities and Exchange Board of India.
About
Duff & Phelps
Copyright © 2017 Duff & Phelps LLC. All rights reserved.
Duff & Phelps Restaurant Monthly | May 2017
Darren Gange
Managing Director
New York
+1 212 871 9429
darren.gange@duffandphelps.com
Farzad Mukhi
Director
Los Angeles
+1 424 249 1661
farzad.mukhi@duffandphelps.com
Henry Wells
Managing Director
London
+44 207 089 4876
henry.wells@duffandphelps.com

More Related Content

What's hot

Restaurant Monthly Update January 2018
Restaurant Monthly Update January 2018Restaurant Monthly Update January 2018
Restaurant Monthly Update January 2018
Duff & Phelps
 
Restaurant Industry Insights - November 2015
Restaurant Industry Insights - November 2015Restaurant Industry Insights - November 2015
Restaurant Industry Insights - November 2015
Duff & Phelps
 
Harmon_Lindsey_SBUX_PNRA (1)
Harmon_Lindsey_SBUX_PNRA (1)Harmon_Lindsey_SBUX_PNRA (1)
Harmon_Lindsey_SBUX_PNRA (1)Lindsey Harmon
 
Mercer Capital's Value Focus: Convenience Store Industry | Q2 2015 | Segment:...
Mercer Capital's Value Focus: Convenience Store Industry | Q2 2015 | Segment:...Mercer Capital's Value Focus: Convenience Store Industry | Q2 2015 | Segment:...
Mercer Capital's Value Focus: Convenience Store Industry | Q2 2015 | Segment:...
Mercer Capital
 
Mercer Capital's Value Focus: Convenience Store Industry | Q4 2015 | Segment:...
Mercer Capital's Value Focus: Convenience Store Industry | Q4 2015 | Segment:...Mercer Capital's Value Focus: Convenience Store Industry | Q4 2015 | Segment:...
Mercer Capital's Value Focus: Convenience Store Industry | Q4 2015 | Segment:...
Mercer Capital
 
Chipotle valuation project.pdf
Chipotle valuation project.pdfChipotle valuation project.pdf
Chipotle valuation project.pdf
Yexin (Olivia) Wan
 
Mercer Capital's Value Focus: Convenience Store Industry | Q1 2016 | Segment:...
Mercer Capital's Value Focus: Convenience Store Industry | Q1 2016 | Segment:...Mercer Capital's Value Focus: Convenience Store Industry | Q1 2016 | Segment:...
Mercer Capital's Value Focus: Convenience Store Industry | Q1 2016 | Segment:...
Mercer Capital
 
Long Island Iced Tea Cor (OTCQB:LTEA)
Long Island Iced Tea Cor (OTCQB:LTEA)Long Island Iced Tea Cor (OTCQB:LTEA)
Long Island Iced Tea Cor (OTCQB:LTEA)
RedChip Companies, Inc.
 
Restaurant Quarterly Update - Fall 2018
Restaurant Quarterly Update - Fall 2018Restaurant Quarterly Update - Fall 2018
Restaurant Quarterly Update - Fall 2018
Duff & Phelps
 
Sack Lunch Productions (OTC:SAKL)
Sack Lunch Productions (OTC:SAKL)Sack Lunch Productions (OTC:SAKL)
Sack Lunch Productions (OTC:SAKL)
RedChip Companies, Inc.
 
Q1 2020 | Houston Retail | Research & Forecast Report
Q1 2020 | Houston Retail | Research & Forecast ReportQ1 2020 | Houston Retail | Research & Forecast Report
Q1 2020 | Houston Retail | Research & Forecast Report
Colliers International | Houston
 
Us gaap v ifrs dec 2011
Us gaap v ifrs dec 2011Us gaap v ifrs dec 2011
Us gaap v ifrs dec 2011Vanessa Parks
 
Mercer Capital's Value Focus: Convenience Store Industry | Q3 2016 | Segment:...
Mercer Capital's Value Focus: Convenience Store Industry | Q3 2016 | Segment:...Mercer Capital's Value Focus: Convenience Store Industry | Q3 2016 | Segment:...
Mercer Capital's Value Focus: Convenience Store Industry | Q3 2016 | Segment:...
Mercer Capital
 
Mercer Capital's Value Focus: Convenience Store Industry | Q1 2015 | Segment:...
Mercer Capital's Value Focus: Convenience Store Industry | Q1 2015 | Segment:...Mercer Capital's Value Focus: Convenience Store Industry | Q1 2015 | Segment:...
Mercer Capital's Value Focus: Convenience Store Industry | Q1 2015 | Segment:...
Mercer Capital
 
U.S. Foodservice Landscape 2010: Restaurant Industry and Consumer Trends, Mom...
U.S. Foodservice Landscape 2010: Restaurant Industry and Consumer Trends, Mom...U.S. Foodservice Landscape 2010: Restaurant Industry and Consumer Trends, Mom...
U.S. Foodservice Landscape 2010: Restaurant Industry and Consumer Trends, Mom...MarketResearch.com
 
Restaurant Consultant Aaron Allen
Restaurant Consultant Aaron AllenRestaurant Consultant Aaron Allen
Restaurant Consultant Aaron Allen
Aaron Allen
 
Daily livestock report mar 04 2013
Daily livestock report mar 04 2013Daily livestock report mar 04 2013
Daily livestock report mar 04 2013joseleorcasita
 
Kraft heinz
Kraft heinzKraft heinz
Kraft heinz
Salman Ahmed
 
Restaurant Industry Investment Activity Q1 2017
Restaurant Industry Investment Activity Q1 2017Restaurant Industry Investment Activity Q1 2017
Restaurant Industry Investment Activity Q1 2017
Aaron Allen
 

What's hot (20)

Restaurant Monthly Update January 2018
Restaurant Monthly Update January 2018Restaurant Monthly Update January 2018
Restaurant Monthly Update January 2018
 
Restaurant Industry Insights - November 2015
Restaurant Industry Insights - November 2015Restaurant Industry Insights - November 2015
Restaurant Industry Insights - November 2015
 
Harmon_Lindsey_SBUX_PNRA (1)
Harmon_Lindsey_SBUX_PNRA (1)Harmon_Lindsey_SBUX_PNRA (1)
Harmon_Lindsey_SBUX_PNRA (1)
 
Mercer Capital's Value Focus: Convenience Store Industry | Q2 2015 | Segment:...
Mercer Capital's Value Focus: Convenience Store Industry | Q2 2015 | Segment:...Mercer Capital's Value Focus: Convenience Store Industry | Q2 2015 | Segment:...
Mercer Capital's Value Focus: Convenience Store Industry | Q2 2015 | Segment:...
 
Mercer Capital's Value Focus: Convenience Store Industry | Q4 2015 | Segment:...
Mercer Capital's Value Focus: Convenience Store Industry | Q4 2015 | Segment:...Mercer Capital's Value Focus: Convenience Store Industry | Q4 2015 | Segment:...
Mercer Capital's Value Focus: Convenience Store Industry | Q4 2015 | Segment:...
 
Chipotle valuation project.pdf
Chipotle valuation project.pdfChipotle valuation project.pdf
Chipotle valuation project.pdf
 
Mercer Capital's Value Focus: Convenience Store Industry | Q1 2016 | Segment:...
Mercer Capital's Value Focus: Convenience Store Industry | Q1 2016 | Segment:...Mercer Capital's Value Focus: Convenience Store Industry | Q1 2016 | Segment:...
Mercer Capital's Value Focus: Convenience Store Industry | Q1 2016 | Segment:...
 
Long Island Iced Tea Cor (OTCQB:LTEA)
Long Island Iced Tea Cor (OTCQB:LTEA)Long Island Iced Tea Cor (OTCQB:LTEA)
Long Island Iced Tea Cor (OTCQB:LTEA)
 
Restaurant Quarterly Update - Fall 2018
Restaurant Quarterly Update - Fall 2018Restaurant Quarterly Update - Fall 2018
Restaurant Quarterly Update - Fall 2018
 
Sack Lunch Productions (OTC:SAKL)
Sack Lunch Productions (OTC:SAKL)Sack Lunch Productions (OTC:SAKL)
Sack Lunch Productions (OTC:SAKL)
 
Q1 2020 | Houston Retail | Research & Forecast Report
Q1 2020 | Houston Retail | Research & Forecast ReportQ1 2020 | Houston Retail | Research & Forecast Report
Q1 2020 | Houston Retail | Research & Forecast Report
 
2009 annual review
2009 annual review2009 annual review
2009 annual review
 
Us gaap v ifrs dec 2011
Us gaap v ifrs dec 2011Us gaap v ifrs dec 2011
Us gaap v ifrs dec 2011
 
Mercer Capital's Value Focus: Convenience Store Industry | Q3 2016 | Segment:...
Mercer Capital's Value Focus: Convenience Store Industry | Q3 2016 | Segment:...Mercer Capital's Value Focus: Convenience Store Industry | Q3 2016 | Segment:...
Mercer Capital's Value Focus: Convenience Store Industry | Q3 2016 | Segment:...
 
Mercer Capital's Value Focus: Convenience Store Industry | Q1 2015 | Segment:...
Mercer Capital's Value Focus: Convenience Store Industry | Q1 2015 | Segment:...Mercer Capital's Value Focus: Convenience Store Industry | Q1 2015 | Segment:...
Mercer Capital's Value Focus: Convenience Store Industry | Q1 2015 | Segment:...
 
U.S. Foodservice Landscape 2010: Restaurant Industry and Consumer Trends, Mom...
U.S. Foodservice Landscape 2010: Restaurant Industry and Consumer Trends, Mom...U.S. Foodservice Landscape 2010: Restaurant Industry and Consumer Trends, Mom...
U.S. Foodservice Landscape 2010: Restaurant Industry and Consumer Trends, Mom...
 
Restaurant Consultant Aaron Allen
Restaurant Consultant Aaron AllenRestaurant Consultant Aaron Allen
Restaurant Consultant Aaron Allen
 
Daily livestock report mar 04 2013
Daily livestock report mar 04 2013Daily livestock report mar 04 2013
Daily livestock report mar 04 2013
 
Kraft heinz
Kraft heinzKraft heinz
Kraft heinz
 
Restaurant Industry Investment Activity Q1 2017
Restaurant Industry Investment Activity Q1 2017Restaurant Industry Investment Activity Q1 2017
Restaurant Industry Investment Activity Q1 2017
 

Similar to Restaurant Monthly Update - May 2017

Mercer Capital's Value Focus: Convenience Store Industry | Q1 2017 | Segment:...
Mercer Capital's Value Focus: Convenience Store Industry | Q1 2017 | Segment:...Mercer Capital's Value Focus: Convenience Store Industry | Q1 2017 | Segment:...
Mercer Capital's Value Focus: Convenience Store Industry | Q1 2017 | Segment:...
Mercer Capital
 
20170313 sauc roth conference presentation final
20170313 sauc roth conference presentation final20170313 sauc roth conference presentation final
20170313 sauc roth conference presentation final
drhincorporated
 
CPG Trend Analysis and Growth Opportunities across Retail Channels
CPG Trend Analysis and Growth Opportunities across Retail ChannelsCPG Trend Analysis and Growth Opportunities across Retail Channels
CPG Trend Analysis and Growth Opportunities across Retail Channels
Information Resources Inc.
 
20170310 sauc q4 earnings slides final
20170310 sauc q4 earnings slides final20170310 sauc q4 earnings slides final
20170310 sauc q4 earnings slides final
drhincorporated
 
Q3 fy17 earnings-slides-final
Q3 fy17 earnings-slides-finalQ3 fy17 earnings-slides-final
Q3 fy17 earnings-slides-final
irusfoods
 
Sauc q2 2017 financial results v final
Sauc q2 2017 financial results v finalSauc q2 2017 financial results v final
Sauc q2 2017 financial results v final
drhincorporated
 
Mercer Capital's Value Focus: Convenience Store Industry | Q2 2016 | Segment:...
Mercer Capital's Value Focus: Convenience Store Industry | Q2 2016 | Segment:...Mercer Capital's Value Focus: Convenience Store Industry | Q2 2016 | Segment:...
Mercer Capital's Value Focus: Convenience Store Industry | Q2 2016 | Segment:...
Mercer Capital
 
20170505 sauc q1 2017 teleconference slides final
20170505 sauc q1 2017 teleconference slides final20170505 sauc q1 2017 teleconference slides final
20170505 sauc q1 2017 teleconference slides final
drhincorporated
 
Diplomat fourth-quarter-2015-operating-results
Diplomat fourth-quarter-2015-operating-resultsDiplomat fourth-quarter-2015-operating-results
Diplomat fourth-quarter-2015-operating-results
DiplomatIR
 
Camil Institutional Presentation June/2018
Camil Institutional Presentation June/2018Camil Institutional Presentation June/2018
Camil Institutional Presentation June/2018
CAMILRI
 
20171103 sauc q3 2017 teleconference slides final
20171103 sauc q3 2017 teleconference slides final20171103 sauc q3 2017 teleconference slides final
20171103 sauc q3 2017 teleconference slides final
drhincorporated
 
Midwest IDEAS Conference
Midwest IDEAS ConferenceMidwest IDEAS Conference
Midwest IDEAS Conference
drhincorporated
 
Weis Markets' People-First Data Strategy
Weis Markets' People-First Data Strategy Weis Markets' People-First Data Strategy
Weis Markets' People-First Data Strategy
MediaPost
 
Case analysis papa john's pizza group 1_final draft
Case analysis papa john's pizza group 1_final draftCase analysis papa john's pizza group 1_final draft
Case analysis papa john's pizza group 1_final draft
Alexander Martinus Christian, S.H., MBA
 
Case analysis papa john's pizza group 1_final draft
Case analysis papa john's pizza group 1_final draftCase analysis papa john's pizza group 1_final draft
Case analysis papa john's pizza group 1_final draft
Alexander Martinus Christian, S.H., MBA
 
20180509 sauc q1 2018 teleconference slides final
20180509 sauc q1 2018 teleconference slides final20180509 sauc q1 2018 teleconference slides final
20180509 sauc q1 2018 teleconference slides final
drhincorporated
 
Restaurant Monthly Update - January 2017
Restaurant Monthly Update - January 2017Restaurant Monthly Update - January 2017
Restaurant Monthly Update - January 2017
Duff & Phelps
 
Initial Valuation Report Chipotle Mexican Grill, Inc.docx
Initial Valuation Report Chipotle Mexican Grill, Inc.docxInitial Valuation Report Chipotle Mexican Grill, Inc.docx
Initial Valuation Report Chipotle Mexican Grill, Inc.docx
carliotwaycave
 
4 q15
4 q154 q15
4 q15
Profarma
 
Rok q4 fy17 er charts v final (no pw)
Rok q4 fy17 er charts v final (no pw)Rok q4 fy17 er charts v final (no pw)
Rok q4 fy17 er charts v final (no pw)
rockwell_collins
 

Similar to Restaurant Monthly Update - May 2017 (20)

Mercer Capital's Value Focus: Convenience Store Industry | Q1 2017 | Segment:...
Mercer Capital's Value Focus: Convenience Store Industry | Q1 2017 | Segment:...Mercer Capital's Value Focus: Convenience Store Industry | Q1 2017 | Segment:...
Mercer Capital's Value Focus: Convenience Store Industry | Q1 2017 | Segment:...
 
20170313 sauc roth conference presentation final
20170313 sauc roth conference presentation final20170313 sauc roth conference presentation final
20170313 sauc roth conference presentation final
 
CPG Trend Analysis and Growth Opportunities across Retail Channels
CPG Trend Analysis and Growth Opportunities across Retail ChannelsCPG Trend Analysis and Growth Opportunities across Retail Channels
CPG Trend Analysis and Growth Opportunities across Retail Channels
 
20170310 sauc q4 earnings slides final
20170310 sauc q4 earnings slides final20170310 sauc q4 earnings slides final
20170310 sauc q4 earnings slides final
 
Q3 fy17 earnings-slides-final
Q3 fy17 earnings-slides-finalQ3 fy17 earnings-slides-final
Q3 fy17 earnings-slides-final
 
Sauc q2 2017 financial results v final
Sauc q2 2017 financial results v finalSauc q2 2017 financial results v final
Sauc q2 2017 financial results v final
 
Mercer Capital's Value Focus: Convenience Store Industry | Q2 2016 | Segment:...
Mercer Capital's Value Focus: Convenience Store Industry | Q2 2016 | Segment:...Mercer Capital's Value Focus: Convenience Store Industry | Q2 2016 | Segment:...
Mercer Capital's Value Focus: Convenience Store Industry | Q2 2016 | Segment:...
 
20170505 sauc q1 2017 teleconference slides final
20170505 sauc q1 2017 teleconference slides final20170505 sauc q1 2017 teleconference slides final
20170505 sauc q1 2017 teleconference slides final
 
Diplomat fourth-quarter-2015-operating-results
Diplomat fourth-quarter-2015-operating-resultsDiplomat fourth-quarter-2015-operating-results
Diplomat fourth-quarter-2015-operating-results
 
Camil Institutional Presentation June/2018
Camil Institutional Presentation June/2018Camil Institutional Presentation June/2018
Camil Institutional Presentation June/2018
 
20171103 sauc q3 2017 teleconference slides final
20171103 sauc q3 2017 teleconference slides final20171103 sauc q3 2017 teleconference slides final
20171103 sauc q3 2017 teleconference slides final
 
Midwest IDEAS Conference
Midwest IDEAS ConferenceMidwest IDEAS Conference
Midwest IDEAS Conference
 
Weis Markets' People-First Data Strategy
Weis Markets' People-First Data Strategy Weis Markets' People-First Data Strategy
Weis Markets' People-First Data Strategy
 
Case analysis papa john's pizza group 1_final draft
Case analysis papa john's pizza group 1_final draftCase analysis papa john's pizza group 1_final draft
Case analysis papa john's pizza group 1_final draft
 
Case analysis papa john's pizza group 1_final draft
Case analysis papa john's pizza group 1_final draftCase analysis papa john's pizza group 1_final draft
Case analysis papa john's pizza group 1_final draft
 
20180509 sauc q1 2018 teleconference slides final
20180509 sauc q1 2018 teleconference slides final20180509 sauc q1 2018 teleconference slides final
20180509 sauc q1 2018 teleconference slides final
 
Restaurant Monthly Update - January 2017
Restaurant Monthly Update - January 2017Restaurant Monthly Update - January 2017
Restaurant Monthly Update - January 2017
 
Initial Valuation Report Chipotle Mexican Grill, Inc.docx
Initial Valuation Report Chipotle Mexican Grill, Inc.docxInitial Valuation Report Chipotle Mexican Grill, Inc.docx
Initial Valuation Report Chipotle Mexican Grill, Inc.docx
 
4 q15
4 q154 q15
4 q15
 
Rok q4 fy17 er charts v final (no pw)
Rok q4 fy17 er charts v final (no pw)Rok q4 fy17 er charts v final (no pw)
Rok q4 fy17 er charts v final (no pw)
 

More from Duff & Phelps

Hospitalist M&A Landscape – Winter 2018 – 2019
Hospitalist M&A Landscape – Winter 2018 – 2019Hospitalist M&A Landscape – Winter 2018 – 2019
Hospitalist M&A Landscape – Winter 2018 – 2019
Duff & Phelps
 
Food and Beverage M&A Landscape Late Fall 2018
Food and Beverage M&A Landscape Late Fall 2018Food and Beverage M&A Landscape Late Fall 2018
Food and Beverage M&A Landscape Late Fall 2018
Duff & Phelps
 
Healthcare Services Sector Update – November 2018
Healthcare Services Sector Update – November 2018Healthcare Services Sector Update – November 2018
Healthcare Services Sector Update – November 2018
Duff & Phelps
 
Capital Markets Insights – Late Fall 2018
Capital Markets Insights – Late Fall 2018Capital Markets Insights – Late Fall 2018
Capital Markets Insights – Late Fall 2018
Duff & Phelps
 
Regulatory Watch: Asset Management Q3
Regulatory Watch: Asset Management Q3Regulatory Watch: Asset Management Q3
Regulatory Watch: Asset Management Q3
Duff & Phelps
 
Industry Multiples India Report: Fifth Edition
Industry Multiples India Report: Fifth Edition Industry Multiples India Report: Fifth Edition
Industry Multiples India Report: Fifth Edition
Duff & Phelps
 
LEED Market Study - Nov 2018
LEED Market Study - Nov 2018LEED Market Study - Nov 2018
LEED Market Study - Nov 2018
Duff & Phelps
 
Healthcare Services Sector Update – October 2018
Healthcare Services Sector Update – October 2018Healthcare Services Sector Update – October 2018
Healthcare Services Sector Update – October 2018
Duff & Phelps
 
IP Value Summit 2018 - Agenda
 IP Value Summit 2018 - Agenda IP Value Summit 2018 - Agenda
IP Value Summit 2018 - Agenda
Duff & Phelps
 
Regulatory Focus October 2018
Regulatory Focus October 2018Regulatory Focus October 2018
Regulatory Focus October 2018
Duff & Phelps
 
Staffing Industry Insights - Fall 2018
Staffing Industry Insights - Fall 2018Staffing Industry Insights - Fall 2018
Staffing Industry Insights - Fall 2018
Duff & Phelps
 
Medical Device Contract Manufacturing Update – Fall 2018
Medical Device Contract Manufacturing Update – Fall 2018Medical Device Contract Manufacturing Update – Fall 2018
Medical Device Contract Manufacturing Update – Fall 2018
Duff & Phelps
 
Duff & Phelps Valuation Insights Greater China Edition October 2018
Duff & Phelps Valuation Insights Greater China Edition October 2018Duff & Phelps Valuation Insights Greater China Edition October 2018
Duff & Phelps Valuation Insights Greater China Edition October 2018
Duff & Phelps
 
Canadian M&A Insights Fall 2018
Canadian M&A Insights Fall 2018Canadian M&A Insights Fall 2018
Canadian M&A Insights Fall 2018
Duff & Phelps
 
Healthcare Services Sector Update September 2018
Healthcare Services Sector Update September 2018Healthcare Services Sector Update September 2018
Healthcare Services Sector Update September 2018
Duff & Phelps
 
Cost Trend Update Bulletin July-2018
Cost Trend Update Bulletin July-2018Cost Trend Update Bulletin July-2018
Cost Trend Update Bulletin July-2018
Duff & Phelps
 
Regulatory Focus September 2018
Regulatory Focus September 2018Regulatory Focus September 2018
Regulatory Focus September 2018
Duff & Phelps
 
Hedge Fund and Private Equity Fund - Structures, Regulation and Criminal Risks
Hedge Fund and Private Equity Fund - Structures, Regulation and Criminal RisksHedge Fund and Private Equity Fund - Structures, Regulation and Criminal Risks
Hedge Fund and Private Equity Fund - Structures, Regulation and Criminal Risks
Duff & Phelps
 
Food and Beverage M&A Landscape - Summer 2018
Food and Beverage M&A Landscape - Summer 2018Food and Beverage M&A Landscape - Summer 2018
Food and Beverage M&A Landscape - Summer 2018
Duff & Phelps
 
Apparel Quarterly Update – Summer 2018
Apparel Quarterly Update – Summer 2018Apparel Quarterly Update – Summer 2018
Apparel Quarterly Update – Summer 2018
Duff & Phelps
 

More from Duff & Phelps (20)

Hospitalist M&A Landscape – Winter 2018 – 2019
Hospitalist M&A Landscape – Winter 2018 – 2019Hospitalist M&A Landscape – Winter 2018 – 2019
Hospitalist M&A Landscape – Winter 2018 – 2019
 
Food and Beverage M&A Landscape Late Fall 2018
Food and Beverage M&A Landscape Late Fall 2018Food and Beverage M&A Landscape Late Fall 2018
Food and Beverage M&A Landscape Late Fall 2018
 
Healthcare Services Sector Update – November 2018
Healthcare Services Sector Update – November 2018Healthcare Services Sector Update – November 2018
Healthcare Services Sector Update – November 2018
 
Capital Markets Insights – Late Fall 2018
Capital Markets Insights – Late Fall 2018Capital Markets Insights – Late Fall 2018
Capital Markets Insights – Late Fall 2018
 
Regulatory Watch: Asset Management Q3
Regulatory Watch: Asset Management Q3Regulatory Watch: Asset Management Q3
Regulatory Watch: Asset Management Q3
 
Industry Multiples India Report: Fifth Edition
Industry Multiples India Report: Fifth Edition Industry Multiples India Report: Fifth Edition
Industry Multiples India Report: Fifth Edition
 
LEED Market Study - Nov 2018
LEED Market Study - Nov 2018LEED Market Study - Nov 2018
LEED Market Study - Nov 2018
 
Healthcare Services Sector Update – October 2018
Healthcare Services Sector Update – October 2018Healthcare Services Sector Update – October 2018
Healthcare Services Sector Update – October 2018
 
IP Value Summit 2018 - Agenda
 IP Value Summit 2018 - Agenda IP Value Summit 2018 - Agenda
IP Value Summit 2018 - Agenda
 
Regulatory Focus October 2018
Regulatory Focus October 2018Regulatory Focus October 2018
Regulatory Focus October 2018
 
Staffing Industry Insights - Fall 2018
Staffing Industry Insights - Fall 2018Staffing Industry Insights - Fall 2018
Staffing Industry Insights - Fall 2018
 
Medical Device Contract Manufacturing Update – Fall 2018
Medical Device Contract Manufacturing Update – Fall 2018Medical Device Contract Manufacturing Update – Fall 2018
Medical Device Contract Manufacturing Update – Fall 2018
 
Duff & Phelps Valuation Insights Greater China Edition October 2018
Duff & Phelps Valuation Insights Greater China Edition October 2018Duff & Phelps Valuation Insights Greater China Edition October 2018
Duff & Phelps Valuation Insights Greater China Edition October 2018
 
Canadian M&A Insights Fall 2018
Canadian M&A Insights Fall 2018Canadian M&A Insights Fall 2018
Canadian M&A Insights Fall 2018
 
Healthcare Services Sector Update September 2018
Healthcare Services Sector Update September 2018Healthcare Services Sector Update September 2018
Healthcare Services Sector Update September 2018
 
Cost Trend Update Bulletin July-2018
Cost Trend Update Bulletin July-2018Cost Trend Update Bulletin July-2018
Cost Trend Update Bulletin July-2018
 
Regulatory Focus September 2018
Regulatory Focus September 2018Regulatory Focus September 2018
Regulatory Focus September 2018
 
Hedge Fund and Private Equity Fund - Structures, Regulation and Criminal Risks
Hedge Fund and Private Equity Fund - Structures, Regulation and Criminal RisksHedge Fund and Private Equity Fund - Structures, Regulation and Criminal Risks
Hedge Fund and Private Equity Fund - Structures, Regulation and Criminal Risks
 
Food and Beverage M&A Landscape - Summer 2018
Food and Beverage M&A Landscape - Summer 2018Food and Beverage M&A Landscape - Summer 2018
Food and Beverage M&A Landscape - Summer 2018
 
Apparel Quarterly Update – Summer 2018
Apparel Quarterly Update – Summer 2018Apparel Quarterly Update – Summer 2018
Apparel Quarterly Update – Summer 2018
 

Recently uploaded

Roti Bank Delhi: Nourishing Lives, One Meal at a Time
Roti Bank Delhi: Nourishing Lives, One Meal at a TimeRoti Bank Delhi: Nourishing Lives, One Meal at a Time
Roti Bank Delhi: Nourishing Lives, One Meal at a Time
Roti Bank
 
Roti Bank Hyderabad: A Beacon of Hope and Nourishment
Roti Bank Hyderabad: A Beacon of Hope and NourishmentRoti Bank Hyderabad: A Beacon of Hope and Nourishment
Roti Bank Hyderabad: A Beacon of Hope and Nourishment
Roti Bank
 
Food and beverage service Restaurant Services notes V1.pptx
Food and beverage service Restaurant Services notes V1.pptxFood and beverage service Restaurant Services notes V1.pptx
Food and beverage service Restaurant Services notes V1.pptx
mangenatendaishe
 
MS Wine Day 2024 Arapitsas Advancements in Wine Metabolomics Research
MS Wine Day 2024 Arapitsas Advancements in Wine Metabolomics ResearchMS Wine Day 2024 Arapitsas Advancements in Wine Metabolomics Research
MS Wine Day 2024 Arapitsas Advancements in Wine Metabolomics Research
Panagiotis Arapitsas
 
Ang Chong Yi Navigating Singaporean Flavors: A Journey from Cultural Heritage...
Ang Chong Yi Navigating Singaporean Flavors: A Journey from Cultural Heritage...Ang Chong Yi Navigating Singaporean Flavors: A Journey from Cultural Heritage...
Ang Chong Yi Navigating Singaporean Flavors: A Journey from Cultural Heritage...
Ang Chong Yi
 
Kitchen Audit at restaurant as per FSSAI act
Kitchen Audit at restaurant as per FSSAI actKitchen Audit at restaurant as per FSSAI act
Kitchen Audit at restaurant as per FSSAI act
MuthuMK13
 
Vietnam Mushroom Market Growth, Demand and Challenges of the Key Industry Pla...
Vietnam Mushroom Market Growth, Demand and Challenges of the Key Industry Pla...Vietnam Mushroom Market Growth, Demand and Challenges of the Key Industry Pla...
Vietnam Mushroom Market Growth, Demand and Challenges of the Key Industry Pla...
IMARC Group
 
SUMMER INTERNSHIP REPORT Hamdard Laboratories.docx
SUMMER INTERNSHIP REPORT Hamdard Laboratories.docxSUMMER INTERNSHIP REPORT Hamdard Laboratories.docx
SUMMER INTERNSHIP REPORT Hamdard Laboratories.docx
AmanHamza4
 

Recently uploaded (8)

Roti Bank Delhi: Nourishing Lives, One Meal at a Time
Roti Bank Delhi: Nourishing Lives, One Meal at a TimeRoti Bank Delhi: Nourishing Lives, One Meal at a Time
Roti Bank Delhi: Nourishing Lives, One Meal at a Time
 
Roti Bank Hyderabad: A Beacon of Hope and Nourishment
Roti Bank Hyderabad: A Beacon of Hope and NourishmentRoti Bank Hyderabad: A Beacon of Hope and Nourishment
Roti Bank Hyderabad: A Beacon of Hope and Nourishment
 
Food and beverage service Restaurant Services notes V1.pptx
Food and beverage service Restaurant Services notes V1.pptxFood and beverage service Restaurant Services notes V1.pptx
Food and beverage service Restaurant Services notes V1.pptx
 
MS Wine Day 2024 Arapitsas Advancements in Wine Metabolomics Research
MS Wine Day 2024 Arapitsas Advancements in Wine Metabolomics ResearchMS Wine Day 2024 Arapitsas Advancements in Wine Metabolomics Research
MS Wine Day 2024 Arapitsas Advancements in Wine Metabolomics Research
 
Ang Chong Yi Navigating Singaporean Flavors: A Journey from Cultural Heritage...
Ang Chong Yi Navigating Singaporean Flavors: A Journey from Cultural Heritage...Ang Chong Yi Navigating Singaporean Flavors: A Journey from Cultural Heritage...
Ang Chong Yi Navigating Singaporean Flavors: A Journey from Cultural Heritage...
 
Kitchen Audit at restaurant as per FSSAI act
Kitchen Audit at restaurant as per FSSAI actKitchen Audit at restaurant as per FSSAI act
Kitchen Audit at restaurant as per FSSAI act
 
Vietnam Mushroom Market Growth, Demand and Challenges of the Key Industry Pla...
Vietnam Mushroom Market Growth, Demand and Challenges of the Key Industry Pla...Vietnam Mushroom Market Growth, Demand and Challenges of the Key Industry Pla...
Vietnam Mushroom Market Growth, Demand and Challenges of the Key Industry Pla...
 
SUMMER INTERNSHIP REPORT Hamdard Laboratories.docx
SUMMER INTERNSHIP REPORT Hamdard Laboratories.docxSUMMER INTERNSHIP REPORT Hamdard Laboratories.docx
SUMMER INTERNSHIP REPORT Hamdard Laboratories.docx
 

Restaurant Monthly Update - May 2017

  • 1. 1 M a y 2 0 1 7 Restaurant Monthly Update
  • 2. Duff & Phelps Restaurant Monthly Update | May 2017 Market Update K E Y I N F O R M A T I O N Fine dining, upscale casual and family casual restaurants were the strongest performing sectors of the month April same-store sales and traffic declined -1.0% and -3.3%, respectively Year-over-year job growth grew +1.5% in April, demonstrating an improvement in persistent industry workforce difficulties Numerous restaurant concepts have turned toward offering additional financial incentives to attract candidates to tougher-to-recruit positions April restaurant survey data indicated a -1.0% decline in same-store sales (SSS) and -3.3% decline in traffic. Although industry same-store sales have remained negative for 12 out of the past 13 months, April results reflected a marginal improvement from the results seen in both February and March. Overall, the first quarter recorded a -1.6% decline in same-store sales and a -3.6% decline in traffic compared to the same period in 2016. California emerged as the best-performing region in the first month of the second quarter, logging same-store sales gains of +1.9% in April amid declining traffic of -0.7%. The worst-performing region in April was the U.S. Southwest area, which reported significant same-store sales and traffic declines of -2.7% and -4.9%, respectively, and fell below the New York-New Jersey area, which was the worst performing region in March. Based on performance, fine dining, upscale casual, and family casual displayed the strongest gains in same-store sales and traffic improvements in April. These three segments were all positively impacted by a shift in the Easter holiday. The two weakest sectors in the first month of the second quarter were QSR, which had previously been one of the top performing industry segments, and fast casual. The first quarter of 2017 marked the fifth consecutive quarter of negative results, highlighting the persistent difficulties throughout the industry. Employee turnover rates remain on the forefront of issues facing restaurant operators, who have consistently seen increased labor market challenges amid pressures to control costs. According to TDn2K’s Black Box report, year-over-year job growth fell -2.3% in March but saw a +1.5% rise in April. To reverse this trend, the top-performing restaurants have begun finding ways to improve the employee experience by investing in staff development and technology improvements. Furthermore, nearly 80% of restaurant companies surveyed by the report have begun offering additional financial incentives, such as higher base pay, to attract candidates to tougher-to- recruit positions. Despite the catch-up of delayed IRS tax refunds in March, the near industrywide decline in same-store sales and traffic for the month of April highlights that restaurants have not yet found a way to overcome the general industry malaise driven by the oversupply of concepts and grocery-pricing disparity. Source: Nation’s Restaurant News, TDn2K’s Black Box Intelligence, and The Wall Street JournalPage 2
  • 3. Duff & Phelps Restaurant Monthly Update | May 2017 Darden Restaurants’ Acquisition of Cheddar’s Scratch Kitchen Despite challenges faced in the industry, M&A activity remain strong and strategics have increased their appetite in acquiring concepts that provide an avenue for increased growth. On March 27, 2017, Darden Restaurants announced its acquisition of Cheddar’s Casual Café, the Dallas-based operator and franchisor of casual dining concept Cheddar’s Scratch Kitchen, from existing shareholders L Catterton and Oak Investment Partners for $780 million in cash. Founded in 1979, Cheddar’s specializes in the made-from-scratch cooking of American cuisine favorites within its modern décor design. According to Darden’s Q3 2017 investor presentation, Cheddar’s Scratch Kitchen restaurants generated $617 million in revenue and $72 million in adjusted EBITDA in 2016. Furthermore, the concept generates an average customer check of $13.50 and average restaurant volume of $4.4 million. Darden will look to support Cheddar’s expansion pipeline, which currently includes three locations under construction, six signed leases and three additional letters of intent for new units. The acquisition comes after Cheddar’s acquired 44-unit Greer Companies, its largest franchisee, in January 2017, increasing its company-owned restaurant count to 140 out of 165 total locations nationwide. Cheddar’s will add to Darden’s diverse restaurant portfolio, which currently includes Olive Garden, LongHorn Steakhouse, The Capital Grille, Yard House and others. The LTM transaction multiple was approximately 10.4x EBITDA, net of approximately $30 million in estimated tax benefits. Darden expects to realize run-rate synergies of $20 million to $25 million, representing approximately 4% of sales. Pro forma for synergies, Darden’s acquisition multiple was roughly 8x EBITDA. Darden completed the transaction on April 24, 2017, funded with cash on hand and the proceeds of $500 million of 3.85% senior notes maturing in 2027. Page 3 Source: Nation’s Restaurant News, TDn2K’s Black Box Intelligence, Morningstar and The Wall Street Journal $269M $264M $89M 33.0% margin $93M 34.6% margin 56 Units 843 Units 36 Units 165 Units 17 Units 65 Units 2016 Q1 Q2 Q3 Q4 Bahama Breeze 9.9%  5.4%  3.9%  2.6%  The Capital Grille 5.3%  1.5%  (1.2%)  1.2%  Eddie V's 4.1%  0.9%  (1.7%)  2.7%  LongHorn Steakhouse 5.2%  1.1%  0.6%  0.1%  Olive Garden 6.8%  1.6%  2.0%  2.6%  Seasons 52 5.7%  3.7%  0.7%  (0.3%)  Yard House 3.9%  1.4%  0.0%  0.7%  Darden Restaurants’ SSS Performance and Unit Count 40 Units 488 Units
  • 4. Capital Markets Industry Insights | Q1 2016Duff & Phelps Restaurant Monthly Update | May 2017 2.2% 1.6% 2.3% 2.0% 2.1% 1.4% 0.0% 0.6% 0.7% (0.8%) 0.7% (0.5%) (0.8%) 0.0% (1.1%) (1.4%) (0.6%) (1.1%) (0.9%) (1.3%) (4.3%) 0.0% (3.7%) (1.1%) (1.0%) (1.0%) (1.8%) (1.1%) (0.6%) (0.6%) (1.0%) (2.5%) (1.5%) (1.9%) (3.1%) (1.1%) (2.4%) (3.2%) (2.3%) (3.5%) (3.9%) (2.7%) (3.5%) (3.4%) (3.3%) (6.4%) (2.5%) (5.0%) (3.4%) (3.3%) (8.0%) (6.0%) (4.0%) (2.0%) 0.0% 2.0% 4.0% 6.0% 8.0% 4/2015 5/2015 6/2015 7/2015 8/2015 9/2015 10/2015 11/2015 12/2015 1/2016 2/2016 3/2016 4/2016 5/2016 6/2016 7/2016 8/2016 9/2016 10/2016 11/2016 12/2016 1/2017 2/2017 3/2017 4/2017 Same-Store Sales Traffic Restaurant Sector Monthly Same-Store Sales and Traffic Growth Source: Nation’s Restaurant News, TDn2k’s Black Box Intelligence April marked the 12th month of declining same- store sales and traffic since March 2016 Page 4
  • 5. Capital Markets Industry Insights | Q1 2016Duff & Phelps Restaurant Monthly Update | May 2017 Quarterly Same-Store Sales Performance – Last 2 Years Source: SEC filings, S&P Global Market Intelligence, Mergermarket, company press releases and various news sources (e.g., New York Times DealBook, The Deal, The Wall Street Journal, etc.) Same-store sales represents the change in year-over-year sales for restaurants that have been open for at least 18 months. Represents most actively traded public restaurant companies; Mass Casual set excludes Bob Evans due to transaction announcementPage 5 2014 2015 2016 Q4 Q1 Q2 Q3 Q4 Q1 Q2 Q3 Q4 Mass Casual Cracker Barrel Old Country Store, Inc. 7.9%  5.2%  3.8%  2.5%  0.6%  2.3%  3.2%  1.3%  0.6%  Brinker International, Inc. Chili's Grill & Bar 4.2%  2.2%  0.1%  (1.1%)  (2.1%)  (3.6%)  (1.8%)  (1.4%)  (3.1%)  Maggiano's Little Italy 2.3%  0.1%  (0.1%)  (1.7%)  (1.8%)  0.2%  (1.7%)  (0.6%)  (0.8%)  Bloomin' Brands, Inc. Bonefish Grill 0.7%  0.9%  (4.6%)  (6.1%)  (5.4%)  (2.7%)  0.9%  1.7%  (1.9%)  Carrabba's Italian Grill 0.3%  1.9%  0.9%  (2.0%)  (4.0%)  (2.0%)  (4.8%)  (2.1%)  (2.3%)  Fleming's Prime Steakhouse & Wine Bar 3.4%  3.0%  3.2%  (0.6%)  (0.3%)  1.3%  (0.8%)  (1.9%)  0.2%  Outback Steakhouse 6.4%  5.0%  4.0%  0.1%  (2.2%)  (1.3%)  (2.5%)  (0.7%)  (4.8%)  DineEquity, Inc. Applebee's 2.8%  2.9%  1.0%  (0.5%)  (2.5%)  (3.7%)  (4.2%)  (5.2%)  (7.2%)  IHOP 6.1%  4.8%  6.2%  5.8%  1.4%  1.5%  0.2%  (0.1%)  (2.1%)  Biglari Holdings Inc. 2.9%  6.0%  4.8%  3.0%  3.6%  1.8%  (0.7%)  0.2%  (0.4%)  Denny's Corporation 4.7%  7.2%  7.3%  6.1%  2.9%  2.5%  (0.5%)  1.0%  0.5%  Red Robin Gourmet Burgers Inc. 4.3%  3.8%  3.6%  3.7%  (1.6%)  (2.2%)  (3.2%)  (3.6%)  (4.3%)  Ruby Tuesday, Inc. (1.0%)  (0.3%)  (1.7%)  0.6%  0.8%  (3.1%)  (3.7%)  (2.7%)  (4.1%)  Luby's, Inc. 0.2%  3.1%  (1.0%)  0.2%  1.2%  3.1%  (0.6%)  0.7%  (2.3%)  Ignite Restaurant Group, Inc. Brick House Tavern + Tap 5.7%  5.4%  2.8%  (0.7%)  (2.8%)  (4.5%)  (6.3%)  (8.9%)  N/A Joe's Crab Shack (4.5%)  (3.8%)  (4.0%)  (6.6%)  (2.9%)  (1.3%)  (6.8%)  (6.5%)  N/A Famous Dave's of America Inc. (4.0%)  (4.9%)  (9.2%)  (9.8%)  (10.6%)  (7.7%)  (6.4%)  (1.0%)  (5.0%)  Median 2.9%  3.0%  1.0%  (0.5%)  (1.8%)  (1.3%)  (1.8%)  (1.0%)  (2.3%)  Mean 2.5%  2.5%  1.0%  (0.4%)  (1.5%)  (1.1%)  (2.3%)  (1.8%)  (2.5%) 
  • 6. Capital Markets Industry Insights | Q1 2016Duff & Phelps Restaurant Monthly Update | May 2017 Quarterly Same-Store Sales Performance – Last 2 Years Page 6 2014 2015 2016 Q4 Q1 Q2 Q3 Q4 Q1 Q2 Q3 Q4 Specialty Casual Darden Restaurants, Inc. Bahama Breeze (0.6%)  3.2%  1.7%  1.8%  2.4%  9.9%  5.4%  3.9%  2.6%  The Capital Grille 5.0%  6.1%  4.4%  7.2%  1.5%  5.3%  1.5%  (1.2%)  1.2%  Eddie V's 4.9%  9.6%  5.2%  5.1%  1.1%  4.1%  0.9%  (1.7%)  2.7%  LongHorn Steakhouse 2.6%  5.4%  5.2%  4.4%  2.6%  5.2%  1.1%  0.6%  0.1%  Olive Garden 0.5%  2.2%  3.4%  2.7%  1.0%  6.8%  1.6%  2.0%  2.6%  Seasons 52 1.2%  5.2%  3.1%  3.9%  4.5%  5.7%  3.7%  0.7%  (0.3%)  Yard House 3.7%  5.4%  3.2%  3.4%  1.7%  3.9%  1.4%  0.0%  0.7%  Texas Roadhouse, Inc. 6.8%  8.7%  8.0%  7.0%  4.4%  4.3%  4.5%  3.4%  1.2%  Buffalo Wild Wings Inc. 5.5%  6.5%  3.3%  2.6%  1.0%  (2.0%)  (2.1%)  (1.7%)  (4.0%)  Dave & Buster's Entertainment, Inc. 10.5%  9.9%  11.0%  8.8%  6.0%  3.6%  1.0%  5.9%  3.2%  BJ's Restaurants, Inc. 1.2%  3.2%  0.5%  2.3%  0.7%  0.6%  (0.2%)  (3.4%)  (2.2%)  Chuy's Holdings, Inc. 3.8%  1.9%  3.2%  4.2%  3.2%  3.2%  1.0%  0.3%  (1.1%)  Median 3.8%  5.4%  3.4%  4.1%  2.1%  4.2%  1.3%  0.5%  1.0%  Mean 3.8%  5.6%  4.4%  4.5%  2.5%  4.2%  1.7%  0.7%  0.6%  Source: SEC filings, S&P Global Market Intelligence, Mergermarket, company press releases and various news sources (e.g., New York Times DealBook, The Deal, The Wall Street Journal, etc.) Same-store sales represents the change in year-over-year sales for restaurants that have been open for at least 18 months. Represents most actively traded public restaurant companies; Mass Casual set excludes Bob Evans due to transaction announcement
  • 7. Capital Markets Industry Insights | Q1 2016Duff & Phelps Restaurant Monthly Update | May 2017 Quarterly Same-Store Sales Performance – Last 2 Years Page 7 2014 2015 2016 Q4 Q1 Q2 Q3 Q4 Q1 Q2 Q3 Q4 Polished Casual The Cheesecake Factory Incorporated 1.4%  4.2%  2.8%  2.2%  1.1%  1.7%  0.3%  1.7%  1.1%  J. Alexander's Holdings, Inc. J. Alexander's/Redlands Grill N/A N/A N/A (0.2%)  1.4%  (3.0%)  (1.8%)  1.4%  1.8%  Stoney River Steakhouse and Grill N/A N/A N/A 4.7%  6.2%  0.7%  1.8%  1.8%  (1.7%)  Kona Grill Inc. 3.1%  2.2%  1.0%  1.6%  3.2%  3.6%  2.5%  0.7%  (4.1%)  Bravo Brio Restaurant Group, Inc. Bravo! Cucina Italiana (3.9%)  (1.7%)  (2.1%)  (3.1%)  (5.2%)  (4.1%)  (8.4%)  (8.0%)  (7.5%)  Brio Tuscan Grille (4.2%)  (1.0%)  (1.6%)  (3.8%)  (4.3%)  (2.1%)  (6.4%)  (3.7%)  (4.3%)  Median (1.3%)  0.6%  (0.3%)  0.7%  1.3%  (0.7%)  (0.8%)  1.1%  (2.9%)  Mean (0.9%)  0.9%  0.0%  0.2%  0.4%  (0.5%)  (2.0%)  (1.0%)  (2.5%)  Fine Dining Ruth's Hospitality Group Inc. 5.0%  2.8%  4.2%  3.3%  3.2%  3.1%  1.5%  2.1%  0.0%  Fogo de Chao, Inc. N/A N/A 4.2%  2.8%  3.5%  1.1%  (1.6%)  0.6%  (1.0%)  Del Frisco's Restaurant Group, Inc. Del Frisco's Double Eagle Steak House 4.8%  2.3%  1.0%  (1.4%)  (1.6%)  (0.1%)  (1.9%)  (3.7%)  0.1%  Del Frisco's Grille N/A (3.5%)  (6.3%)  (3.5%)  (4.5%)  (2.8%)  (2.0%)  (1.4%)  2.1%  Sullivan's Steakhouse 1.8%  4.8%  (3.0%)  1.2%  (1.8%)  (1.8%)  2.9%  (3.2%)  0.9%  The ONE Group Hospitality, Inc. 2.6%  (3.5%)  3.1%  0.3%  (0.8%)  2.8%  (5.2%)  (4.2%)  (6.0%)  Median 3.7%  2.3%  2.1%  0.8%  (1.2%)  0.5%  (1.8%)  (2.3%)  0.1%  Mean 3.6%  0.6%  0.5%  0.5%  (0.3%)  0.4%  (1.1%)  (1.6%)  (0.7%)  Source: SEC filings, S&P Global Market Intelligence, Mergermarket, company press releases and various news sources (e.g., New York Times DealBook, The Deal, The Wall Street Journal, etc.) Same-store sales represents the change in year-over-year sales for restaurants that have been open for at least 18 months. Represents most actively traded public restaurant companies; Mass Casual set excludes Bob Evans due to transaction announcement
  • 8. Capital Markets Industry Insights | Q1 2016Duff & Phelps Restaurant Monthly Update | May 2017 Quarterly Same-Store Sales Performance – Last 2 Years Page 8 2014 2015 2016 Q4 Q1 Q2 Q3 Q4 Q1 Q2 Q3 Q4 Fast Casual Chipotle Mexican Grill, Inc. 16.1%  10.4%  4.3%  2.6%  (14.6%)  (29.7%)  (23.6%)  (21.9%)  (4.8%)  Panera Bread Company 3.0%  0.7%  1.8%  2.8%  2.3%  4.7%  2.3%  1.7%  0.7%  Shake Shack Inc. 7.2%  11.7%  12.9%  17.1%  11.0%  9.9%  4.5%  2.9%  1.6%  El Pollo Loco Holdings, Inc. 7.6%  5.1%  1.3%  0.6%  1.8%  0.7%  2.4%  1.6%  (1.3%)  Zoe's Kitchen, Inc. 7.8%  7.7%  5.6%  4.5%  7.7%  8.1%  4.0%  2.4%  0.7%  The Habit Restaurants, Inc. 13.2%  12.6%  8.9%  2.9%  3.3%  2.0%  4.0%  0.2%  1.7%  Noodles & Company 1.3%  0.9%  0.1%  (0.9%)  (1.1%)  (0.1%)  (1.0%)  (0.7%)  (0.8%)  Potbelly Corporation 3.7%  5.4%  4.9%  3.7%  3.7%  3.7%  1.7%  0.6%  0.1%  Fiesta Restaurant Group, Inc. Pollo Tropical 7.7%  6.4%  4.3%  4.2%  0.4%  0.0%  (1.4%)  (1.0%)  (4.0%)  Taco Cabana 6.1%  3.8%  5.6%  4.8%  3.3%  1.7%  (3.8%)  (4.1%)  (3.5%)  Wingstop Inc. 12.5%  10.7%  9.0%  6.3%  5.9%  4.6%  3.1%  4.1%  1.0%  Median 7.6%  6.4%  4.9%  3.7%  3.3%  2.0%  2.3%  0.6%  0.1%  Mean 7.8%  6.9%  5.3%  4.4%  2.2%  0.5%  (0.7%)  (1.3%)  (0.8%)  Source: SEC filings, S&P Global Market Intelligence, Mergermarket, company press releases and various news sources (e.g., New York Times DealBook, The Deal, The Wall Street Journal, etc.) Same-store sales represents the change in year-over-year sales for restaurants that have been open for at least 18 months. Represents most actively traded public restaurant companies; Mass Casual set excludes Bob Evans due to transaction announcement
  • 9. Capital Markets Industry Insights | Q1 2016Duff & Phelps Restaurant Monthly Update | May 2017 Quarterly Same-Store Sales Performance – Last 2 Years Page 9 2014 2015 2016 Q4 Q1 Q2 Q3 Q4 Q1 Q2 Q3 Q4 Quick Service McDonald's Corp. (1.7%)  (2.6%)  (2.0%)  0.9%  5.7%  5.4%  3.1%  3.5%  2.7%  Yum! Brands, Inc. KFC 6.0%  7.0%  3.0%  0.0%  3.0%  1.0%  2.0%  4.0%  3.0%  Pizza Hut 0.0%  (1.0%)  1.0%  0.0%  2.0%  5.0%  0.0%  (1.0%)  (2.0%)  Taco Bell 7.0%  6.0%  6.0%  4.0%  4.0%  1.0%  (1.0%)  3.0%  3.0%  Restaurant Brands International Inc. Burger King 4.2%  6.9%  7.9%  5.2%  2.8%  4.4%  3.9%  1.7%  2.8%  Tim Hortons 4.1%  8.9%  7.0%  4.3%  5.8%  5.8%  4.8%  2.0%  0.2%  Domino's Pizza, Inc. 11.1%  14.5%  12.8%  10.5%  10.7%  6.4%  9.7%  13.0%  12.2%  The Wendy's Company 1.7%  3.2%  2.2%  3.1%  4.8%  3.6%  0.3%  1.4%  0.8%  Jack in the Box Inc. 4.4%  8.9%  7.3%  6.2%  1.4%  0.0%  1.1%  2.0%  3.1%  Papa John's International Inc. 4.1%  6.5%  5.5%  3.0%  1.9%  0.1%  4.8%  5.5%  3.8%  Sonic Corp. 8.5%  11.5%  6.1%  4.9%  5.3%  6.5%  2.0%  (2.0%)  (2.0%)  Popeyes Louisiana Kitchen, Inc. 10.7%  7.0%  7.9%  5.6%  2.0%  1.1%  0.7%  1.8%  2.4%  Bojangles', Inc. 7.0%  7.9%  4.4%  4.1%  0.6%  2.0%  0.2%  0.8%  5.5%  Del Taco Restaurants, Inc. N/A 7.7%  6.0%  5.6%  5.8%  3.2%  3.3%  6.7%  (1.3%)  Nathan's Famous Inc. (2.0%)  (2.8%)  (0.7%)  0.5%  (1.3%)  0.2%  (2.2%)  (6.3%)  N/A Papa Murphy's Holdings, Inc. 8.4%  5.6%  4.5%  1.4%  (3.1%)  (2.8%)  (4.0%)  (5.8%)  (7.8%)  Median 4.4%  7.0%  5.8%  4.1%  2.9%  2.6%  1.6%  1.9%  2.7%  Mean 4.9%  6.0%  4.9%  3.7%  3.2%  2.7%  1.8%  1.9%  1.8%  Source: SEC filings, S&P Global Market Intelligence, Mergermarket, company press releases and various news sources (e.g., New York Times DealBook, The Deal, The Wall Street Journal, etc.) Same-store sales represents the change in year-over-year sales for restaurants that have been open for at least 18 months. Represents most actively traded public restaurant companies; Mass Casual set excludes Bob Evans due to transaction announcement
  • 10. Capital Markets Industry Insights | Q1 2016Duff & Phelps Restaurant Monthly Update | May 2017 Quarterly Same-Store Sales Performance – Last 2 Years Page 10 Source: SEC filings, S&P Global Market Intelligence, Mergermarket, company press releases and various news sources (e.g., New York Times DealBook, The Deal, The Wall Street Journal, etc.) Same-store sales represents the change in year-over-year sales for restaurants that have been open for at least 18 months. Represents most actively traded public restaurant companies; Mass Casual set excludes Bob Evans due to transaction announcement 2014 2015 2016 Q4 Q1 Q2 Q3 Q4 Q1 Q2 Q3 Q4 Coffee, Breakfast and Snacks Starbucks Corporation 5.0%  7.0%  8.0%  9.0%  9.0%  7.0%  4.0%  5.0%  3.0%  Dunkin' Brands Group, Inc. Dunkin' Donuts 1.4%  2.7%  2.9%  1.1%  1.8%  2.0%  0.5%  2.0%  1.9%  Baskin-Robbins 9.3%  8.0%  3.4%  7.5%  4.4%  5.0%  0.6%  (0.9%)  (0.9%)  Jamba, Inc. 4.9%  5.0%  (5.9%)  6.6%  5.4%  (2.1%)  4.2%  (1.1%)  (2.2%)  Median 5.0%  6.0%  3.2%  7.1%  4.9%  3.5%  2.3%  0.6%  0.5%  Mean 5.2%  5.7%  2.1%  6.1%  5.2%  3.0%  2.3%  1.3%  0.5%  Franchisees Diversified Restaurant Holdings, Inc. 5.8%  7.6%  4.2%  1.5%  0.8%  (1.0%)  (2.7%)  (1.8%)  (5.4%)  Carrols Restaurant Group, Inc. 3.6%  8.4%  10.3%  6.5%  5.1%  5.7%  0.7%  0.0%  3.2%  Median 4.7%  8.0%  7.3%  4.0%  3.0%  2.4%  (1.0%)  (0.9%)  (1.1%)  Mean 4.7%  8.0%  7.3%  4.0%  3.0%  2.4%  (1.0%)  (0.9%)  (1.1%) 
  • 11. Capital Markets Industry Insights | Q1 2016Duff & Phelps Restaurant Monthly Update | May 2017 Indexed Stock Price Performance – Last 12 Months Page 11 Sector index weight based upon company market capitalization at valuation date (1) Calculation of Market Sector LTM EV/EBITDA multiples excludes companies lacking analyst estimates for 2017E EBITDA figures Source: S&P Global Market Intelligence; data as of 4/30/2017. Fast Casual index includes Chipotle Mexican Grill, Shake Shack Inc., Wingstop Inc., Fiesta Restaurant Group, El Pollo Loco Holdings, Zoe’s Kitchen, The Habit Restaurants, Potbelly Corporation, Noodles & Company. Quick Service index includes McDonald’s Corp, Yum! Brands, Restaurant Brands International Inc., Domino’s Pizza, The Wendy’s Company, Jack in the Box Inc., Papa John’s International Inc., Sonic Corp., Bojangles, Del Taco Restaurants, Nathan’s Famous Inc., Papa Murphy’s Holdings. Coffee, Breakfast and Snacks index includes Starbucks Corporation, Dunkin’ Brands Group, Jamba. Franchisees index includes Carrols Restaurant Group, Inc., Diversified Restaurant Holdings, Inc. Mass Casual index includes Brinker International, Cracker Barrel Old Country Store, Bloomin’ Brands, DineEquity, Biglari Holdings, Denny’s Corporation, Red Robin Gourmet Burgers, Ruby Tuesday, Luby’s, Ignite Restaurant Group, Famous Dave’s of America. Specialty Casual index includes Darden Restaurants, Texas Roadhouse, Buffalo Wild Wings, Dave & Buster’s Entertainment, BJ’s Restaurants, Chuy’s Holdings. Polished Casual index includes The Cheesecake Factory, J. Alexander’s Holdings, Kona Grill, Bravo Brio Restaurant Group. Fine Dining index includes Ruth’s Hospitality Group, Fogo de Chao, Del Frisco’s Restaurant Group, The ONE Group Hospitality. Represents most actively traded public restaurant companies -40.0% -30.0% -20.0% -10.0% 0.0% 10.0% 20.0% 30.0% 40.0% 50.0% 4/30/2016 5/31/2016 6/30/2016 7/31/2016 8/31/2016 9/30/2016 10/31/2016 11/30/2016 12/31/2016 1/31/2017 2/28/2017 3/31/2017 4/30/2017 Mass Casual Specialty Casual Polished Casual Fine Dining Fast Casual Quick Service Coffee, Breakfast & Snacks Franchisees
  • 12. Capital Markets Industry Insights | Q1 2016Duff & Phelps Restaurant Monthly Update | May 2017 Sector Stock Price Performance Sector index weight based upon company market capitalization at valuation date (1) Calculation of Market Sector LTM EV/EBITDA multiples excludes companies lacking analyst estimates for 2017E EBITDA figures Source: S&P Global Market Intelligence; data as of 4/30/2017. Fast Casual index includes Chipotle Mexican Grill, Shake Shack Inc., Wingstop Inc., Fiesta Restaurant Group, El Pollo Loco Holdings, Zoe’s Kitchen, The Habit Restaurants, Potbelly Corporation, Noodles & Company. Quick Service index includes McDonald’s Corp, Yum! Brands, Restaurant Brands International Inc., Domino’s Pizza, The Wendy’s Company, Jack in the Box Inc., Papa John’s International Inc., Sonic Corp., Bojangles, Del Taco Restaurants, Nathan’s Famous Inc., Papa Murphy’s Holdings. Coffee, Breakfast and Snacks index includes Starbucks Corporation, Dunkin’ Brands Group, Jamba. Franchisees index includes Carrols Restaurant Group, Inc., Diversified Restaurant Holdings, Inc. Mass Casual index includes Brinker International, Cracker Barrel Old Country Store, Bloomin’ Brands, DineEquity, Biglari Holdings, Denny’s Corporation, Red Robin Gourmet Burgers, Ruby Tuesday, Luby’s, Ignite Restaurant Group, Famous Dave’s of America. Specialty Casual index includes Darden Restaurants, Texas Roadhouse, Buffalo Wild Wings, Dave & Buster’s Entertainment, BJ’s Restaurants, Chuy’s Holdings. Polished Casual index includes The Cheesecake Factory, J. Alexander’s Holdings, Kona Grill, Bravo Brio Restaurant Group. Fine Dining index includes Ruth’s Hospitality Group, Fogo de Chao, Del Frisco’s Restaurant Group, The ONE Group Hospitality. Represents most actively traded public restaurant companiesPage 12 ($ in millions, except per share data) Avg. Equity Avg. % Change Avg. EV / Number of Market Value in Market Value EBITDA Multiple Companies 28-Apr-17 1 Month 3 Months 12 Months LTM (1) 2017E Market Sector Mass Casual 10 $1,206 2.6% 4.4% 1.2% 10.1x 10.0x Specialty Casual 6 3,448 4.4% 15.2% 33.4% 11.2x 10.4x Polished Casual 4 812 1.6% 6.7% 19.9% 8.9x 7.3x Fine Dining 4 386 1.1% 15.4% 16.0% 10.2x 9.3x Fast Casual 9 1,975 5.8% 10.3% 9.1% 18.6x 12.1x Quick Service 12 14,333 6.0% 11.0% 13.2% 13.9x 13.2x Coffee, Breakfast and Snacks 3 30,935 3.0% 8.7% 8.0% 17.3x 12.7x Franchisees 2 286 2.8% 9.4% 14.7% 8.5x 7.9x Market Indices S&P 500 Index $2,384 0.9% 4.6% 15.4% Dow Jones Industrials 20,941 1.3% 5.4% 17.8% Russell 2000 Index 1,400 1.0% 2.8% 23.8% S&P Restaurant Index 1,313 5.3% 10.9% 11.8%
  • 13. Capital Markets Industry Insights | Q1 2016Duff & Phelps Restaurant Monthly Update | May 2017 Public Restaurant Valuations Source: S&P Global Market Intelligence as of April 28, 2017 Represents most actively traded public restaurant companies; Mass Casual set excludes Bob Evans due to transaction announcementPage 13 ($ in millions, except per share data) Stock Enterprise Value as a Multiple of LTM Price % of Market Enterprise Revenue EBITDA EBITDA % Franchised 28-Apr-17 52 Wk High Value Value LTM 2017E 2018E LTM 2017E 2018E Margin Mass Casual Cracker Barrel Old Country Store, Inc. 0% $160.19 91.5% $3,851 $4,072 1.39x 1.35x 1.30x 10.6x 10.1x 9.7x 13.2% Brinker International, Inc. 40% 44.19 79.1% 2,160 3,480 1.08x 1.10x 1.08x 7.6x 8.0x 8.0x 14.2% Bloomin' Brands, Inc. 20% 21.69 100.0% 2,235 3,156 0.75x 0.74x 0.73x 7.6x 7.3x 7.3x 9.8% DineEquity, Inc. 99% 56.54 63.9% 1,017 2,295 3.66x 3.66x 3.63x 9.8x 9.6x 9.5x 37.4% Denny's Corporation 90% 12.70 89.1% 895 1,153 2.27x 2.19x 2.12x 12.0x 11.2x 10.7x 19.0% Biglari Holdings Inc. 37% 426.63 86.8% 882 1,064 1.25x 1.24x 1.21x 19.5x 18.6x 17.2x 6.4% Red Robin Gourmet Burgers, Inc. 16% 58.75 87.6% 756 1,045 0.81x 0.76x 0.75x 7.6x 7.1x 6.8x 10.6% Ruby Tuesday, Inc. 12% 2.55 56.0% 152 333 0.34x NA NA 8.5x NA NA 4.0% Luby's, Inc. 37% 2.94 57.6% 86 121 0.31x NA NA 9.3x NA NA 3.3% Famous Dave's of America, Inc. 80% 4.00 59.4% 28 35 0.35x 0.38x 0.36x 8.4x 7.7x 11.9x 4.2% Median 82.9% $889 $1,109 0.94x 1.17x 1.14x 8.9x 8.8x 9.6x 10.2% Mean 77.1% $1,206 $1,676 1.22x 1.43x 1.40x 10.1x 10.0x 10.1x 12.2%
  • 14. Capital Markets Industry Insights | Q1 2016Duff & Phelps Restaurant Monthly Update | May 2017 Public Restaurant Valuations Source: S&P Global Market Intelligence as of April 28, 2017 Represents most actively traded public restaurant companiesPage 14 ($ in millions, except per share data) Stock Enterprise Value as a Multiple of LTM Price % of Market Enterprise Revenue EBITDA EBITDA % Franchised 28-Apr-17 52 Wk High Value Value LTM 2017E 2018E LTM 2017E 2018E Margin Specialty Casual Darden Restaurants, Inc. 3% $85.19 98.6% $10,592 $10,642 1.51x 1.47x 1.42x 11.3x 10.6x 10.0x 13.4% Texas Roadhouse, Inc. 16% 46.88 92.8% 3,324 3,251 1.59x 1.49x 1.36x 12.4x 11.4x 10.2x 12.8% Dave & Buster's Entertainment, Inc. 0% 64.01 99.2% 2,741 2,985 2.97x 2.55x 2.29x 12.5x 10.8x 9.8x 23.8% Buffalo Wild Wings, Inc. 49% 157.55 90.0% 2,543 2,887 1.43x 1.36x 1.37x 10.1x 9.7x 9.1x 14.2% BJ's Restaurants, Inc. 0% 45.10 94.8% 986 1,145 1.14x 1.09x 1.03x 9.1x 9.1x 8.5x 12.5% Chuy's Holdings, Inc. 0% 29.80 78.9% 503 489 1.48x 1.28x 1.12x 12.0x 10.7x 9.5x 12.4% Median 93.8% $2,642 $2,936 1.50x 1.41x 1.36x 11.6x 10.7x 9.6x 13.1% Mean 92.4% $3,448 $3,567 1.69x 1.54x 1.43x 11.2x 10.4x 9.5x 14.8% Polished Casual The Cheesecake Factory Incorporated 7% $64.16 98.2% $2,955 $2,997 1.32x 1.27x 1.21x 10.4x 10.4x 9.8x 12.7% J. Alexander's Holdings, Inc. 0% 11.00 90.9% 162 179 0.81x 0.77x 0.73x 9.0x 7.3x 7.1x 9.0% Bravo Brio Restaurant Group, Inc. 1% 4.85 55.9% 73 114 0.28x 0.28x 0.29x NM 4.0x 4.1x (9.7%) Kona Grill, Inc. 0% 5.70 39.5% 57 88 0.52x 0.44x 0.41x 7.3x 7.7x 5.4x 7.1% Median 73.4% $118 $146 0.67x 0.60x 0.57x 9.0x 7.5x 6.2x 8.0% Mean 71.1% $812 $844 0.73x 0.69x 0.66x 8.9x 7.3x 6.6x 4.8%
  • 15. Capital Markets Industry Insights | Q1 2016Duff & Phelps Restaurant Monthly Update | May 2017 Public Restaurant Valuations Page 15 Source: S&P Global Market Intelligence as of April 28, 2017 Represents most actively traded public restaurant companies; Fast Casual set excludes Panera Bread Company due to transaction announcement ($ in millions, except per share data) Stock Enterprise Value as a Multiple of LTM Price % of Market Enterprise Revenue EBITDA EBITDA % Franchised 28-Apr-17 52 Wk High Value Value LTM 2017E 2018E LTM 2017E 2018E Margin Fine Dining Ruth's Hospitality Group, Inc. 53% $19.90 96.8% $636 $647 1.68x 1.55x 1.49x 10.6x 10.0x 9.5x 15.8% Fogo de Chao, Inc. 0% 16.95 98.6% 479 595 2.06x 1.87x 1.71x 11.0x 9.7x 8.8x 18.8% Del Frisco's Restaurant Group, Inc. 0% 17.20 91.5% 375 389 1.10x 1.06x 0.99x 9.0x 8.2x 7.5x 12.2% The ONE Group Hospitality, Inc. 0% 2.22 64.7% 56 71 0.98x 0.94x NA NM 9.4x NM NM Median 94.2% $427 $492 1.39x 1.31x 1.49x 10.6x 9.6x 8.8x 15.8% Mean 87.9% $386 $425 1.45x 1.36x 1.40x 10.2x 9.3x 8.6x 15.6% Fast Casual Chipotle Mexican Grill, Inc. 0% $474.47 95.4% $13,600 $13,023 3.15x 2.81x 2.49x 39.4x 23.7x 17.8x 8.0% Panera Bread Company 55% 312.68 98.9% 7,105 7,439 2.62x 2.51x 2.32x 17.6x 16.8x 15.1x 14.9% Wingstop Inc. 98% 29.43 88.1% 849 991 10.85x 9.90x 8.90x 30.8x 24.9x 21.3x 35.3% Shake Shack Inc. 44% 33.94 79.0% 864 849 3.16x 2.39x 1.89x 20.1x 15.1x 12.1x 15.8% Fiesta Restaurant Group, Inc. 11% 24.35 71.9% 656 724 1.02x 1.00x 0.94x 8.3x 7.9x 7.3x 12.2% El Pollo Loco Holdings, Inc. 56% 12.55 85.9% 483 578 1.52x 1.42x 1.31x 9.4x 8.8x 8.1x 16.1% Zoe's Kitchen, Inc. 1% 18.05 43.2% 352 376 1.36x 1.16x 0.97x 16.5x 0.9x 12.1x 8.3% The Habit Restaurants, Inc. 7% 18.90 94.5% 382 368 1.30x 1.08x 0.91x 12.6x 10.8x 9.3x 10.3% Potbelly Corporation 11% 13.95 95.7% 350 323 0.79x 0.71x 0.66x 7.8x 7.4x 6.7x 10.1% Noodles & Company 15% 5.85 50.4% 240 301 0.62x 0.65x 0.63x 22.1x 9.6x 8.7x 2.8% Median 87.0% $569 $651 1.44x 1.29x 1.14x 17.0x 10.2x 10.7x 11.3% Mean 80.3% $2,488 $2,497 2.64x 2.36x 2.10x 18.5x 12.6x 11.9x 13.4%
  • 16. Capital Markets Industry Insights | Q1 2016Duff & Phelps Restaurant Monthly Update | May 2017 Public Restaurant Valuations Page 16 Source: S&P Global Market Intelligence as of April 28, 2017 Represents most actively traded public restaurant companies ($ in millions, except per share data) Stock Enterprise Value as a Multiple of LTM Price % of Market Enterprise Revenue EBITDA EBITDA % Franchised 28-Apr-17 52 Wk High Value Value LTM 2017E 2018E LTM 2017E 2018E Margin Quick Service McDonald's Corporation 85% $139.93 98.0% $114,288 $139,083 5.70x 6.22x 7.04x 14.6x 14.1x 14.0x 39.0% Yum! Brands, Inc. 94% 65.75 71.5% 23,162 31,744 4.99x 5.68x 6.97x 16.2x 15.6x 15.1x 30.9% Restaurant Brands International Inc. 100% 56.17 95.8% 13,235 27,357 6.47x 6.05x 5.64x 14.7x 13.2x 12.1x 44.0% Domino's Pizza, Inc. 97% 181.39 94.5% 8,723 10,851 4.24x 3.94x 3.58x 21.7x 19.3x 17.2x 19.5% The Wendy's Company 95% 14.74 98.7% 3,632 5,991 4.17x 5.03x 4.87x 15.8x 14.9x 13.8x 26.5% Jack in the Box Inc. 75% 101.97 90.0% 3,227 4,411 2.73x 2.77x 3.01x 12.7x 11.8x 11.3x 21.5% Papa John's International, Inc. 85% 79.06 87.4% 2,912 3,206 1.87x 1.80x 1.73x 16.4x 15.5x 14.5x 11.4% Sonic Corp. 93% 26.88 75.9% 1,141 1,720 3.09x 3.71x 3.73x 10.5x 11.5x 11.0x 29.4% Bojangles', Inc. 57% 21.95 99.8% 803 971 1.83x 1.71x 1.61x 11.6x 11.9x 11.0x 15.7% Del Taco Restaurants, Inc. 45% 13.15 85.8% 507 672 1.49x 1.42x 1.32x 10.2x 9.3x 8.6x 14.5% Nathan's Famous, Inc. 98% 68.20 98.8% 285 360 3.73x NA NA 13.1x NA NA 28.4% Papa Murphy's Holdings, Inc. 89% 4.88 37.7% 83 191 1.51x 1.46x 1.54x 8.7x 8.2x 7.5x 17.3% Median 92.2% $3,069 $3,809 3.41x 3.71x 3.58x 13.9x 13.2x 12.1x 24.0% Mean 86.2% $14,333 $18,880 3.48x 3.62x 3.73x 13.9x 13.2x 12.4x 24.8%
  • 17. Capital Markets Industry Insights | Q1 2016Duff & Phelps Restaurant Monthly Update | May 2017 Public Restaurant Valuations Page 17 Source: S&P Global Market Intelligence as of April 28, 2017 Represents most actively traded public restaurant companies ($ in millions, except per share data) Stock Enterprise Value as a Multiple of LTM Price % of Market Enterprise Revenue EBITDA EBITDA % Franchised 28-Apr-17 52 Wk High Value Value LTM 2017E 2018E LTM 2017E 2018E Margin Coffee, Breakfast and Snacks Starbucks Corporation 50% $60.06 97.0% $87,531 $89,110 4.05x 3.83x 3.46x 17.8x 15.5x 13.6x 22.8% Dunkin' Brands Group, Inc. 100% 55.86 95.6% 5,143 7,250 8.75x 8.57x 8.15x 16.7x 15.3x 14.3x 52.3% Jamba, Inc. 85% 8.52 63.9% 131 116 1.42x 1.54x 1.51x NM 7.3x 11.8x NM Median 95.6% $5,143 $7,250 4.05x 3.83x 3.46x 17.3x 15.3x 13.6x 37.5% Mean 85.5% $30,935 $32,159 4.74x 4.65x 4.37x 17.3x 12.7x 13.2x 37.5% Franchisees Carrols Restaurant Group, Inc. 0% $14.00 79.8% $499 $738 0.78x 0.71x 0.69x 8.5x 7.9x 7.4x 9.1% Diversified Restaurant Holdings, Inc. 0% 2.74 98.2% 73 187 1.12x 1.07x NA 8.4x 7.8x NM 13.4% Median 89.0% $286 $463 0.95x 0.89x 0.69x 8.5x 7.9x 7.4x 11.3% Mean 89.0% $286 $463 0.95x 0.89x 0.69x 8.5x 7.9x 7.4x 11.3%
  • 18. Capital Markets Industry Insights | Q1 2016Duff & Phelps Restaurant Monthly Update | May 2017 Mean: 11.8x Mean: 9.9x Mean: 11.2x Mean: 10.0x Historical Public Restaurant Trends Enterprise Value as a Multiple of EBITDA(1) Page 18 (1) Index calculation excludes any companies with non-meaningful trading multiples Source: S&P Global Market Intelligence; LTM values as of 4/28/2017 Segments weighted based on market cap values at period end Represents most actively traded public restaurant companies 10.8x 13.8x 10.0x 13.2x 11.4x 13.2x 11.2x 12.8x 8.8x 10.5x 8.6x 10.2x9.6x 10.4x 9.7x 9.4x 9.2x 11.3x 10.0x 10.4x 5.0x 7.0x 9.0x 11.0x 13.0x 15.0x 17.0x 19.0x Mass Casual Specialty Casual Polished Casual Fine Dining 2013 2014 2015 2016 LTM
  • 19. Capital Markets Industry Insights | Q1 2016Duff & Phelps Restaurant Monthly Update | May 2017 Historical Public Restaurant Trends Page 19 Mean: 13.4x Mean: 18.0x Mean: 10.2x Mean: 13.9x Enterprise Value as a Multiple of EBITDA(1) (1) Index calculation excludes any companies with non-meaningful trading multiples Source: S&P Global Market Intelligence; LTM values as of 4/28/2017 Segments weighted based on market cap values at period end Represents most actively traded public restaurant companies; LTM Fast Casual set excludes Panera Bread Company due to transaction announcement 15.1x 11.3x 18.9x 11.8x 14.3x 12.3x 16.7x 11.8x 13.5x 14.4x 19.8x 11.4x 12.9x 13.8x 16.8x 7.8x 13.8x 15.0x 17.6x 8.4x 5.0x 8.0x 11.0x 14.0x 17.0x 20.0x 23.0x Fast Casual Quick Service Coffee, Breakfast and Snacks Franchisees 2013 2014 2015 2016 LTM
  • 20. Capital Markets Industry Insights | Q1 2016Duff & Phelps Restaurant Monthly Update | May 2017 Recent Restaurant M&A Transaction Activity Balmoral Funds Acquires MOOYAH Holdings On April 28, 2017, Balmoral Funds acquired MOOYAH Holdings, a Plano, Texas-based franchisor of fast casual burgers, for an undisclosed sum. MOOYAH specializes in customizable burgers, milkshakes and fries with 73 locations in the U.S. and 20 international stores. Balmoral Funds will look to utilize its resources and experience in the restaurant franchisee space to continue geographic expansion and building the brand name. General Atlantic Invests in Torchy’s Tacos On April 18, 2017, General Atlantic made an undisclosed minority investment in Torchy’s Tacos, the Austin, Texas-based fast-casual chain. The company, which was founded with a single food trailer in South Austin in 2006, has grown to 46 company-owned locations in three states over the past decade. The transaction marks the third restaurant investment made by General Atlantic over the past 18 months, with previous deals made with Barteca Holdings and Joe and the Juice. Torchy’s Tacos will utilize the deal to fund new-unit expansion in west Houston, Tulsa, Oklahoma, and other geographic markets. JAB Holdings Acquires Panera Bread Company for $7.6B On April 5, 2017, Netherlands-based JAB Holdings has acquired Panera Bread Company, the St. Louis, Missouri-based operator and franchisor of over 2,000 fast casual bakery-cafes, for $315 per share in cash, equating to a total transaction value of $7.6B. Panera has gained significant momentum in recent months, with same-store sales increasing 11.5% on a two-year basis due to the implementation of kiosks, table service and a smartphone app to speed service. Backed by Germany’s billionaire Reimann family, JAB Holdings has spent roughly $40B on deals in the U.S. over the past decade with the previous acquisitions of Keurig Green Mountain, Peet’s Coffee and Krispy Kreme. The transaction multiple was 17.7x Panera’s LTM EBITDA. Kitchen Fund Invests in The Hummus & Pita Co. On April 3, 2017, growth equity firm Kitchen Fund made an investment in The Hummus & Pita Co., the New York-based fast casual Mediterranean concept. Kitchen Fund was founded in 2016 by Dan Rowe and Greg Golkin, two financiers who have made investments in a handful of concepts, including Inday, The Pie Hole and Mr. Holmes Bakehouse, to make early-stage investments in unique restaurant concepts. The Hummus & Pita Co. will look to utilize the investment to begin franchising locations and expand its geographic footprint outside of the New York area. Source: Mergermarket Group IntelligencePage 20 Four Foods Group Acquires Little Caesars Restaurant Group On March 29, 2017, Utah-based Four Foods Group acquired 48 Little Caesars restaurants in Alabama and Louisiana for an undisclosed sum. Founded in 2008, Four Foods Group currently operates 44 Kneaders Bakery & Café restaurants, two R&R Barbecue locations and Gilbert, Arizona-based The Soda Shop. The transaction announcement came the day after Four Foods secured a $33M financing from CIT Group, private investors and current shareholders. Cava Group Receives $30M Investment from Existing Investors On March 28, 2017, Washington, D.C.-based, Mediterranean-focused Cava Group received a $30M investment from existing equity holders Invus, Revolution Growth and Swan & Legend in a series C funding round. Cava has 27 locations across Washington, D.C., Los Angeles, Orange County and New York City and sells its packaged dips and spreads in more than 200 Whole Foods Market stores. The three investors were part of a $45M Series B investment in the company in September 2015 and look to continue ongoing innovation and footprint expansion in the future. Darden Restaurants to Acquire Cheddar’s Casual Café for $780M On March 27, 2017, Darden Restaurants agreed to acquire Cheddar’s Casual Café, the Dallas-based operator and franchisor of casual dining concept Cheddar’s Scratch Kitchen, for $780M in cash. The acquisition comes after Cheddar’s acquired 44-unit Greer Companies, its largest franchisee, in January 2017 and gives Darden Restaurants its eighth brand. Cheddar’s 165 locations will add to Darden’s portfolio, which currently includes LongHorn Steakhouse, The Capital Grille, Yard House and others. The LTM transaction multiple was approximately 10.4x EBITDA. Noodles & Co. Sells $31.5M of Shares to Mill Road Capital On March 14, 2017, Mill Road Capital acquired $31.5M of newly issued common stock in Noodles & Co, the Broomsfield, Colorado-based fast casual noodles and pasta concept. The transaction marks the second stock sale this year for Noodles & Co., which sold $18.5M in preferred stock to L Catterton in February concurrently with its announcement to close 55 underperforming restaurants. The company, which has nearly 500 locations nationwide, has faced a precipitous decline in same-store sales and traffic over the past year, leading to a $71.7M loss on $487.5M in 2016 revenue.
  • 21. Capital Markets Industry Insights | Q1 2016Duff & Phelps Restaurant Monthly Update | May 2017 Selected Recent Duff & Phelps Restaurant Transactions Page 21 has been acquired by Sell-Side Advisor a portfolio company of has completed a leveraged dividend recapitalization transaction. Board Advisor a portfolio company of has been acquired by a portfolio company of has been acquired by a division of has been acquired by Sell-Side Advisor Sell-Side Advisor Sell-Side Advisor has completed a spin-off of Board Advisor has been acquired by Sell-Side Advisor has been acquired by Board Advisor has secured senior debt financing from Placement Agent a portfolio company of has been acquired by Sell-Side Advisor has been acquired bya portfolio company of has been acquired by
  • 22. Duff & Phelps Restaurant Monthly Update | April 2017 Joshua Benn Global Head of Restaurants Retail, Consumer and Food New York +1 212 450 2840 joshua.benn@duffandphelps.com Contact Us For more information please visit: www.duffandphelps.com Duff & Phelps is the premier global valuation and corporate finance advisor with expertise in complex valuation, disputes and investigations, M&A, real estate, restructuring, and compliance and regulatory consulting. The firm’s more than 2,000 employees serve a diverse range of clients from offices around the world. M&A advisory, capital raising and secondary market advisory services in the United States are provided by Duff & Phelps Securities, LLC. Member FINRA/SIPC. Pagemill Partners is a Division of Duff & Phelps Securities, LLC. M&A advisory and capital raising services in Canada are provided by Duff & Phelps Securities Canada Ltd., a registered Exempt Market Dealer. M&A advisory and capital raising services in the United Kingdom and across Europe are provided by Duff & Phelps Securities Ltd. (DPSL), which is authorized and regulated by the Financial Conduct Authority. In Germany M&A advisory and capital raising services are also provided by Duff & Phelps GmbH, which is a Tied Agent of DPSL. Valuation Advisory Services in India are provided by Duff & Phelps India Private Limited under a category 1 merchant banker license issued by the Securities and Exchange Board of India. About Duff & Phelps Copyright © 2017 Duff & Phelps LLC. All rights reserved. Duff & Phelps Restaurant Monthly | May 2017 Darren Gange Managing Director New York +1 212 871 9429 darren.gange@duffandphelps.com Farzad Mukhi Director Los Angeles +1 424 249 1661 farzad.mukhi@duffandphelps.com Henry Wells Managing Director London +44 207 089 4876 henry.wells@duffandphelps.com