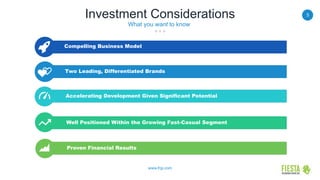
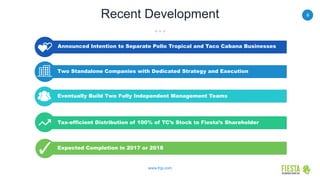
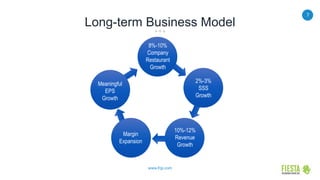
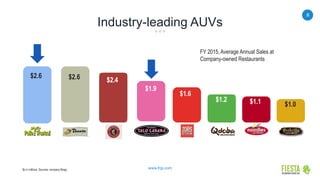
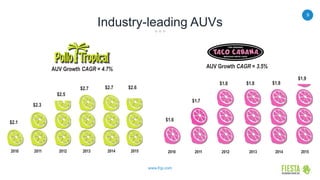
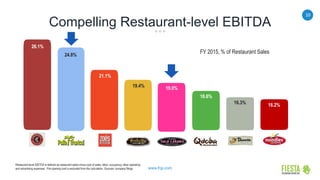
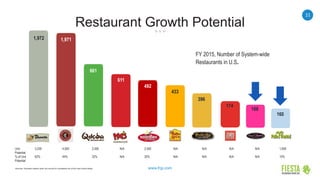
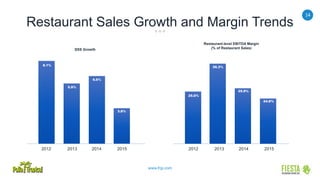
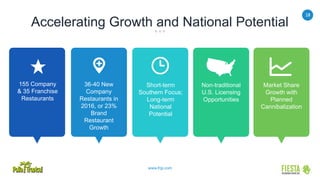
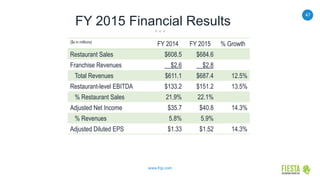
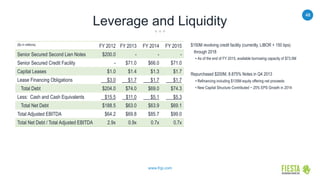
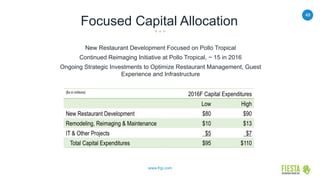
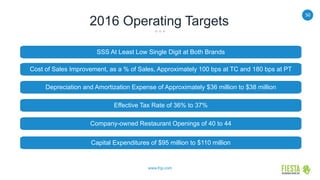
SlideShare a Scribd company logo
1 of 58
Download to read offline
1
www.frgi.com
Investor Presentation
March 2016
2
www.frgi.com
Tim Taft
President & Chief Executive Officer
Presenters
President & Chief Executive Officer
Lynn Schweinfurth
Chief Financial Officer
3
www.frgi.com
Forward-looking Statements
This document and our presentation contain “forward-looking statements” within the meaning of Section 27A of the Securities Act of 1933, as amended,
and Section 21E of the Securities Exchange Act of 1934, as amended and are intended to be covered by the “safe harbor” created by those sections. All
statements, other than statements of historical facts included herein, including, without limitation, statements regarding our future financial position and
results of operations, business strategy, budgets, projected costs and plans and objectives of management for future operations, are “forward-looking
statements.” Forward-looking statements generally can be identified by the use of forward-looking terminology such as “may,” “will,” “expect,” “anticipate,”
“intend,” “plan,” “believe,” “seek,” “estimate” or “continue” or the negative of such words or variations of such words and similar expressions. These
statements are not guarantees of future performance and involve certain risks, uncertainties and assumptions, which are difficult to predict. Therefore,
actual outcomes and results may differ materially from what is expressed or forecasted in such forward-looking statements and we can give no assurance
that such forward-looking statements will prove to be correct. Important factors that could cause actual results to differ materially from those expressed or
implied by the forward-looking statements, or “cautionary statements,” include, but are not limited to: increases in food and other commodity costs; risks
associated with the expansion of our business; our ability to manage our growth and successfully implement our business strategy; general economic
conditions, particularly in the retail sector; competitive conditions; weather conditions; fuel prices; significant disruptions in service or supply by any of our
suppliers or distributors; changes in consumer perception of dietary health and food safety; labor and employment benefit costs; regulatory factors; the
outcome of pending or future legal claims or proceedings; environmental conditions and regulations; our borrowing costs; the availability and terms of
necessary or desirable financing or refinancing and other related risks and uncertainties; the risk of an act of terrorism or escalation of any insurrection or
armed conflict involving the United States or any other national or international calamity; factors that affect the restaurant industry generally, including
product recalls, liability if our products cause injury, ingredient disclosure and labeling laws and regulations, reports of cases of food-borne illnesses such
as “mad cow” disease and “avian” flu, and the possibility that consumers could lose confidence in the safety and quality of certain food products, as well
as negative publicity regarding food quality, illness, injury or other health concerns.
4
www.frgi.com
Strategic & Operational Overview
5
www.frgi.com
Investment Considerations
Accelerating Development Given Significant Potential
Compelling Business Model
Well Positioned Within the Growing Fast-Casual Segment
Proven Financial Results
Two Leading, Differentiated Brands
What you want to know
6
www.frgi.com
Recent Development
Expected Completion in 2017 or 2018
Announced Intention to Separate Pollo Tropical and Taco Cabana Businesses
Tax-efficient Distribution of 100% of TC’s Stock to Fiesta’s Shareholder
Two Standalone Companies with Dedicated Strategy and Execution
Eventually Build Two Fully Independent Management Teams
7
www.frgi.com
Meaningful
EPS
Growth
Margin
Expansion
10%-12%
Revenue
Growth
2%-3%
SSS
Growth
Long-term Business Model
8%-10%
Company
Restaurant
Growth
8
www.frgi.com
Industry-leading AUVs
$s in millions. Sources: company filings.
$2.6 $2.6 $2.4
$1.1$1.2
$1.0
$1.6
$1.9
FY 2015, Average Annual Sales at
Company-owned Restaurants
9
www.frgi.com
Industry-leading AUVs
AUV Growth CAGR = 4.7% AUV Growth CAGR = 3.5%
$1.6
$1.7
$1.8 $1.8
2010 2011 2012 2013 2014
$1.8
$2.1
$2.3
$2.5
$2.7 $2.7
20142013201220112010
$2.6
2015
$1.9
2015
10
www.frgi.com
Compelling Restaurant-level EBITDA
Restaurant-level EBITDA is defined as restaurant sales minus cost of sales, labor, occupancy, other operating
and advertising expenses. Pre-opening cost is excluded from the calculation. Sources: company filings
24.8%
26.1%
16.3% 16.2%
19.4%
21.1%
16.6%
19.0%
FY 2015, % of Restaurant Sales
11
www.frgi.com
Restaurant Growth Potential
Unit 3,200 4,500 2,000 N/A 2,500 N/A N/A N/A N/A 1,600
Potential
% of Unit 62% 44% 32% N/A 20% N/A N/A N/A N/A 10%
Potential
169
168
160
1,972
661
611
492
433
396
1,971
174
FY 2015, Number of System-wide
Restaurants in U.S.
Sources: Domestic system wide unit counts for competitors as of the most recent filings.
12
www.frgi.com
13
www.frgi.com
A Unique and Extraordinary Brand
Freshly prepared Caribbean-inspired food you feel good about eating.
A 28 year old brand originating in South Florida
Truly differentiated restaurant concept with no direct competitor
Signature offerings: fresh, grilled bone-in chicken marinated with tropical fruit juices and spices, rice and beans
• Additional proteins, side dishes, salads and wraps further broaden target audience
• Rum punch and Caribbean beer
• Self service Saucing Island includes made from scratch salsas and sauces
Significant restaurant growth potential
Best-in-class restaurant economics
Attractive value proposition - great quality food with an average check of ~ $10
Convenience with dine-in, take out and drive-thru
Catering growth is a meaningful opportunity
14
www.frgi.com
Restaurant Sales Growth and Margin Trends
2012 2013 2014 2015
8.1%
5.9%
6.6%
3.8%
SSS Growth
Restaurant-level EBITDA Margin
(% of Restaurant Sales)
2012 2013 2014 2015
25.6%
26.3%
25.9%
24.8%
15
www.frgi.com
Freshly Prepared, Caribbean-inspired Menu
16
www.frgi.com
Our Differentiated Restaurant Growth Vehicle
New Prototype Introduced in Texas in March 2014
17
www.frgi.com
Our Differentiated Restaurant Growth Vehicle
18
www.frgi.com
Accelerating Growth and National Potential
155 Company
& 35 Franchise
Restaurants
36-40 New
Company
Restaurants in
2016, or 23%
Brand
Restaurant
Growth
Short-term
Southern Focus;
Long-term
National
Potential
Market Share
Growth with
Planned
Cannibalization
Non-traditional
U.S. Licensing
Opportunities
19
www.frgi.com
Accelerating Growth and National Potential
23/ 0
11 / 0
117 / 5
Current U.S. Footprint New Company-Owned Restaurants Opened
2010................................................................
2011................................................................
2012................................................................
2013..............................................................
2014……………………………...…………….
2015………………………………………….....
2016 ……………………………………….
2
2
5
12
22
32
36-40E
Where two numbers appear on the map, the first represents company-owned restaurants and the second
represents franchised and licensed restaurants.
20
www.frgi.com
Development Strategy
CORE SOUTH FLORIDA MARKETS
SUPERIOR BRAND AWARENESS
Miami-Dade, Broward, & Palm Beach Counties
Exceptional financial performance
OTHER FLORIDA MARKETS
DRIVING TRAFFIC GROWTH WITH MEDIA
Orlando, Naples/Fort Myers, Tampa,
Jacksonville & Nashville
Driving higher brand awareness through
new development and media strategies
At scale to drive meaningful sales growth
with media
EMERGING MARKETS
LOW BRAND AWARENESS,
NOT ON BROADCAST MEDIA
Dallas, Houston, San Antonio & Atlanta
Robust development pipeline in Texas;
build out Atlanta over time as trade
areas develop
Atlanta to begin broadcast media by 4Q
2016, San Antonio started media in mid-
February
21
www.frgi.com
Reimaging Program Initiated in 2015
Former Reimaged
22
www.frgi.com
23
www.frgi.com
Broad Menu Offerings with Mexican Authenticity
Fresh, contemporary food prepared with authentic flavors of Mexico
A 38 year old brand originating in San Antonio
24-hour format
Broad, authentic Mexican product offerings including sizzling fajitas, enchiladas, quesadillas, burritos
and salads
• Margaritas and beer
• Fresh tortillas made daily
• Self service salsa bar includes made from scratch salsas and sauces
Top five AUV in the fast casual segment, operating performance at peak
Expansion in Texas
Attractive value proposition - great quality food with an average check of ~ $9
Convenience with dine-in, take out and drive-thru
Catering growth is a meaningful opportunity
24
www.frgi.com
Restaurant Sales Growth and Margin Trends
4.7%
0.5%
3.3%
4.4%
2012 2013 2014 2015
SSS Growth
Restaurant-level EBITDA Margin
(% of Restaurant Sales)
2012 2013 2014 2015
16.9% 16.7%
17.9%
19.0%
Restaurant-level EBITDAMargin excludes pre-opening costs.
25
www.frgi.com
Fresh, Authentic Flavors of Mexico
26
www.frgi.com
Renewed Texas Expansion Leveraging Proven Brand Affinity
2012 Prototype New Prototype
All stores reimaged between 2012 and 2015
27
www.frgi.com
Renewed Texas Expansion Leveraging Proven Brand Affinity
28
www.frgi.com
2016 sales and traffic drivers
1% pricing
Incremental advertising expense at Pollo ~ 50 bps or $4 million+
• Increased media weights in mature markets
• At least 84% of restaurants will be supported by broadcast media
• Earlier investment in new markets
New “Real People” advertising campaign at Pollo
New product news with limited-time-promotions
Continuation of the Pollo remodel program
Introduction of new loyalty programs
Continuation of new focus on off-premise
Ongoing operations focus and execution
Guidance – at least low single digit comparable sales growth at both brands
1.5% to 2.5% of pricing
New product news with limited-time-promotions
Completed Taco Cabana remodel program
Introduction of new loyalty programs
Continuation of new focus on off premise
Ongoing operations focus and execution
29
www.frgi.com
30
www.frgi.com
The rest of the story.
(what you need to know)
31
www.frgi.com
Not the typical growth story
THE BIG 3
Miami-Dade, Palm Beach and Broward
• Represents 65 of the 91 restaurants in 2012
• Average Unit Volume of $2.8 in 2012
Atlanta
Jacksonville
Orlando
Tampa
Ft. Myers
26restaurants
5cities
$1.9Million AUV
Other five markets
32
www.frgi.com
From 2012 to 2015
THE BIG 3
65 to 77 units
$2.8 to $3.3 AUV
33
www.frgi.com
Growth of the other five cities
26 to 50 units
$1.9 to $2.0 AUV
Now Media Efficient
Atlanta
Jacksonville
Orlando
Tampa
Ft. Myers
• Media in Atlanta to begin 4Q 2016
34
www.frgi.com
In 2016, 84% Restaurants in Markets with Broadcast Media
35
www.frgi.com
Case Study – Naples / Ft Myers
Ft. Myers
36
www.frgi.com
Case Study – Naples / Ft Myers, Building Market Share
2012
3
2013
4
2014
6
2015
7
Company-owned Restaurants
2012
0.4
2013
0.7
2014
1.1
2015
1.3
Total Transactions
2012
$1.6
2013
$2.1
2014
$2.4
2015
$2.3
Annual Unit Volume
(in millions)
37
www.frgi.com
Growth in Texas
Opened Texas in 2014
Increased units in 2015 from 10 to 23
Dallas
Houston
Austin
San Antonio
Project 41 total units by the end of 2016
San Antonio media turned on Feb 2016
38
www.frgi.com
The rest of the story
• Management teams overhauled
• Recipes & portion sizes made consistent
• Achieving all-time best customer
feedback scores
• Positive transactions despite sizable
price increases
• Enhanced culinary team
• System reimage program completed
39
www.frgi.com
• The Big 3 represent 50% of
all restaurants
• Maintain highest AUVs in the industry
• Funded emerging Florida markets
• Reworked process, procedures,
I.T. infrastructure, HR, development
and supply chain all while plane is flying
The rest of the story
40
www.frgi.com
Still many levers to pull to drive SSS
53%
OFF PREMISE
CONSUMPTION
MARKETING
CATERING
INNOVATIONLOYALTY
41
www.frgi.com
By end of 2016
Doubling in size since 2012
42
www.frgi.com
And now you know
the rest of the story.
43
www.frgi.com
Financial Summary
44
www.frgi.com
Accelerating Growth Since 2012 Spin-off
Note: Restaurant-level EBITDA Margin excludes pre-opening costs.
Company-owned Restaurant Growth Adjusted Diluted EPS
CAGR = 36.3%
Revenue Growth
0.8%
6.4%
9.0% 8.9%
2012 2013 2014 2015
7.3%
8.2%
10.8%
12.5%
2012 2013 2014 2015
20.8%
21.2%
21.9%
22.1%
2012 2013 2014 2015
Restaurant-level EBITDA Margin
% of Restaurant Sales
130 bps Margin Expansion
$0.60
$0.83
$1.33
$1.52
2012 2013 2014 2015
45
www.frgi.com
Proven Business Model
Note: Restaurant-level EBITDA Margin excludes pre-opening costs.
0.0%
12.1%
21.6%
25.0%
2012 2013 2014 2015
Company-owned Restaurant Growth
11.3%
16.5% 16.5%
14.5%
2012 2013 2014 2015
Restaurant-level EBITDA Growth
8.5%
13.3%
20.5%
12.5%
2012 2013 2014 2015
Adjusted EBITDA Growth
9.5%
13.2%
18.4%
19.3%
2012 2013 2014 2015
Revenue Growth
46
www.frgi.com
Performance Trends Improved to Current Record Level
Note: Restaurant-level EBITDA Margin excludes pre-opening costs.
Company-owned Restaurant Growth Adjusted EBITDA Growth
1.3%
3.1%
1.2%
-3.0%
2012 2013 2014 2015
Restaurant-level EBITDA Growth
5.2%
3.1%
11.4%
12.2%
2012 2013 2014 2015
-4.2%
1.7%
26.5%
20.3%
2012 2013 2014 2015
Revenue Growth
5.6%
4.0% 4.1%
5.6%
2012 2013 2014 2015
47
www.frgi.com
FY 2015 Financial Results
($s in millions)
FY 2014 FY 2015 % Growth
Restaurant Sales $608.5 $684.6
Franchise Revenues $2.6 $2.8
Total Revenues $611.1 $687.4 12.5%
Restaurant-level EBITDA $133.2 $151.2 13.5%
% Restaurant Sales 21.9% 22.1%
Adjusted Net Income $35.7 $40.8 14.3%
% Revenues 5.8% 5.9%
Adjusted Diluted EPS $1.33 $1.52 14.3%
48
www.frgi.com
Leverage and Liquidity
$150M revolving credit facility (currently, LIBOR + 150 bps)
through 2018
• As of the end of FY 2015, available borrowing capacity of $73.5M
Repurchased $200M, 8.875% Notes in Q4 2013
• Refinancing including $135M equity offering net proceeds
• New Capital Structure Contributed ~ 25% EPS Growth in 2014
($s in millions)
FY 2012 FY 2013 FY 2014 FY 2015
Senior Secured Second Lien Notes $200.0 - - -
Senior Secured Credit Facility - $71.0 $66.0 $71.0
Capital Leases $1.0 $1.4 $1.3 $1.7
Lease Financing Obligations $3.0 $1.7 $1.7 $1.7
Total Debt $204.0 $74.0 $69.0 $74.3
Less: Cash and Cash Equivalents $15.5 $11.0 $5.1 $5.3
Total Net Debt $188.5 $63.0 $63.9 $69.1
Total Adjusted EBITDA $64.2 $69.8 $85.7 $99.0
Total Net Debt / Total Adjusted EBITDA 2.9x 0.9x 0.7x 0.7x
49
www.frgi.com
Focused Capital Allocation
New Restaurant Development Focused on Pollo Tropical
Continued Reimaging Initiative at Pollo Tropical, ~ 15 in 2016
Ongoing Strategic Investments to Optimize Restaurant Management, Guest
Experience and Infrastructure
50
www.frgi.com
2016 Operating Targets
Cost of Sales Improvement, as a % of Sales, Approximately 100 bps at TC and 180 bps at PT
Effective Tax Rate of 36% to 37%
Depreciation and Amortization Expense of Approximately $36 million to $38 million
SSS At Least Low Single Digit at Both Brands
Company-owned Restaurant Openings of 40 to 44
Capital Expenditures of $95 million to $110 million
51
www.frgi.com
Appendix
52
www.frgi.com
Commodity Cost Overview
The Company Contracts Commodities
With Some Suppliers
2016 Projected Consolidate Commodity
Decrease ~ Low Single Digits
2016 Commodities Under Fixed Pricing
By Year End ~ 70%-80% COGS
Top 5 Food Purchases – 2016F Top 5 Food Purchases – 2016F
53
www.frgi.com
Franchising
Franchise Locations
Bahamas....................
Honduras ....................
Guatemala..................
Panama.......................
Puerto Rico .................
Trinidad and Tobago …
Venezuela...................
United States…………..
1
3
1
5
17
2
11
1
• Current focus is U.S. non-traditional franchising (universities and airports)
- Currently, 5 Pollo and 2 Taco locations
• International franchise locations are Pollo Tropical restaurants
• We have one traditional Taco franchisee in Albuquerque, NM with 4 restaurants
• Franchise revenues are not meaningful today, <1% of total revenues
• Franchise expansion anticipated to be a growth platform in the future
54
www.frgi.com
Total Adjusted EBITDA Reconciliation
($s in millions) FY2012 FY2013 FY2014 FY2015
Restaurant-level Adjusted EBITDA Excluding Pre-Opening Costs:
Pollo Tropical 58.2$ 67.8$ 79.0$ 90.4$
Taco Cabana 47.2 48.7 54.2 60.8
Consolidated 105.4$ 116.5$ 133.2$ 151.2$
Less:
Pre-Opening Costs 1.7 2.8 4.1 4.6
Restaurant-level Adjusted EBITDA:
Pollo Tropical 57.1 65.7 75.6 86.1
Taco Cabana 46.6 48.0 53.5 60.6
Consolidated 103.7$ 113.7$ 129.1$ 146.6$
Add:
Franchise Royalty Revenues and Fees 2.4 2.4 2.6 2.8
Less:
General and Administrative (Excluding Stock-based Compensation) 41.8 46.2 46.0 50.4
Adjusted EBITDA
Pollo Tropical 38.6 43.7 52.7 59.3
Taco Cabana 25.6 26.1 33.0 39.7
Consolidated 64.2$ 69.8$ 85.7$ 99.0$
Less:
Depreciation and Amortization 18.3 20.4 23.0 30.6
Impairment and Other Lease Charges 7.0 0.2 0.4 2.4
Interest Expense 24.4 18.0 2.2 1.9
Loss on Extinguishment of Debt - 16.4 - -
Provision for Income Taxes 4.3 3.8 21.0 22.0
Stock-Based Compensation 2.0 2.3 3.5 4.3
Other Expense / (Gain) (0.1) (0.6) (0.6) (0.7)
Net Income 8.3$ 9.3$ 36.2$ 38.5$
55
www.frgi.com
Adjusted EBITDA Reconciliation
($s in millions) FY2012 FY2013 FY2014 FY2015
Restaurant Sales 227.4$ 257.8$ 305.4$ 364.5$
Less:
Cost of Sales 75.4 85.5 100.5 121.7
Restaurant Wages and Related Expenses 53.6 57.9 67.5 81.6
Restaurant Rent Expense 7.7 10.1 12.5 16.0
Other Restaurant Operating Expenses 26.8 30.8 38.3 45.4
Advertising Expense 5.7 5.7 7.7 9.5
Restaurant-Level Adjusted EBITDA Excluding
Pre-Opening Costs 58.2$ 67.8$ 79.0$ 90.4$
Less: Pre-Opening Costs 1.1 2.0 3.4 4.3
Restaurant-Level Adjusted EBITDA 57.1$ 65.7$ 75.6$ 86.1$
Add: Franchise Revenue 1.9 1.9 2.1 2.2
Less: General and Administrative Expenses 20.4 23.9 24.9 28.9
Adjusted EBITDA 38.6$ 43.7$ 52.7$ 59.3$
56
www.frgi.com
Adjusted EBITDA Reconciliation
Restaurant Sales 279.9$ 291.1$ 303.1$ 320.0$
Less:
Cost of Sales 88.1 90.6 91.8 95.6
Restaurant Wages and Related Expenses 82.6 85.5 87.6 92.5
Restaurant Rent Expense 13.9 16.7 17.2 17.1
Other Restaurant Operating Expenses 37.0 38.2 40.6 41.9
Advertising Expense 11.1 11.4 11.8 12.1
Restaurant-Level Adjusted EBITDA Excluding
Pre-Opening Costs 47.2$ 48.7$ 54.2$ 60.8$
Less: Pre-Opening Costs 0.6 0.7 0.7 0.3
Restaurant-Level Adjusted EBITDA 46.6$ 48.0$ 53.5$ 60.6$
Add: Franchise Revenue 0.5 0.5 0.5 0.6
Less: General and Administrative Expenses 21.4 22.4 21.1 21.5
Adjusted EBITDA 25.6$ 26.1$ 33.0$ 39.7$
57
www.frgi.com
Adjusted Net Income Reconciliation
(a) Impairment and other lease charges for the twelve months ended December 30, 2012 are primarily related to the closure of five Pollo Tropical restaurants in New Jersey in the first quarter of 2012. Impairment and other lease charges for the
twelve months ended January 3, 2016 are primarily related to the suspension of our Cabana Grill concept at the end of fiscal 2015. Impairment and other lease charges for each period are presented net of taxes of $0.9 million, $0.1 million, $0.1
million and $2.4 million for the twelve months ended January 3, 2016, December 28, 2014, December 29, 2013 and December 30, 2012, respectively.
(b) Prior to the spin-off from Carrols Restaurant Group, Inc. ("Carrols"), certain sale-leaseback transactions were classified as lease financing transactions because Carrols guaranteed the related lease payments. Effective upon the spin-off, the
provisions that previously precluded sale-leaseback accounting were cured or eliminated. As a result, the real property leases entered into in connection with these transactions are now recorded as operating leases. Additionally, in the second
quarter of 2012, we exercised purchase options associated with the leases for five restaurant properties also previously accounted for as lease financing obligations and purchased those properties from the lessor.
The amount reported as "qualification for sale leaseback accounting" represents the net increase in rent expense, decrease in depreciation expense and decrease in interest expense, that would have impacted net income had the leases been
accounted for as operating leases for all periods presented, based on the deferred gain on sale-leaseback transactions calculated at the time of the spin-off, and had the five properties been owned for the full year ended December 30, 2012.
Qualification for sale leaseback accounting is shown net of taxes of $0.6 million in the twelve months ended December 30, 2012. This amount is included for comparative purposes only, and may not be indicative of what actual results would have
been had the qualification for sale-leaseback accounting treatment of these leases (and the treatment of such leases as operating leases) occurred on the dates described above.
(c) Secondary offering expenses for the twelve months ended December 29, 2013 include expenses related to the underwritten secondary public equity offering completed during March 2013 totaling $0.4 million. The Company did not receive any
proceeds from the sale of shares in the offering. Secondary offering expenses are presented net of taxes of $0.2 million.
(d) The Company recognized a loss on extinguishment of debt of $16.4 million in the fourth quarter of 2013 related to the repurchase and redemption of its Notes. The loss on extinguishment of debt for the twelve months ended December 29, 2013
is presented net of taxes of $5.9 million.
(e) Gain on condemnation in 2015 primarily includes a previously deferred gain from a sale-leaseback transaction that was recognized upon termination of the lease. Gain on condemnation in 2014 includes a gain from a condemnation award
resulting from an eminent domain proceeding. Gain on condemnation for each period is presented net of taxes of $(0.1) million and $(0.2) million for the twelve months ended January 3, 2016 and December 28, 2014, respectively.
(f) Legal settlements and related costs in 2015 include legal fees and other costs, including estimated settlement charges, associated with a class action litigation, and in 2014 include the benefit of a payment received as settlement of a litigation
matter. Legal settlements and related costs for each period are presented net of taxes of $0.6 million and $(0.2) million for the twelve months ended January 3, 2016 and December 28, 2014, respectively.
(g) Gain on sale of property for each period is presented net of taxes of $(0.2) million and $(0.0) million for the twelve months ended December 29, 2013 and December 30, 2012, respectively.
($s in millions, except per share amounts)
$ EPS $ EPS $ EPS $ EPS
Net Income 8.3$ 0.35$ 9.3$ 0.39$ 36.2$ 1.35$ 38.5$ 1.44$
Add (each net of tax effect):
Impairment and other lease charges (a) 4.6 0.20 0.1 - 0.2 0.01 1.5 0.05
Qualification for sale leaseback accounting (b) 1.2 0.05 - - - - - -
Secondary offering expenses (c) - - 0.3 0.01 - - - -
Loss on extinguishment of debt (d) - - 10.5 0.44 - - - -
Gain on condemnation (e) - - - - (0.3) (0.01) (0.2) (0.01)
Legal settlements and related costs (f) - - - - (0.3) (0.01) 1.0 0.04
Gain on sale of property (g) (0.1) - (0.3) (0.01) - - - -
Adjusted net income & EPS 14.1$ 0.60$ 19.9$ 0.83$ 35.7$ 1.33$ 40.8$ 1.52$
* Amounts do not add to adjusted total due to rounding
FY2012 FY2013 FY2014 FY2015
58
www.frgi.com
Use of Non-GAAP Financial Measures
Adjusted EBITDA, restaurant-level adjusted EBITDA, and restaurant-level adjusted EBITDA excluding pre-opening costs are all non-GAAP financial measures.
Adjusted EBITDA is defined as earnings attributable to the applicable segment before interest, loss on extinguishment of debt, income taxes, depreciation and
amortization, impairment and other lease charges, stock-based compensation expense and other income and expense. It includes an allocation of corporate and
brand general and administrative expenses (each excluding stock-based compensation). Restaurant-level adjusted EBITDA (excluding pre-opening costs) is defined
as Adjusted EBITDA excluding franchise royalty revenues and fees, pre-opening costs and general and administrative expenses. Management believes that such
financial measures, when viewed with our results of operations calculated in accordance with GAAP and our reconciliation of restaurant-level adjusted EBITDA and
restaurant-level adjusted EBITDA excluding pre-opening costs and adjusted EBITDA to net income (i) provide useful information about our operating performance and
period-over-period growth (including at the restaurant level), (ii) provide additional information that is useful for evaluating the operating performance of our business,
and (iii) permit investors to gain an understanding of the factors and trends affecting our ongoing earnings, from which capital investments are made and debt is
serviced. However, such measures are not measures of financial performance or liquidity under GAAP and, accordingly, should not be considered as alternatives to
net income or cash flow from operating activities as indicators of operating performance or liquidity. Also these measures may not be comparable to similarly titled
captions of other companies.
Adjusted net income and related adjusted earnings per share are non-GAAP financial measures. Adjusted net income is defined as net income before impairment and
other lease charges, the impact of the qualification for sale-leaseback accounting (primarily upon the spin-off from Carrols) for certain leases previously accounted for
as lease financing obligations, secondary offering expenses, loss on extinguishment of debt, gain on condemnation, legal settlements and related costs and gain on
sale of property. Management believes that adjusted net income and related adjusted earnings per diluted share, when viewed with our results of operations
calculated in accordance with GAAP (i) provide useful information about our operating performance and period-over-period growth, (ii) provide additional information
that is useful for evaluating the operating performance of our business, and (iii) permit investors to gain an understanding of the factors and trends affecting our
ongoing earnings, from which capital investments are made and debt is serviced. However, such measures are not measures of financial performance or liquidity
under GAAP and, accordingly should not be considered as alternatives to net income or net income per share as indicators of operating performance or liquidity. Also
these measures may not be comparable to similarly titled captions of other companies.

More Related Content

What's hot

Investor presentation april 2016
Investor presentation april 2016Investor presentation april 2016
Investor presentation april 2016StoneMor
 
Tsn investor presentation march 2014
Tsn investor presentation march 2014Tsn investor presentation march 2014
Tsn investor presentation march 2014investortyson
 
Abbott Labs 2012 Presentation
Abbott Labs 2012 PresentationAbbott Labs 2012 Presentation
Abbott Labs 2012 PresentationNeil Kimberley
 
Tyson Foods Investor Day
Tyson Foods Investor DayTyson Foods Investor Day
Tyson Foods Investor Dayinvestortyson
 
Tyson foods presentation 05 29 14
Tyson foods presentation 05 29 14Tyson foods presentation 05 29 14
Tyson foods presentation 05 29 14investortyson
 
Raymond James 37th Annual Institutional Investors Conference Presentation
Raymond James 37th Annual Institutional Investors Conference PresentationRaymond James 37th Annual Institutional Investors Conference Presentation
Raymond James 37th Annual Institutional Investors Conference PresentationStoneMor
 
Tsn investor deck 4 25-17
Tsn investor deck 4 25-17Tsn investor deck 4 25-17
Tsn investor deck 4 25-17investortyson
 
Tsn investor presentation december 2015
Tsn investor presentation december 2015Tsn investor presentation december 2015
Tsn investor presentation december 2015investortyson
 
Neil Kimberley Bevnet Dec 2013 Presentation
Neil Kimberley Bevnet Dec 2013 PresentationNeil Kimberley Bevnet Dec 2013 Presentation
Neil Kimberley Bevnet Dec 2013 PresentationNeil Kimberley
 
Tsn investor presentation february 2016
Tsn investor presentation february 2016Tsn investor presentation february 2016
Tsn investor presentation february 2016investortyson
 
BMC State of the US Non Alcoholic Beverage Industry 2019
BMC State of the US Non Alcoholic Beverage Industry 2019BMC State of the US Non Alcoholic Beverage Industry 2019
BMC State of the US Non Alcoholic Beverage Industry 2019Neil Kimberley
 
Tsn investor presentation may 2016
Tsn investor presentation may 2016Tsn investor presentation may 2016
Tsn investor presentation may 2016investortyson
 
Barclays 2015 final web 9 4
Barclays 2015 final web 9 4Barclays 2015 final web 9 4
Barclays 2015 final web 9 4pinnaclefood
 
Financial Analysis: Kraft Foods Inc. (KFT)
Financial Analysis: Kraft Foods Inc. (KFT)Financial Analysis: Kraft Foods Inc. (KFT)
Financial Analysis: Kraft Foods Inc. (KFT)Yaw Ofosu
 
Deutsche bank 2016_final_website
Deutsche bank 2016_final_websiteDeutsche bank 2016_final_website
Deutsche bank 2016_final_websitecloroxir2016
 
H.J. Heinz M&A Board meeting On the Proposed Acquisition
H.J. Heinz M&A  Board meeting On the Proposed AcquisitionH.J. Heinz M&A  Board meeting On the Proposed Acquisition
H.J. Heinz M&A Board meeting On the Proposed AcquisitionDebiprasad Dash
 

What's hot (20)

Investor presentation april 2016
Investor presentation april 2016Investor presentation april 2016
Investor presentation april 2016
 
Hershey CAGNY 2015
Hershey CAGNY 2015Hershey CAGNY 2015
Hershey CAGNY 2015
 
C Store 2019 review
C Store 2019 reviewC Store 2019 review
C Store 2019 review
 
Tsn investor presentation march 2014
Tsn investor presentation march 2014Tsn investor presentation march 2014
Tsn investor presentation march 2014
 
Abbott Labs 2012 Presentation
Abbott Labs 2012 PresentationAbbott Labs 2012 Presentation
Abbott Labs 2012 Presentation
 
Tyson Foods Investor Day
Tyson Foods Investor DayTyson Foods Investor Day
Tyson Foods Investor Day
 
Tyson foods presentation 05 29 14
Tyson foods presentation 05 29 14Tyson foods presentation 05 29 14
Tyson foods presentation 05 29 14
 
Raymond James 37th Annual Institutional Investors Conference Presentation
Raymond James 37th Annual Institutional Investors Conference PresentationRaymond James 37th Annual Institutional Investors Conference Presentation
Raymond James 37th Annual Institutional Investors Conference Presentation
 
Tsn investor deck 4 25-17
Tsn investor deck 4 25-17Tsn investor deck 4 25-17
Tsn investor deck 4 25-17
 
Tsn investor presentation december 2015
Tsn investor presentation december 2015Tsn investor presentation december 2015
Tsn investor presentation december 2015
 
Neil Kimberley Bevnet Dec 2013 Presentation
Neil Kimberley Bevnet Dec 2013 PresentationNeil Kimberley Bevnet Dec 2013 Presentation
Neil Kimberley Bevnet Dec 2013 Presentation
 
Tsn investor presentation february 2016
Tsn investor presentation february 2016Tsn investor presentation february 2016
Tsn investor presentation february 2016
 
BMC State of the US Non Alcoholic Beverage Industry 2019
BMC State of the US Non Alcoholic Beverage Industry 2019BMC State of the US Non Alcoholic Beverage Industry 2019
BMC State of the US Non Alcoholic Beverage Industry 2019
 
Tsn investor presentation may 2016
Tsn investor presentation may 2016Tsn investor presentation may 2016
Tsn investor presentation may 2016
 
Kraft heinz
Kraft heinzKraft heinz
Kraft heinz
 
Barclays 2015 final web 9 4
Barclays 2015 final web 9 4Barclays 2015 final web 9 4
Barclays 2015 final web 9 4
 
Financial Analysis: Kraft Foods Inc. (KFT)
Financial Analysis: Kraft Foods Inc. (KFT)Financial Analysis: Kraft Foods Inc. (KFT)
Financial Analysis: Kraft Foods Inc. (KFT)
 
Deutsche bank 2016_final_website
Deutsche bank 2016_final_websiteDeutsche bank 2016_final_website
Deutsche bank 2016_final_website
 
Investor Overview
Investor OverviewInvestor Overview
Investor Overview
 
H.J. Heinz M&A Board meeting On the Proposed Acquisition
H.J. Heinz M&A  Board meeting On the Proposed AcquisitionH.J. Heinz M&A  Board meeting On the Proposed Acquisition
H.J. Heinz M&A Board meeting On the Proposed Acquisition
 

Viewers also liked

Class Dismissed Sketch
Class Dismissed SketchClass Dismissed Sketch
Class Dismissed Sketchadamgrantuk
 
Frgi June 2015 Investor Presentation
Frgi June 2015 Investor PresentationFrgi June 2015 Investor Presentation
Frgi June 2015 Investor Presentationfiestarestaurant
 
CV Faizur Rahman RM 2015
CV Faizur Rahman RM 2015CV Faizur Rahman RM 2015
CV Faizur Rahman RM 2015Faizur Rahman
 
Frgi november 2015 investor presentation final
Frgi   november 2015 investor presentation finalFrgi   november 2015 investor presentation final
Frgi november 2015 investor presentation finalfiestarestaurant
 
March 2015 Investor Presentation
March 2015 Investor PresentationMarch 2015 Investor Presentation
March 2015 Investor Presentationfiestarestaurant
 
Frgi investor presentation spring 2016
Frgi investor presentation spring 2016Frgi investor presentation spring 2016
Frgi investor presentation spring 2016fiestarestaurant
 
EXPERIENCE LETTER laurel bakery
EXPERIENCE LETTER laurel bakeryEXPERIENCE LETTER laurel bakery
EXPERIENCE LETTER laurel bakeryAshmita Ghosh
 
matrix ventures work experience
matrix ventures work experiencematrix ventures work experience
matrix ventures work experienceAshmita Ghosh
 
certificates and marksheets of BSC
certificates and marksheets of  BSCcertificates and marksheets of  BSC
certificates and marksheets of BSCAshmita Ghosh
 
EXPERIENCE LETTER Career Launcher
EXPERIENCE LETTER Career LauncherEXPERIENCE LETTER Career Launcher
EXPERIENCE LETTER Career LauncherAshmita Ghosh
 

Viewers also liked (12)

Class Dismissed Sketch
Class Dismissed SketchClass Dismissed Sketch
Class Dismissed Sketch
 
Frgi June 2015 Investor Presentation
Frgi June 2015 Investor PresentationFrgi June 2015 Investor Presentation
Frgi June 2015 Investor Presentation
 
CV Faizur Rahman RM 2015
CV Faizur Rahman RM 2015CV Faizur Rahman RM 2015
CV Faizur Rahman RM 2015
 
News to Me
News to MeNews to Me
News to Me
 
Frgi november 2015 investor presentation final
Frgi   november 2015 investor presentation finalFrgi   november 2015 investor presentation final
Frgi november 2015 investor presentation final
 
March 2015 Investor Presentation
March 2015 Investor PresentationMarch 2015 Investor Presentation
March 2015 Investor Presentation
 
Learning styles
Learning stylesLearning styles
Learning styles
 
Frgi investor presentation spring 2016
Frgi investor presentation spring 2016Frgi investor presentation spring 2016
Frgi investor presentation spring 2016
 
EXPERIENCE LETTER laurel bakery
EXPERIENCE LETTER laurel bakeryEXPERIENCE LETTER laurel bakery
EXPERIENCE LETTER laurel bakery
 
matrix ventures work experience
matrix ventures work experiencematrix ventures work experience
matrix ventures work experience
 
certificates and marksheets of BSC
certificates and marksheets of  BSCcertificates and marksheets of  BSC
certificates and marksheets of BSC
 
EXPERIENCE LETTER Career Launcher
EXPERIENCE LETTER Career LauncherEXPERIENCE LETTER Career Launcher
EXPERIENCE LETTER Career Launcher
 

Similar to March 2016 Investor Presentation

2019 CAGNY INGR.pdf
2019 CAGNY INGR.pdf2019 CAGNY INGR.pdf
2019 CAGNY INGR.pdfraheelehsan
 
20160113 icr presentation vfinal
20160113 icr presentation vfinal20160113 icr presentation vfinal
20160113 icr presentation vfinalSysco_Investors
 
Investor deck (fy16 q4) final 9.7.16
Investor deck (fy16 q4) final 9.7.16Investor deck (fy16 q4) final 9.7.16
Investor deck (fy16 q4) final 9.7.16cloroxir2016
 
Tsn investor presentation march 2016
Tsn investor presentation march 2016Tsn investor presentation march 2016
Tsn investor presentation march 2016investortyson
 
Investor deck (fy17 q3) final
Investor deck (fy17 q3) finalInvestor deck (fy17 q3) final
Investor deck (fy17 q3) finalcloroxir2016
 
Investor deck (fy17 q1) final
Investor deck (fy17 q1) finalInvestor deck (fy17 q1) final
Investor deck (fy17 q1) finalcloroxir2016
 
Clx investor presentation
Clx investor presentationClx investor presentation
Clx investor presentationcloroxir2016
 
BTTR Investor Presentation - August 2020
BTTR Investor Presentation - August 2020BTTR Investor Presentation - August 2020
BTTR Investor Presentation - August 2020RedChip Companies, Inc.
 
Hunger for Growth 2013 - Grant Thornton
Hunger for Growth 2013 - Grant ThorntonHunger for Growth 2013 - Grant Thornton
Hunger for Growth 2013 - Grant ThorntonSOS Interim Management
 
Yum! Brands - 2014 Analyst Meeting Presentation
Yum! Brands - 2014 Analyst Meeting PresentationYum! Brands - 2014 Analyst Meeting Presentation
Yum! Brands - 2014 Analyst Meeting PresentationCompany Spotlight
 
20160216 cagny presentation vfinal
20160216 cagny presentation vfinal20160216 cagny presentation vfinal
20160216 cagny presentation vfinalSysco_Investors
 
Tyson cagny webcast_022018
Tyson cagny webcast_022018Tyson cagny webcast_022018
Tyson cagny webcast_022018investortyson
 
Food and beverage looks to the future
Food and beverage looks to the futureFood and beverage looks to the future
Food and beverage looks to the futureGrant Thornton
 
General Mills Presentation at CAGNY 2024
General Mills Presentation at CAGNY 2024General Mills Presentation at CAGNY 2024
General Mills Presentation at CAGNY 2024Neil Kimberley
 
Investor deck (fy17 q2) final
Investor deck (fy17 q2) finalInvestor deck (fy17 q2) final
Investor deck (fy17 q2) finalcloroxir2016
 
Investor deck (fy17 q2) final v2
Investor deck (fy17 q2) final v2Investor deck (fy17 q2) final v2
Investor deck (fy17 q2) final v2cloroxir2016
 
Running Head COMPANY ANALYSIS1COMPANY ANALYSIS 7.docx
Running Head COMPANY ANALYSIS1COMPANY ANALYSIS 7.docxRunning Head COMPANY ANALYSIS1COMPANY ANALYSIS 7.docx
Running Head COMPANY ANALYSIS1COMPANY ANALYSIS 7.docxsusanschei
 
Bagr september 2015 investor presentation final
Bagr september 2015 investor presentation finalBagr september 2015 investor presentation final
Bagr september 2015 investor presentation finaldrhincorporated
 
Coca Cola Investor Day 2017 - Francisco Crespo - CGO
Coca Cola Investor Day 2017 - Francisco Crespo - CGOCoca Cola Investor Day 2017 - Francisco Crespo - CGO
Coca Cola Investor Day 2017 - Francisco Crespo - CGONeil Kimberley
 

Similar to March 2016 Investor Presentation (20)

2019 CAGNY INGR.pdf
2019 CAGNY INGR.pdf2019 CAGNY INGR.pdf
2019 CAGNY INGR.pdf
 
20160113 icr presentation vfinal
20160113 icr presentation vfinal20160113 icr presentation vfinal
20160113 icr presentation vfinal
 
Investor deck (fy16 q4) final 9.7.16
Investor deck (fy16 q4) final 9.7.16Investor deck (fy16 q4) final 9.7.16
Investor deck (fy16 q4) final 9.7.16
 
Tsn investor presentation march 2016
Tsn investor presentation march 2016Tsn investor presentation march 2016
Tsn investor presentation march 2016
 
Investor deck (fy17 q3) final
Investor deck (fy17 q3) finalInvestor deck (fy17 q3) final
Investor deck (fy17 q3) final
 
Investor deck (fy17 q1) final
Investor deck (fy17 q1) finalInvestor deck (fy17 q1) final
Investor deck (fy17 q1) final
 
Clx investor presentation
Clx investor presentationClx investor presentation
Clx investor presentation
 
BTTR Investor Presentation - August 2020
BTTR Investor Presentation - August 2020BTTR Investor Presentation - August 2020
BTTR Investor Presentation - August 2020
 
Hunger for Growth 2013 - Grant Thornton
Hunger for Growth 2013 - Grant ThorntonHunger for Growth 2013 - Grant Thornton
Hunger for Growth 2013 - Grant Thornton
 
Yum! Brands - 2014 Analyst Meeting Presentation
Yum! Brands - 2014 Analyst Meeting PresentationYum! Brands - 2014 Analyst Meeting Presentation
Yum! Brands - 2014 Analyst Meeting Presentation
 
20160216 cagny presentation vfinal
20160216 cagny presentation vfinal20160216 cagny presentation vfinal
20160216 cagny presentation vfinal
 
Tyson cagny webcast_022018
Tyson cagny webcast_022018Tyson cagny webcast_022018
Tyson cagny webcast_022018
 
PEP 2023 CAGNY.pdf
PEP 2023 CAGNY.pdfPEP 2023 CAGNY.pdf
PEP 2023 CAGNY.pdf
 
Food and beverage looks to the future
Food and beverage looks to the futureFood and beverage looks to the future
Food and beverage looks to the future
 
General Mills Presentation at CAGNY 2024
General Mills Presentation at CAGNY 2024General Mills Presentation at CAGNY 2024
General Mills Presentation at CAGNY 2024
 
Investor deck (fy17 q2) final
Investor deck (fy17 q2) finalInvestor deck (fy17 q2) final
Investor deck (fy17 q2) final
 
Investor deck (fy17 q2) final v2
Investor deck (fy17 q2) final v2Investor deck (fy17 q2) final v2
Investor deck (fy17 q2) final v2
 
Running Head COMPANY ANALYSIS1COMPANY ANALYSIS 7.docx
Running Head COMPANY ANALYSIS1COMPANY ANALYSIS 7.docxRunning Head COMPANY ANALYSIS1COMPANY ANALYSIS 7.docx
Running Head COMPANY ANALYSIS1COMPANY ANALYSIS 7.docx
 
Bagr september 2015 investor presentation final
Bagr september 2015 investor presentation finalBagr september 2015 investor presentation final
Bagr september 2015 investor presentation final
 
Coca Cola Investor Day 2017 - Francisco Crespo - CGO
Coca Cola Investor Day 2017 - Francisco Crespo - CGOCoca Cola Investor Day 2017 - Francisco Crespo - CGO
Coca Cola Investor Day 2017 - Francisco Crespo - CGO
 

Recently uploaded

VIP Call Girls Mehsana 7001035870 Whatsapp Number, 24/07 Booking
VIP Call Girls Mehsana 7001035870 Whatsapp Number, 24/07 BookingVIP Call Girls Mehsana 7001035870 Whatsapp Number, 24/07 Booking
VIP Call Girls Mehsana 7001035870 Whatsapp Number, 24/07 Bookingdharasingh5698
 
Western Copper and Gold - May 2024 Presentation
Western Copper and Gold - May 2024 PresentationWestern Copper and Gold - May 2024 Presentation
Western Copper and Gold - May 2024 PresentationPaul West-Sells
 
VVIP Pune Call Girls Sopan Baug WhatSapp Number 8005736733 With Elite Staff A...
VVIP Pune Call Girls Sopan Baug WhatSapp Number 8005736733 With Elite Staff A...VVIP Pune Call Girls Sopan Baug WhatSapp Number 8005736733 With Elite Staff A...
VVIP Pune Call Girls Sopan Baug WhatSapp Number 8005736733 With Elite Staff A...SUHANI PANDEY
 
Indapur - Virgin Call Girls Pune | Whatsapp No 8005736733 VIP Escorts Service...
Indapur - Virgin Call Girls Pune | Whatsapp No 8005736733 VIP Escorts Service...Indapur - Virgin Call Girls Pune | Whatsapp No 8005736733 VIP Escorts Service...
Indapur - Virgin Call Girls Pune | Whatsapp No 8005736733 VIP Escorts Service...SUHANI PANDEY
 
Financial Results for the Fiscal Year Ended March 2024
Financial Results for the Fiscal Year Ended March 2024Financial Results for the Fiscal Year Ended March 2024
Financial Results for the Fiscal Year Ended March 2024KDDI
 
Teck Supplemental Information, May 2, 2024
Teck Supplemental Information, May 2, 2024Teck Supplemental Information, May 2, 2024
Teck Supplemental Information, May 2, 2024TeckResourcesLtd
 
VVIP Pune Call Girls Parvati Gaon WhatSapp Number 8005736733 With Elite Staff...
VVIP Pune Call Girls Parvati Gaon WhatSapp Number 8005736733 With Elite Staff...VVIP Pune Call Girls Parvati Gaon WhatSapp Number 8005736733 With Elite Staff...
VVIP Pune Call Girls Parvati Gaon WhatSapp Number 8005736733 With Elite Staff...SUHANI PANDEY
 
VIP Call Girls Kheda 7001035870 Whatsapp Number, 24/07 Booking
VIP Call Girls Kheda 7001035870 Whatsapp Number, 24/07 BookingVIP Call Girls Kheda 7001035870 Whatsapp Number, 24/07 Booking
VIP Call Girls Kheda 7001035870 Whatsapp Number, 24/07 Bookingdharasingh5698
 
Best investment platform in india-Falcon Invoice Discounting
Best investment platform in india-Falcon Invoice DiscountingBest investment platform in india-Falcon Invoice Discounting
Best investment platform in india-Falcon Invoice DiscountingFalcon Invoice Discounting
 
Collective Mining | Corporate Presentation - May 2024
Collective Mining | Corporate Presentation - May 2024Collective Mining | Corporate Presentation - May 2024
Collective Mining | Corporate Presentation - May 2024CollectiveMining1
 
Teekay Corporation Q1-24 Earnings Results
Teekay Corporation Q1-24 Earnings ResultsTeekay Corporation Q1-24 Earnings Results
Teekay Corporation Q1-24 Earnings ResultsTeekay Corporation
 
💚😋 Saharanpur Escort Service Call Girls, 9352852248 ₹5000 To 25K With AC💚😋
💚😋 Saharanpur Escort Service Call Girls, 9352852248 ₹5000 To 25K With AC💚😋💚😋 Saharanpur Escort Service Call Girls, 9352852248 ₹5000 To 25K With AC💚😋
💚😋 Saharanpur Escort Service Call Girls, 9352852248 ₹5000 To 25K With AC💚😋nirzagarg
 
AMG Quarterly Investor Presentation May 2024
AMG Quarterly Investor Presentation May 2024AMG Quarterly Investor Presentation May 2024
AMG Quarterly Investor Presentation May 2024gstubel
 
Nicola Mining Inc. Corporate Presentation May 2024
Nicola Mining Inc. Corporate Presentation May 2024Nicola Mining Inc. Corporate Presentation May 2024
Nicola Mining Inc. Corporate Presentation May 2024nicola_mining
 
Osisko Development - Investor Presentation - May 2024
Osisko Development - Investor Presentation - May 2024Osisko Development - Investor Presentation - May 2024
Osisko Development - Investor Presentation - May 2024Philip Rabenok
 
Corporate Presentation Probe Canaccord Conference 2024.pdf
Corporate Presentation Probe Canaccord Conference 2024.pdfCorporate Presentation Probe Canaccord Conference 2024.pdf
Corporate Presentation Probe Canaccord Conference 2024.pdfProbe Gold
 
countries with the highest gold reserves in 2024
countries with the highest gold reserves in 2024countries with the highest gold reserves in 2024
countries with the highest gold reserves in 2024Kweku Zurek
 

Recently uploaded (20)

VIP Call Girls Mehsana 7001035870 Whatsapp Number, 24/07 Booking
VIP Call Girls Mehsana 7001035870 Whatsapp Number, 24/07 BookingVIP Call Girls Mehsana 7001035870 Whatsapp Number, 24/07 Booking
VIP Call Girls Mehsana 7001035870 Whatsapp Number, 24/07 Booking
 
Western Copper and Gold - May 2024 Presentation
Western Copper and Gold - May 2024 PresentationWestern Copper and Gold - May 2024 Presentation
Western Copper and Gold - May 2024 Presentation
 
VVIP Pune Call Girls Sopan Baug WhatSapp Number 8005736733 With Elite Staff A...
VVIP Pune Call Girls Sopan Baug WhatSapp Number 8005736733 With Elite Staff A...VVIP Pune Call Girls Sopan Baug WhatSapp Number 8005736733 With Elite Staff A...
VVIP Pune Call Girls Sopan Baug WhatSapp Number 8005736733 With Elite Staff A...
 
Indapur - Virgin Call Girls Pune | Whatsapp No 8005736733 VIP Escorts Service...
Indapur - Virgin Call Girls Pune | Whatsapp No 8005736733 VIP Escorts Service...Indapur - Virgin Call Girls Pune | Whatsapp No 8005736733 VIP Escorts Service...
Indapur - Virgin Call Girls Pune | Whatsapp No 8005736733 VIP Escorts Service...
 
SME IPO Opportunity and Trends of May 2024
SME IPO Opportunity and Trends of May 2024SME IPO Opportunity and Trends of May 2024
SME IPO Opportunity and Trends of May 2024
 
Financial Results for the Fiscal Year Ended March 2024
Financial Results for the Fiscal Year Ended March 2024Financial Results for the Fiscal Year Ended March 2024
Financial Results for the Fiscal Year Ended March 2024
 
Teck Supplemental Information, May 2, 2024
Teck Supplemental Information, May 2, 2024Teck Supplemental Information, May 2, 2024
Teck Supplemental Information, May 2, 2024
 
(INDIRA) Call Girl Kashmir Call Now 8617697112 Kashmir Escorts 24x7
(INDIRA) Call Girl Kashmir Call Now 8617697112 Kashmir Escorts 24x7(INDIRA) Call Girl Kashmir Call Now 8617697112 Kashmir Escorts 24x7
(INDIRA) Call Girl Kashmir Call Now 8617697112 Kashmir Escorts 24x7
 
VVIP Pune Call Girls Parvati Gaon WhatSapp Number 8005736733 With Elite Staff...
VVIP Pune Call Girls Parvati Gaon WhatSapp Number 8005736733 With Elite Staff...VVIP Pune Call Girls Parvati Gaon WhatSapp Number 8005736733 With Elite Staff...
VVIP Pune Call Girls Parvati Gaon WhatSapp Number 8005736733 With Elite Staff...
 
VIP Call Girls Kheda 7001035870 Whatsapp Number, 24/07 Booking
VIP Call Girls Kheda 7001035870 Whatsapp Number, 24/07 BookingVIP Call Girls Kheda 7001035870 Whatsapp Number, 24/07 Booking
VIP Call Girls Kheda 7001035870 Whatsapp Number, 24/07 Booking
 
Best investment platform in india-Falcon Invoice Discounting
Best investment platform in india-Falcon Invoice DiscountingBest investment platform in india-Falcon Invoice Discounting
Best investment platform in india-Falcon Invoice Discounting
 
Collective Mining | Corporate Presentation - May 2024
Collective Mining | Corporate Presentation - May 2024Collective Mining | Corporate Presentation - May 2024
Collective Mining | Corporate Presentation - May 2024
 
Teekay Corporation Q1-24 Earnings Results
Teekay Corporation Q1-24 Earnings ResultsTeekay Corporation Q1-24 Earnings Results
Teekay Corporation Q1-24 Earnings Results
 
💚😋 Saharanpur Escort Service Call Girls, 9352852248 ₹5000 To 25K With AC💚😋
💚😋 Saharanpur Escort Service Call Girls, 9352852248 ₹5000 To 25K With AC💚😋💚😋 Saharanpur Escort Service Call Girls, 9352852248 ₹5000 To 25K With AC💚😋
💚😋 Saharanpur Escort Service Call Girls, 9352852248 ₹5000 To 25K With AC💚😋
 
AMG Quarterly Investor Presentation May 2024
AMG Quarterly Investor Presentation May 2024AMG Quarterly Investor Presentation May 2024
AMG Quarterly Investor Presentation May 2024
 
Nicola Mining Inc. Corporate Presentation May 2024
Nicola Mining Inc. Corporate Presentation May 2024Nicola Mining Inc. Corporate Presentation May 2024
Nicola Mining Inc. Corporate Presentation May 2024
 
Osisko Development - Investor Presentation - May 2024
Osisko Development - Investor Presentation - May 2024Osisko Development - Investor Presentation - May 2024
Osisko Development - Investor Presentation - May 2024
 
Corporate Presentation Probe Canaccord Conference 2024.pdf
Corporate Presentation Probe Canaccord Conference 2024.pdfCorporate Presentation Probe Canaccord Conference 2024.pdf
Corporate Presentation Probe Canaccord Conference 2024.pdf
 
countries with the highest gold reserves in 2024
countries with the highest gold reserves in 2024countries with the highest gold reserves in 2024
countries with the highest gold reserves in 2024
 
Call Girls in Panjabi Bagh, Delhi 💯 Call Us 🔝9953056974 🔝 Escort Service
Call Girls in Panjabi Bagh, Delhi 💯 Call Us 🔝9953056974 🔝 Escort ServiceCall Girls in Panjabi Bagh, Delhi 💯 Call Us 🔝9953056974 🔝 Escort Service
Call Girls in Panjabi Bagh, Delhi 💯 Call Us 🔝9953056974 🔝 Escort Service
 

March 2016 Investor Presentation

  • 2. 2 www.frgi.com Tim Taft President & Chief Executive Officer Presenters President & Chief Executive Officer Lynn Schweinfurth Chief Financial Officer
  • 3. 3 www.frgi.com Forward-looking Statements This document and our presentation contain “forward-looking statements” within the meaning of Section 27A of the Securities Act of 1933, as amended, and Section 21E of the Securities Exchange Act of 1934, as amended and are intended to be covered by the “safe harbor” created by those sections. All statements, other than statements of historical facts included herein, including, without limitation, statements regarding our future financial position and results of operations, business strategy, budgets, projected costs and plans and objectives of management for future operations, are “forward-looking statements.” Forward-looking statements generally can be identified by the use of forward-looking terminology such as “may,” “will,” “expect,” “anticipate,” “intend,” “plan,” “believe,” “seek,” “estimate” or “continue” or the negative of such words or variations of such words and similar expressions. These statements are not guarantees of future performance and involve certain risks, uncertainties and assumptions, which are difficult to predict. Therefore, actual outcomes and results may differ materially from what is expressed or forecasted in such forward-looking statements and we can give no assurance that such forward-looking statements will prove to be correct. Important factors that could cause actual results to differ materially from those expressed or implied by the forward-looking statements, or “cautionary statements,” include, but are not limited to: increases in food and other commodity costs; risks associated with the expansion of our business; our ability to manage our growth and successfully implement our business strategy; general economic conditions, particularly in the retail sector; competitive conditions; weather conditions; fuel prices; significant disruptions in service or supply by any of our suppliers or distributors; changes in consumer perception of dietary health and food safety; labor and employment benefit costs; regulatory factors; the outcome of pending or future legal claims or proceedings; environmental conditions and regulations; our borrowing costs; the availability and terms of necessary or desirable financing or refinancing and other related risks and uncertainties; the risk of an act of terrorism or escalation of any insurrection or armed conflict involving the United States or any other national or international calamity; factors that affect the restaurant industry generally, including product recalls, liability if our products cause injury, ingredient disclosure and labeling laws and regulations, reports of cases of food-borne illnesses such as “mad cow” disease and “avian” flu, and the possibility that consumers could lose confidence in the safety and quality of certain food products, as well as negative publicity regarding food quality, illness, injury or other health concerns.
  • 5. 5 www.frgi.com Investment Considerations Accelerating Development Given Significant Potential Compelling Business Model Well Positioned Within the Growing Fast-Casual Segment Proven Financial Results Two Leading, Differentiated Brands What you want to know
  • 6. 6 www.frgi.com Recent Development Expected Completion in 2017 or 2018 Announced Intention to Separate Pollo Tropical and Taco Cabana Businesses Tax-efficient Distribution of 100% of TC’s Stock to Fiesta’s Shareholder Two Standalone Companies with Dedicated Strategy and Execution Eventually Build Two Fully Independent Management Teams
  • 8. 8 www.frgi.com Industry-leading AUVs $s in millions. Sources: company filings. $2.6 $2.6 $2.4 $1.1$1.2 $1.0 $1.6 $1.9 FY 2015, Average Annual Sales at Company-owned Restaurants
  • 9. 9 www.frgi.com Industry-leading AUVs AUV Growth CAGR = 4.7% AUV Growth CAGR = 3.5% $1.6 $1.7 $1.8 $1.8 2010 2011 2012 2013 2014 $1.8 $2.1 $2.3 $2.5 $2.7 $2.7 20142013201220112010 $2.6 2015 $1.9 2015
  • 10. 10 www.frgi.com Compelling Restaurant-level EBITDA Restaurant-level EBITDA is defined as restaurant sales minus cost of sales, labor, occupancy, other operating and advertising expenses. Pre-opening cost is excluded from the calculation. Sources: company filings 24.8% 26.1% 16.3% 16.2% 19.4% 21.1% 16.6% 19.0% FY 2015, % of Restaurant Sales
  • 11. 11 www.frgi.com Restaurant Growth Potential Unit 3,200 4,500 2,000 N/A 2,500 N/A N/A N/A N/A 1,600 Potential % of Unit 62% 44% 32% N/A 20% N/A N/A N/A N/A 10% Potential 169 168 160 1,972 661 611 492 433 396 1,971 174 FY 2015, Number of System-wide Restaurants in U.S. Sources: Domestic system wide unit counts for competitors as of the most recent filings.
  • 13. 13 www.frgi.com A Unique and Extraordinary Brand Freshly prepared Caribbean-inspired food you feel good about eating. A 28 year old brand originating in South Florida Truly differentiated restaurant concept with no direct competitor Signature offerings: fresh, grilled bone-in chicken marinated with tropical fruit juices and spices, rice and beans • Additional proteins, side dishes, salads and wraps further broaden target audience • Rum punch and Caribbean beer • Self service Saucing Island includes made from scratch salsas and sauces Significant restaurant growth potential Best-in-class restaurant economics Attractive value proposition - great quality food with an average check of ~ $10 Convenience with dine-in, take out and drive-thru Catering growth is a meaningful opportunity
  • 14. 14 www.frgi.com Restaurant Sales Growth and Margin Trends 2012 2013 2014 2015 8.1% 5.9% 6.6% 3.8% SSS Growth Restaurant-level EBITDA Margin (% of Restaurant Sales) 2012 2013 2014 2015 25.6% 26.3% 25.9% 24.8%
  • 16. 16 www.frgi.com Our Differentiated Restaurant Growth Vehicle New Prototype Introduced in Texas in March 2014
  • 18. 18 www.frgi.com Accelerating Growth and National Potential 155 Company & 35 Franchise Restaurants 36-40 New Company Restaurants in 2016, or 23% Brand Restaurant Growth Short-term Southern Focus; Long-term National Potential Market Share Growth with Planned Cannibalization Non-traditional U.S. Licensing Opportunities
  • 19. 19 www.frgi.com Accelerating Growth and National Potential 23/ 0 11 / 0 117 / 5 Current U.S. Footprint New Company-Owned Restaurants Opened 2010................................................................ 2011................................................................ 2012................................................................ 2013.............................................................. 2014……………………………...……………. 2015…………………………………………..... 2016 ………………………………………. 2 2 5 12 22 32 36-40E Where two numbers appear on the map, the first represents company-owned restaurants and the second represents franchised and licensed restaurants.
  • 20. 20 www.frgi.com Development Strategy CORE SOUTH FLORIDA MARKETS SUPERIOR BRAND AWARENESS Miami-Dade, Broward, & Palm Beach Counties Exceptional financial performance OTHER FLORIDA MARKETS DRIVING TRAFFIC GROWTH WITH MEDIA Orlando, Naples/Fort Myers, Tampa, Jacksonville & Nashville Driving higher brand awareness through new development and media strategies At scale to drive meaningful sales growth with media EMERGING MARKETS LOW BRAND AWARENESS, NOT ON BROADCAST MEDIA Dallas, Houston, San Antonio & Atlanta Robust development pipeline in Texas; build out Atlanta over time as trade areas develop Atlanta to begin broadcast media by 4Q 2016, San Antonio started media in mid- February
  • 23. 23 www.frgi.com Broad Menu Offerings with Mexican Authenticity Fresh, contemporary food prepared with authentic flavors of Mexico A 38 year old brand originating in San Antonio 24-hour format Broad, authentic Mexican product offerings including sizzling fajitas, enchiladas, quesadillas, burritos and salads • Margaritas and beer • Fresh tortillas made daily • Self service salsa bar includes made from scratch salsas and sauces Top five AUV in the fast casual segment, operating performance at peak Expansion in Texas Attractive value proposition - great quality food with an average check of ~ $9 Convenience with dine-in, take out and drive-thru Catering growth is a meaningful opportunity
  • 24. 24 www.frgi.com Restaurant Sales Growth and Margin Trends 4.7% 0.5% 3.3% 4.4% 2012 2013 2014 2015 SSS Growth Restaurant-level EBITDA Margin (% of Restaurant Sales) 2012 2013 2014 2015 16.9% 16.7% 17.9% 19.0% Restaurant-level EBITDAMargin excludes pre-opening costs.
  • 26. 26 www.frgi.com Renewed Texas Expansion Leveraging Proven Brand Affinity 2012 Prototype New Prototype All stores reimaged between 2012 and 2015
  • 27. 27 www.frgi.com Renewed Texas Expansion Leveraging Proven Brand Affinity
  • 28. 28 www.frgi.com 2016 sales and traffic drivers 1% pricing Incremental advertising expense at Pollo ~ 50 bps or $4 million+ • Increased media weights in mature markets • At least 84% of restaurants will be supported by broadcast media • Earlier investment in new markets New “Real People” advertising campaign at Pollo New product news with limited-time-promotions Continuation of the Pollo remodel program Introduction of new loyalty programs Continuation of new focus on off-premise Ongoing operations focus and execution Guidance – at least low single digit comparable sales growth at both brands 1.5% to 2.5% of pricing New product news with limited-time-promotions Completed Taco Cabana remodel program Introduction of new loyalty programs Continuation of new focus on off premise Ongoing operations focus and execution
  • 30. 30 www.frgi.com The rest of the story. (what you need to know)
  • 31. 31 www.frgi.com Not the typical growth story THE BIG 3 Miami-Dade, Palm Beach and Broward • Represents 65 of the 91 restaurants in 2012 • Average Unit Volume of $2.8 in 2012 Atlanta Jacksonville Orlando Tampa Ft. Myers 26restaurants 5cities $1.9Million AUV Other five markets
  • 32. 32 www.frgi.com From 2012 to 2015 THE BIG 3 65 to 77 units $2.8 to $3.3 AUV
  • 33. 33 www.frgi.com Growth of the other five cities 26 to 50 units $1.9 to $2.0 AUV Now Media Efficient Atlanta Jacksonville Orlando Tampa Ft. Myers • Media in Atlanta to begin 4Q 2016
  • 34. 34 www.frgi.com In 2016, 84% Restaurants in Markets with Broadcast Media
  • 35. 35 www.frgi.com Case Study – Naples / Ft Myers Ft. Myers
  • 36. 36 www.frgi.com Case Study – Naples / Ft Myers, Building Market Share 2012 3 2013 4 2014 6 2015 7 Company-owned Restaurants 2012 0.4 2013 0.7 2014 1.1 2015 1.3 Total Transactions 2012 $1.6 2013 $2.1 2014 $2.4 2015 $2.3 Annual Unit Volume (in millions)
  • 37. 37 www.frgi.com Growth in Texas Opened Texas in 2014 Increased units in 2015 from 10 to 23 Dallas Houston Austin San Antonio Project 41 total units by the end of 2016 San Antonio media turned on Feb 2016
  • 38. 38 www.frgi.com The rest of the story • Management teams overhauled • Recipes & portion sizes made consistent • Achieving all-time best customer feedback scores • Positive transactions despite sizable price increases • Enhanced culinary team • System reimage program completed
  • 39. 39 www.frgi.com • The Big 3 represent 50% of all restaurants • Maintain highest AUVs in the industry • Funded emerging Florida markets • Reworked process, procedures, I.T. infrastructure, HR, development and supply chain all while plane is flying The rest of the story
  • 40. 40 www.frgi.com Still many levers to pull to drive SSS 53% OFF PREMISE CONSUMPTION MARKETING CATERING INNOVATIONLOYALTY
  • 41. 41 www.frgi.com By end of 2016 Doubling in size since 2012
  • 42. 42 www.frgi.com And now you know the rest of the story.
  • 44. 44 www.frgi.com Accelerating Growth Since 2012 Spin-off Note: Restaurant-level EBITDA Margin excludes pre-opening costs. Company-owned Restaurant Growth Adjusted Diluted EPS CAGR = 36.3% Revenue Growth 0.8% 6.4% 9.0% 8.9% 2012 2013 2014 2015 7.3% 8.2% 10.8% 12.5% 2012 2013 2014 2015 20.8% 21.2% 21.9% 22.1% 2012 2013 2014 2015 Restaurant-level EBITDA Margin % of Restaurant Sales 130 bps Margin Expansion $0.60 $0.83 $1.33 $1.52 2012 2013 2014 2015
  • 45. 45 www.frgi.com Proven Business Model Note: Restaurant-level EBITDA Margin excludes pre-opening costs. 0.0% 12.1% 21.6% 25.0% 2012 2013 2014 2015 Company-owned Restaurant Growth 11.3% 16.5% 16.5% 14.5% 2012 2013 2014 2015 Restaurant-level EBITDA Growth 8.5% 13.3% 20.5% 12.5% 2012 2013 2014 2015 Adjusted EBITDA Growth 9.5% 13.2% 18.4% 19.3% 2012 2013 2014 2015 Revenue Growth
  • 46. 46 www.frgi.com Performance Trends Improved to Current Record Level Note: Restaurant-level EBITDA Margin excludes pre-opening costs. Company-owned Restaurant Growth Adjusted EBITDA Growth 1.3% 3.1% 1.2% -3.0% 2012 2013 2014 2015 Restaurant-level EBITDA Growth 5.2% 3.1% 11.4% 12.2% 2012 2013 2014 2015 -4.2% 1.7% 26.5% 20.3% 2012 2013 2014 2015 Revenue Growth 5.6% 4.0% 4.1% 5.6% 2012 2013 2014 2015
  • 47. 47 www.frgi.com FY 2015 Financial Results ($s in millions) FY 2014 FY 2015 % Growth Restaurant Sales $608.5 $684.6 Franchise Revenues $2.6 $2.8 Total Revenues $611.1 $687.4 12.5% Restaurant-level EBITDA $133.2 $151.2 13.5% % Restaurant Sales 21.9% 22.1% Adjusted Net Income $35.7 $40.8 14.3% % Revenues 5.8% 5.9% Adjusted Diluted EPS $1.33 $1.52 14.3%
  • 48. 48 www.frgi.com Leverage and Liquidity $150M revolving credit facility (currently, LIBOR + 150 bps) through 2018 • As of the end of FY 2015, available borrowing capacity of $73.5M Repurchased $200M, 8.875% Notes in Q4 2013 • Refinancing including $135M equity offering net proceeds • New Capital Structure Contributed ~ 25% EPS Growth in 2014 ($s in millions) FY 2012 FY 2013 FY 2014 FY 2015 Senior Secured Second Lien Notes $200.0 - - - Senior Secured Credit Facility - $71.0 $66.0 $71.0 Capital Leases $1.0 $1.4 $1.3 $1.7 Lease Financing Obligations $3.0 $1.7 $1.7 $1.7 Total Debt $204.0 $74.0 $69.0 $74.3 Less: Cash and Cash Equivalents $15.5 $11.0 $5.1 $5.3 Total Net Debt $188.5 $63.0 $63.9 $69.1 Total Adjusted EBITDA $64.2 $69.8 $85.7 $99.0 Total Net Debt / Total Adjusted EBITDA 2.9x 0.9x 0.7x 0.7x
  • 49. 49 www.frgi.com Focused Capital Allocation New Restaurant Development Focused on Pollo Tropical Continued Reimaging Initiative at Pollo Tropical, ~ 15 in 2016 Ongoing Strategic Investments to Optimize Restaurant Management, Guest Experience and Infrastructure
  • 50. 50 www.frgi.com 2016 Operating Targets Cost of Sales Improvement, as a % of Sales, Approximately 100 bps at TC and 180 bps at PT Effective Tax Rate of 36% to 37% Depreciation and Amortization Expense of Approximately $36 million to $38 million SSS At Least Low Single Digit at Both Brands Company-owned Restaurant Openings of 40 to 44 Capital Expenditures of $95 million to $110 million
  • 52. 52 www.frgi.com Commodity Cost Overview The Company Contracts Commodities With Some Suppliers 2016 Projected Consolidate Commodity Decrease ~ Low Single Digits 2016 Commodities Under Fixed Pricing By Year End ~ 70%-80% COGS Top 5 Food Purchases – 2016F Top 5 Food Purchases – 2016F
  • 53. 53 www.frgi.com Franchising Franchise Locations Bahamas.................... Honduras .................... Guatemala.................. Panama....................... Puerto Rico ................. Trinidad and Tobago … Venezuela................... United States………….. 1 3 1 5 17 2 11 1 • Current focus is U.S. non-traditional franchising (universities and airports) - Currently, 5 Pollo and 2 Taco locations • International franchise locations are Pollo Tropical restaurants • We have one traditional Taco franchisee in Albuquerque, NM with 4 restaurants • Franchise revenues are not meaningful today, <1% of total revenues • Franchise expansion anticipated to be a growth platform in the future
  • 54. 54 www.frgi.com Total Adjusted EBITDA Reconciliation ($s in millions) FY2012 FY2013 FY2014 FY2015 Restaurant-level Adjusted EBITDA Excluding Pre-Opening Costs: Pollo Tropical 58.2$ 67.8$ 79.0$ 90.4$ Taco Cabana 47.2 48.7 54.2 60.8 Consolidated 105.4$ 116.5$ 133.2$ 151.2$ Less: Pre-Opening Costs 1.7 2.8 4.1 4.6 Restaurant-level Adjusted EBITDA: Pollo Tropical 57.1 65.7 75.6 86.1 Taco Cabana 46.6 48.0 53.5 60.6 Consolidated 103.7$ 113.7$ 129.1$ 146.6$ Add: Franchise Royalty Revenues and Fees 2.4 2.4 2.6 2.8 Less: General and Administrative (Excluding Stock-based Compensation) 41.8 46.2 46.0 50.4 Adjusted EBITDA Pollo Tropical 38.6 43.7 52.7 59.3 Taco Cabana 25.6 26.1 33.0 39.7 Consolidated 64.2$ 69.8$ 85.7$ 99.0$ Less: Depreciation and Amortization 18.3 20.4 23.0 30.6 Impairment and Other Lease Charges 7.0 0.2 0.4 2.4 Interest Expense 24.4 18.0 2.2 1.9 Loss on Extinguishment of Debt - 16.4 - - Provision for Income Taxes 4.3 3.8 21.0 22.0 Stock-Based Compensation 2.0 2.3 3.5 4.3 Other Expense / (Gain) (0.1) (0.6) (0.6) (0.7) Net Income 8.3$ 9.3$ 36.2$ 38.5$
  • 55. 55 www.frgi.com Adjusted EBITDA Reconciliation ($s in millions) FY2012 FY2013 FY2014 FY2015 Restaurant Sales 227.4$ 257.8$ 305.4$ 364.5$ Less: Cost of Sales 75.4 85.5 100.5 121.7 Restaurant Wages and Related Expenses 53.6 57.9 67.5 81.6 Restaurant Rent Expense 7.7 10.1 12.5 16.0 Other Restaurant Operating Expenses 26.8 30.8 38.3 45.4 Advertising Expense 5.7 5.7 7.7 9.5 Restaurant-Level Adjusted EBITDA Excluding Pre-Opening Costs 58.2$ 67.8$ 79.0$ 90.4$ Less: Pre-Opening Costs 1.1 2.0 3.4 4.3 Restaurant-Level Adjusted EBITDA 57.1$ 65.7$ 75.6$ 86.1$ Add: Franchise Revenue 1.9 1.9 2.1 2.2 Less: General and Administrative Expenses 20.4 23.9 24.9 28.9 Adjusted EBITDA 38.6$ 43.7$ 52.7$ 59.3$
  • 56. 56 www.frgi.com Adjusted EBITDA Reconciliation Restaurant Sales 279.9$ 291.1$ 303.1$ 320.0$ Less: Cost of Sales 88.1 90.6 91.8 95.6 Restaurant Wages and Related Expenses 82.6 85.5 87.6 92.5 Restaurant Rent Expense 13.9 16.7 17.2 17.1 Other Restaurant Operating Expenses 37.0 38.2 40.6 41.9 Advertising Expense 11.1 11.4 11.8 12.1 Restaurant-Level Adjusted EBITDA Excluding Pre-Opening Costs 47.2$ 48.7$ 54.2$ 60.8$ Less: Pre-Opening Costs 0.6 0.7 0.7 0.3 Restaurant-Level Adjusted EBITDA 46.6$ 48.0$ 53.5$ 60.6$ Add: Franchise Revenue 0.5 0.5 0.5 0.6 Less: General and Administrative Expenses 21.4 22.4 21.1 21.5 Adjusted EBITDA 25.6$ 26.1$ 33.0$ 39.7$
  • 57. 57 www.frgi.com Adjusted Net Income Reconciliation (a) Impairment and other lease charges for the twelve months ended December 30, 2012 are primarily related to the closure of five Pollo Tropical restaurants in New Jersey in the first quarter of 2012. Impairment and other lease charges for the twelve months ended January 3, 2016 are primarily related to the suspension of our Cabana Grill concept at the end of fiscal 2015. Impairment and other lease charges for each period are presented net of taxes of $0.9 million, $0.1 million, $0.1 million and $2.4 million for the twelve months ended January 3, 2016, December 28, 2014, December 29, 2013 and December 30, 2012, respectively. (b) Prior to the spin-off from Carrols Restaurant Group, Inc. ("Carrols"), certain sale-leaseback transactions were classified as lease financing transactions because Carrols guaranteed the related lease payments. Effective upon the spin-off, the provisions that previously precluded sale-leaseback accounting were cured or eliminated. As a result, the real property leases entered into in connection with these transactions are now recorded as operating leases. Additionally, in the second quarter of 2012, we exercised purchase options associated with the leases for five restaurant properties also previously accounted for as lease financing obligations and purchased those properties from the lessor. The amount reported as "qualification for sale leaseback accounting" represents the net increase in rent expense, decrease in depreciation expense and decrease in interest expense, that would have impacted net income had the leases been accounted for as operating leases for all periods presented, based on the deferred gain on sale-leaseback transactions calculated at the time of the spin-off, and had the five properties been owned for the full year ended December 30, 2012. Qualification for sale leaseback accounting is shown net of taxes of $0.6 million in the twelve months ended December 30, 2012. This amount is included for comparative purposes only, and may not be indicative of what actual results would have been had the qualification for sale-leaseback accounting treatment of these leases (and the treatment of such leases as operating leases) occurred on the dates described above. (c) Secondary offering expenses for the twelve months ended December 29, 2013 include expenses related to the underwritten secondary public equity offering completed during March 2013 totaling $0.4 million. The Company did not receive any proceeds from the sale of shares in the offering. Secondary offering expenses are presented net of taxes of $0.2 million. (d) The Company recognized a loss on extinguishment of debt of $16.4 million in the fourth quarter of 2013 related to the repurchase and redemption of its Notes. The loss on extinguishment of debt for the twelve months ended December 29, 2013 is presented net of taxes of $5.9 million. (e) Gain on condemnation in 2015 primarily includes a previously deferred gain from a sale-leaseback transaction that was recognized upon termination of the lease. Gain on condemnation in 2014 includes a gain from a condemnation award resulting from an eminent domain proceeding. Gain on condemnation for each period is presented net of taxes of $(0.1) million and $(0.2) million for the twelve months ended January 3, 2016 and December 28, 2014, respectively. (f) Legal settlements and related costs in 2015 include legal fees and other costs, including estimated settlement charges, associated with a class action litigation, and in 2014 include the benefit of a payment received as settlement of a litigation matter. Legal settlements and related costs for each period are presented net of taxes of $0.6 million and $(0.2) million for the twelve months ended January 3, 2016 and December 28, 2014, respectively. (g) Gain on sale of property for each period is presented net of taxes of $(0.2) million and $(0.0) million for the twelve months ended December 29, 2013 and December 30, 2012, respectively. ($s in millions, except per share amounts) $ EPS $ EPS $ EPS $ EPS Net Income 8.3$ 0.35$ 9.3$ 0.39$ 36.2$ 1.35$ 38.5$ 1.44$ Add (each net of tax effect): Impairment and other lease charges (a) 4.6 0.20 0.1 - 0.2 0.01 1.5 0.05 Qualification for sale leaseback accounting (b) 1.2 0.05 - - - - - - Secondary offering expenses (c) - - 0.3 0.01 - - - - Loss on extinguishment of debt (d) - - 10.5 0.44 - - - - Gain on condemnation (e) - - - - (0.3) (0.01) (0.2) (0.01) Legal settlements and related costs (f) - - - - (0.3) (0.01) 1.0 0.04 Gain on sale of property (g) (0.1) - (0.3) (0.01) - - - - Adjusted net income & EPS 14.1$ 0.60$ 19.9$ 0.83$ 35.7$ 1.33$ 40.8$ 1.52$ * Amounts do not add to adjusted total due to rounding FY2012 FY2013 FY2014 FY2015
  • 58. 58 www.frgi.com Use of Non-GAAP Financial Measures Adjusted EBITDA, restaurant-level adjusted EBITDA, and restaurant-level adjusted EBITDA excluding pre-opening costs are all non-GAAP financial measures. Adjusted EBITDA is defined as earnings attributable to the applicable segment before interest, loss on extinguishment of debt, income taxes, depreciation and amortization, impairment and other lease charges, stock-based compensation expense and other income and expense. It includes an allocation of corporate and brand general and administrative expenses (each excluding stock-based compensation). Restaurant-level adjusted EBITDA (excluding pre-opening costs) is defined as Adjusted EBITDA excluding franchise royalty revenues and fees, pre-opening costs and general and administrative expenses. Management believes that such financial measures, when viewed with our results of operations calculated in accordance with GAAP and our reconciliation of restaurant-level adjusted EBITDA and restaurant-level adjusted EBITDA excluding pre-opening costs and adjusted EBITDA to net income (i) provide useful information about our operating performance and period-over-period growth (including at the restaurant level), (ii) provide additional information that is useful for evaluating the operating performance of our business, and (iii) permit investors to gain an understanding of the factors and trends affecting our ongoing earnings, from which capital investments are made and debt is serviced. However, such measures are not measures of financial performance or liquidity under GAAP and, accordingly, should not be considered as alternatives to net income or cash flow from operating activities as indicators of operating performance or liquidity. Also these measures may not be comparable to similarly titled captions of other companies. Adjusted net income and related adjusted earnings per share are non-GAAP financial measures. Adjusted net income is defined as net income before impairment and other lease charges, the impact of the qualification for sale-leaseback accounting (primarily upon the spin-off from Carrols) for certain leases previously accounted for as lease financing obligations, secondary offering expenses, loss on extinguishment of debt, gain on condemnation, legal settlements and related costs and gain on sale of property. Management believes that adjusted net income and related adjusted earnings per diluted share, when viewed with our results of operations calculated in accordance with GAAP (i) provide useful information about our operating performance and period-over-period growth, (ii) provide additional information that is useful for evaluating the operating performance of our business, and (iii) permit investors to gain an understanding of the factors and trends affecting our ongoing earnings, from which capital investments are made and debt is serviced. However, such measures are not measures of financial performance or liquidity under GAAP and, accordingly should not be considered as alternatives to net income or net income per share as indicators of operating performance or liquidity. Also these measures may not be comparable to similarly titled captions of other companies.