Resistance measurement and cfd test on darpa subboff model
1.
NAME – ARIJITBISWAS
ROLL NO- 24NA91R01
PhD 1st
Year Research Scholar
SUB – Self Study Course
Supervised by
Prof Swapnadip De Chowdhury (NA)
Joint supervised by
Prof Nilanjan Das Chakladar (ME)
Resistance of Under Water Vehicle
2.
CONTENTS OF
SLIDES
INTRODUCTION
PHYSICS BEHINDRESISTANCE
RESISITANCE MEASURMENT
ITTC FORMULA
LITERATURE REVIEW
MODELLING
SIMULATIONS
MESHING
VALIDATION
RESULTS ( star CCM+)
OPEN FOAM SETUP
CONCLUSION
GOAL
3.
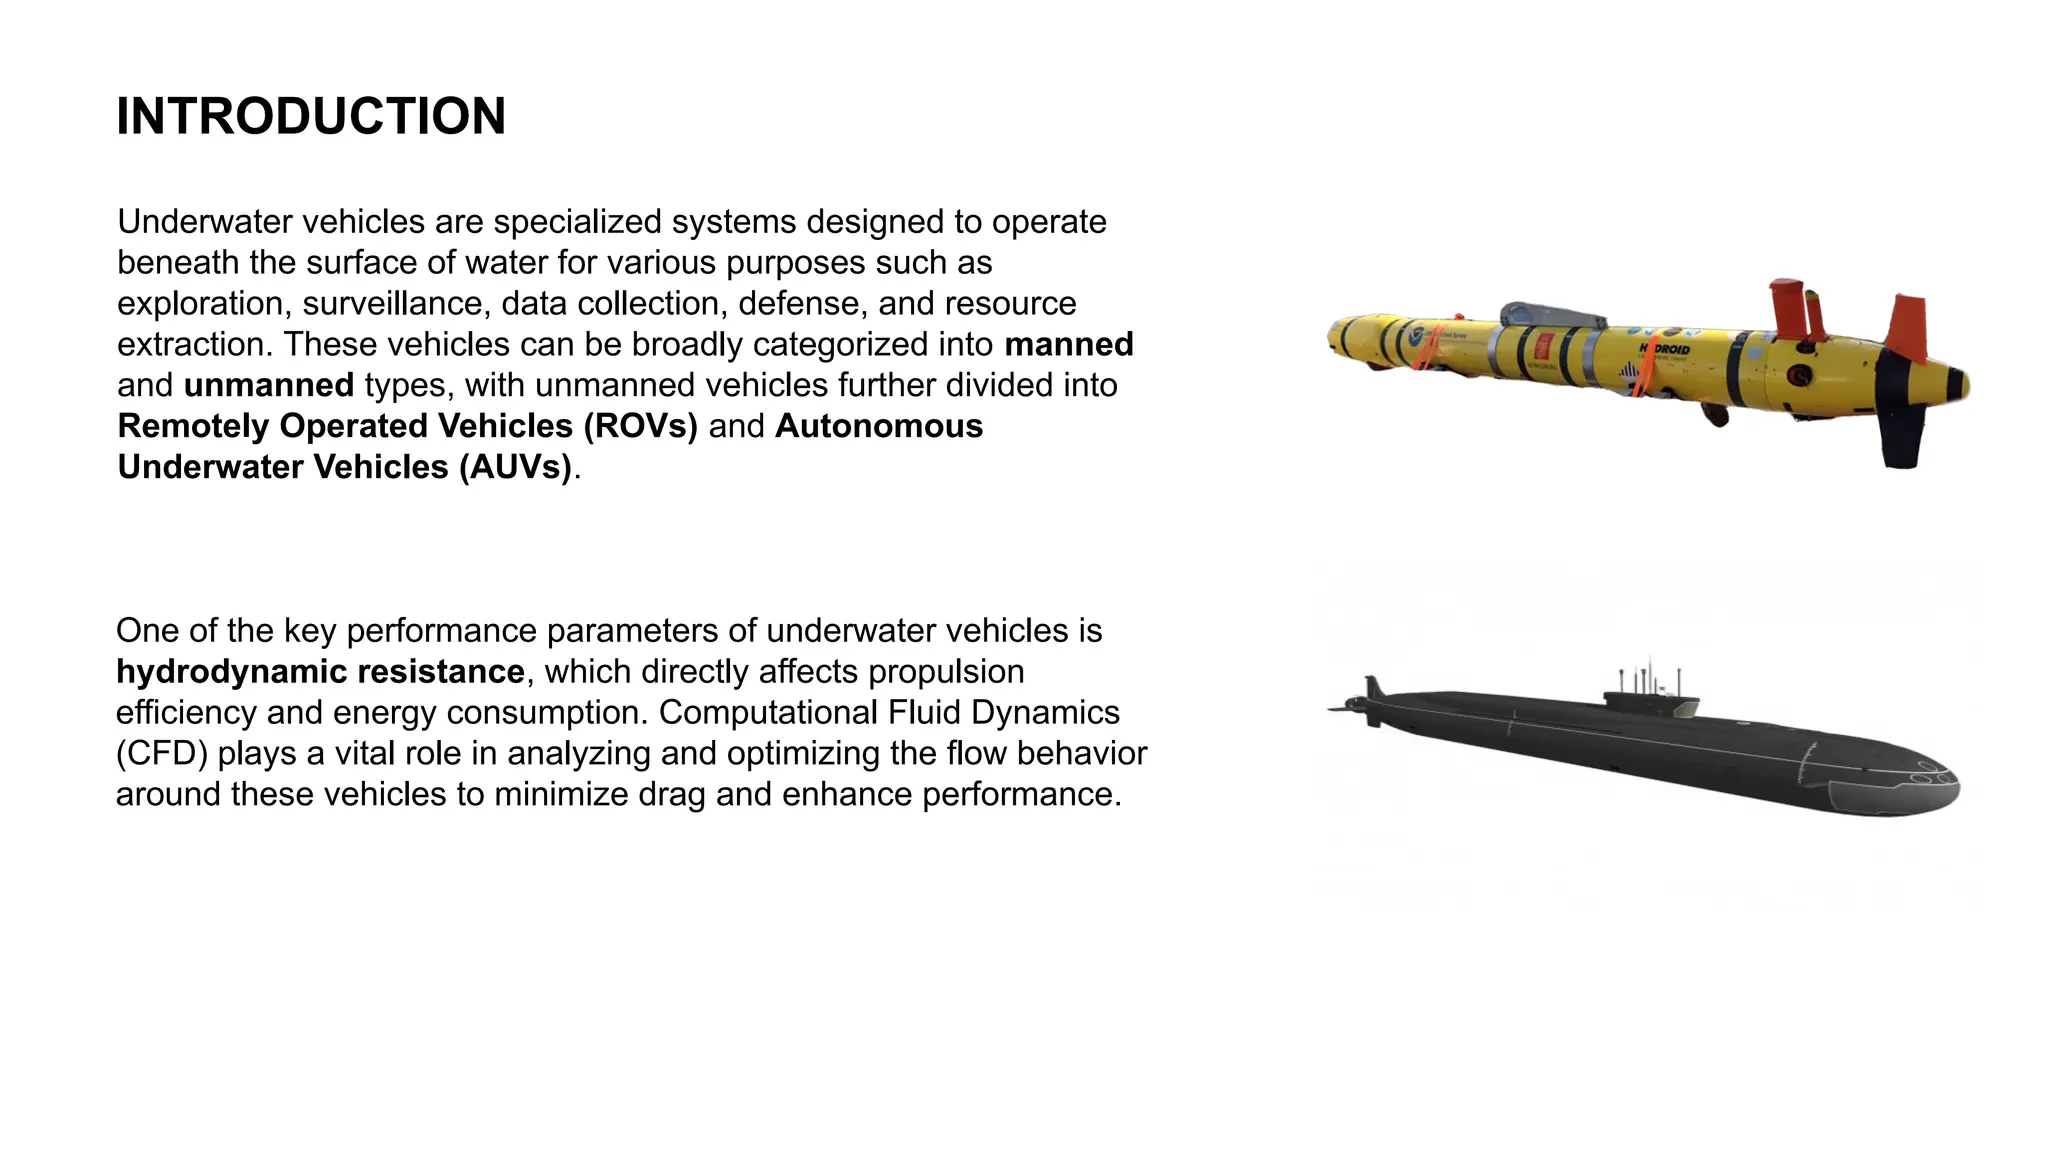
INTRODUCTION
Underwater vehicles arespecialized systems designed to operate
beneath the surface of water for various purposes such as
exploration, surveillance, data collection, defense, and resource
extraction. These vehicles can be broadly categorized into manned
and unmanned types, with unmanned vehicles further divided into
Remotely Operated Vehicles (ROVs) and Autonomous
Underwater Vehicles (AUVs).
One of the key performance parameters of underwater vehicles is
hydrodynamic resistance, which directly affects propulsion
efficiency and energy consumption. Computational Fluid Dynamics
(CFD) plays a vital role in analyzing and optimizing the flow behavior
around these vehicles to minimize drag and enhance performance.
4.
PHYSICS BEHIND RESISTANCE
Whatis resistance? What Stops Things from Moving Freely?
-The word “resistance” comes from the root word “resist”, which means to oppose or stand against something.
So, in the context of motion —
Resistance is the force that tries to stop an object from moving forward.
Where Does Resistance Come From?
Resistance comes from the interaction between a moving object and the surrounding fluid (like water or air). When an object
moves through a fluid, the fluid does not simply move aside — it pushes back. That push-back is resistance, and it comes from
two main sources:
Friction (Viscous Effect)
Pressure Difference (Shape Effect)
Wave-Making (at Free Surface)
Fluid Dynamics Around a Submerged Body
Water flow divides around the hull — creates boundary layer
Stagnation point at the nose, flow separation may occur at aft
Pressure is high at front, low at rear → causes drag
Viscous shear stress acts along hull → friction drag
Near surface? → Wave-making resistance appears
5.
RESISTANCE MEASURMENT
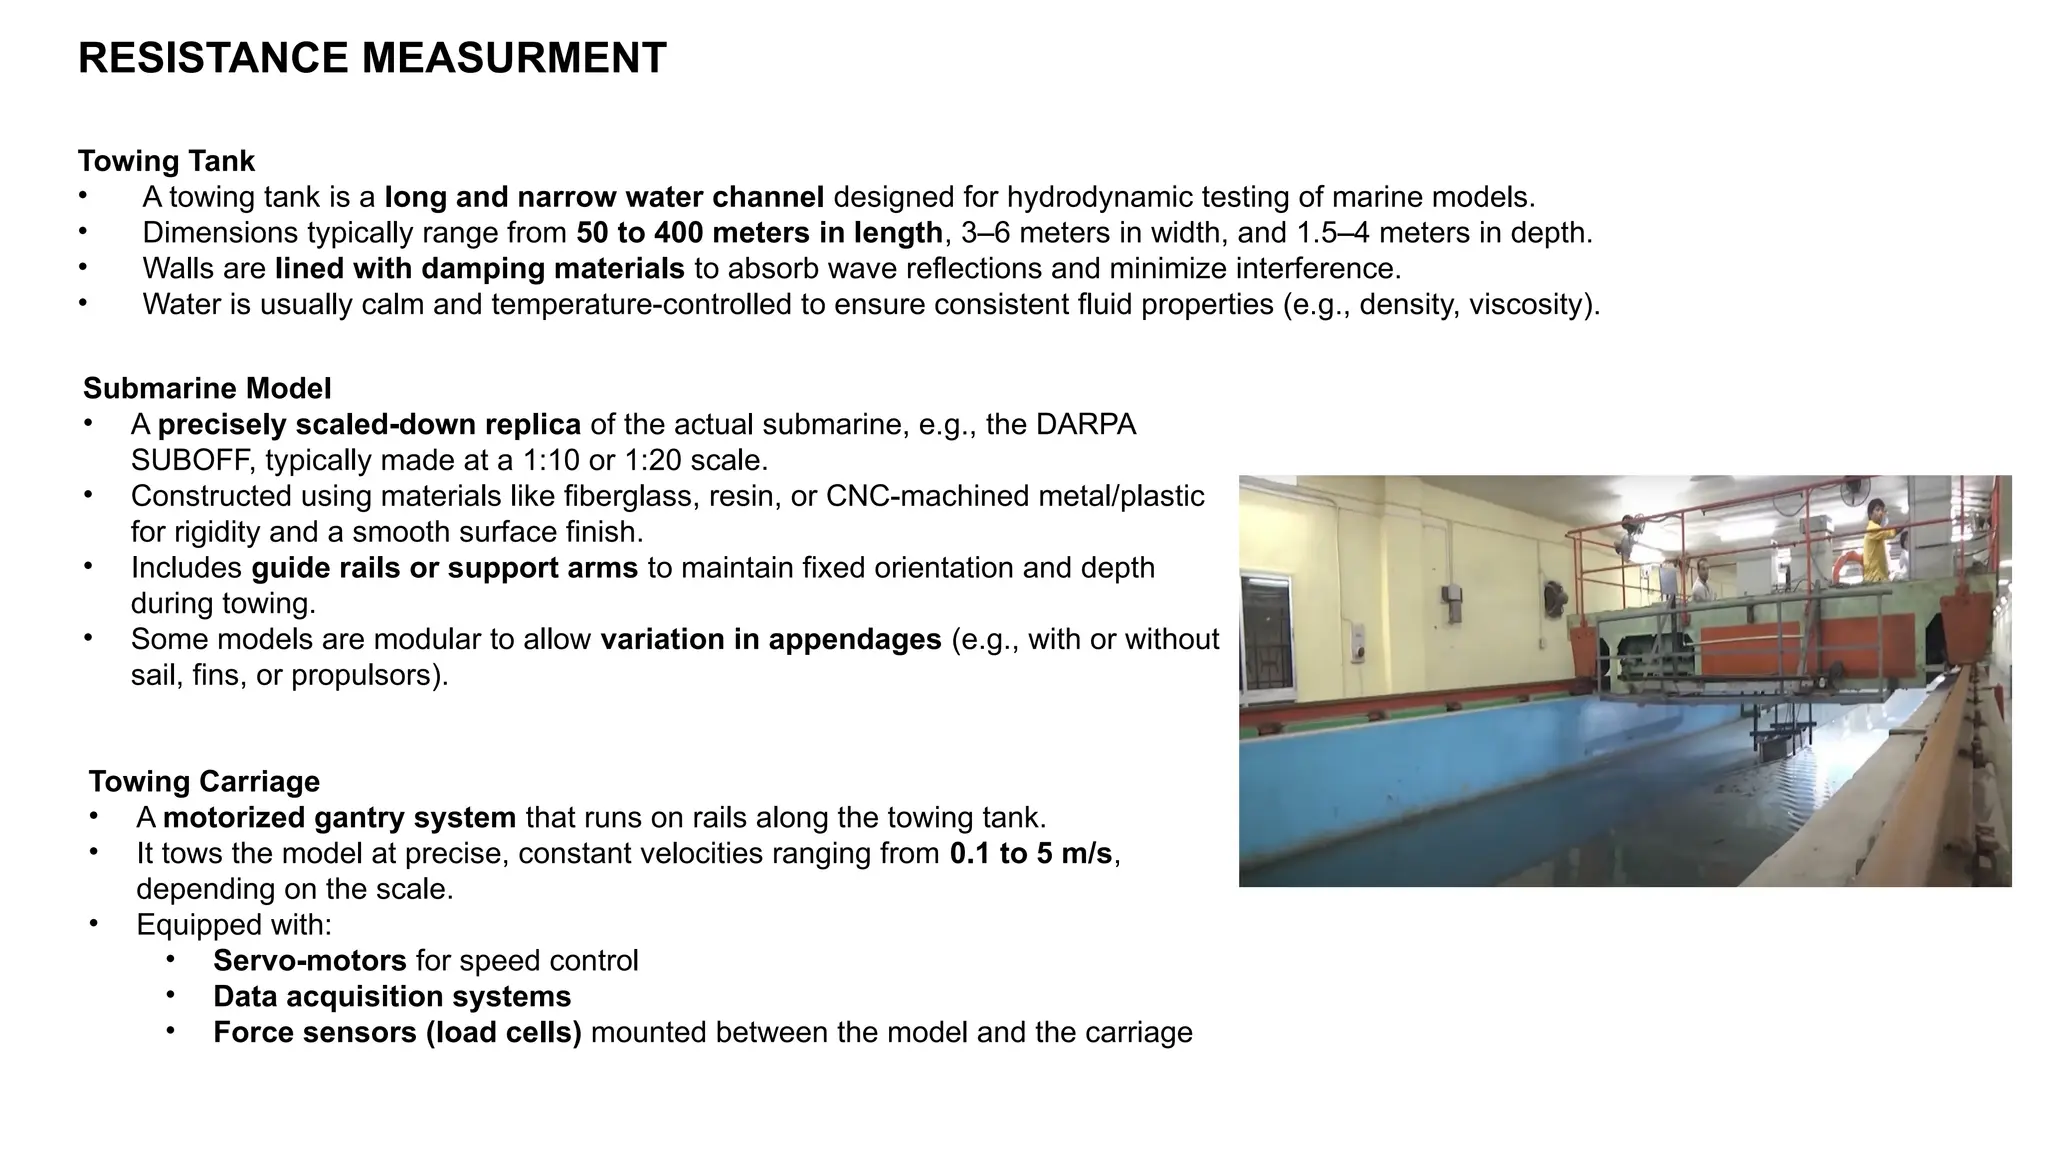
Towing Tank
•A towing tank is a long and narrow water channel designed for hydrodynamic testing of marine models.
• Dimensions typically range from 50 to 400 meters in length, 3–6 meters in width, and 1.5–4 meters in depth.
• Walls are lined with damping materials to absorb wave reflections and minimize interference.
• Water is usually calm and temperature-controlled to ensure consistent fluid properties (e.g., density, viscosity).
Submarine Model
• A precisely scaled-down replica of the actual submarine, e.g., the DARPA
SUBOFF, typically made at a 1:10 or 1:20 scale.
• Constructed using materials like fiberglass, resin, or CNC-machined metal/plastic
for rigidity and a smooth surface finish.
• Includes guide rails or support arms to maintain fixed orientation and depth
during towing.
• Some models are modular to allow variation in appendages (e.g., with or without
sail, fins, or propulsors).
Towing Carriage
• A motorized gantry system that runs on rails along the towing tank.
• It tows the model at precise, constant velocities ranging from 0.1 to 5 m/s,
depending on the scale.
• Equipped with:
• Servo-motors for speed control
• Data acquisition systems
• Force sensors (load cells) mounted between the model and the carriage
6.
RESISTANCE MEASURMENT
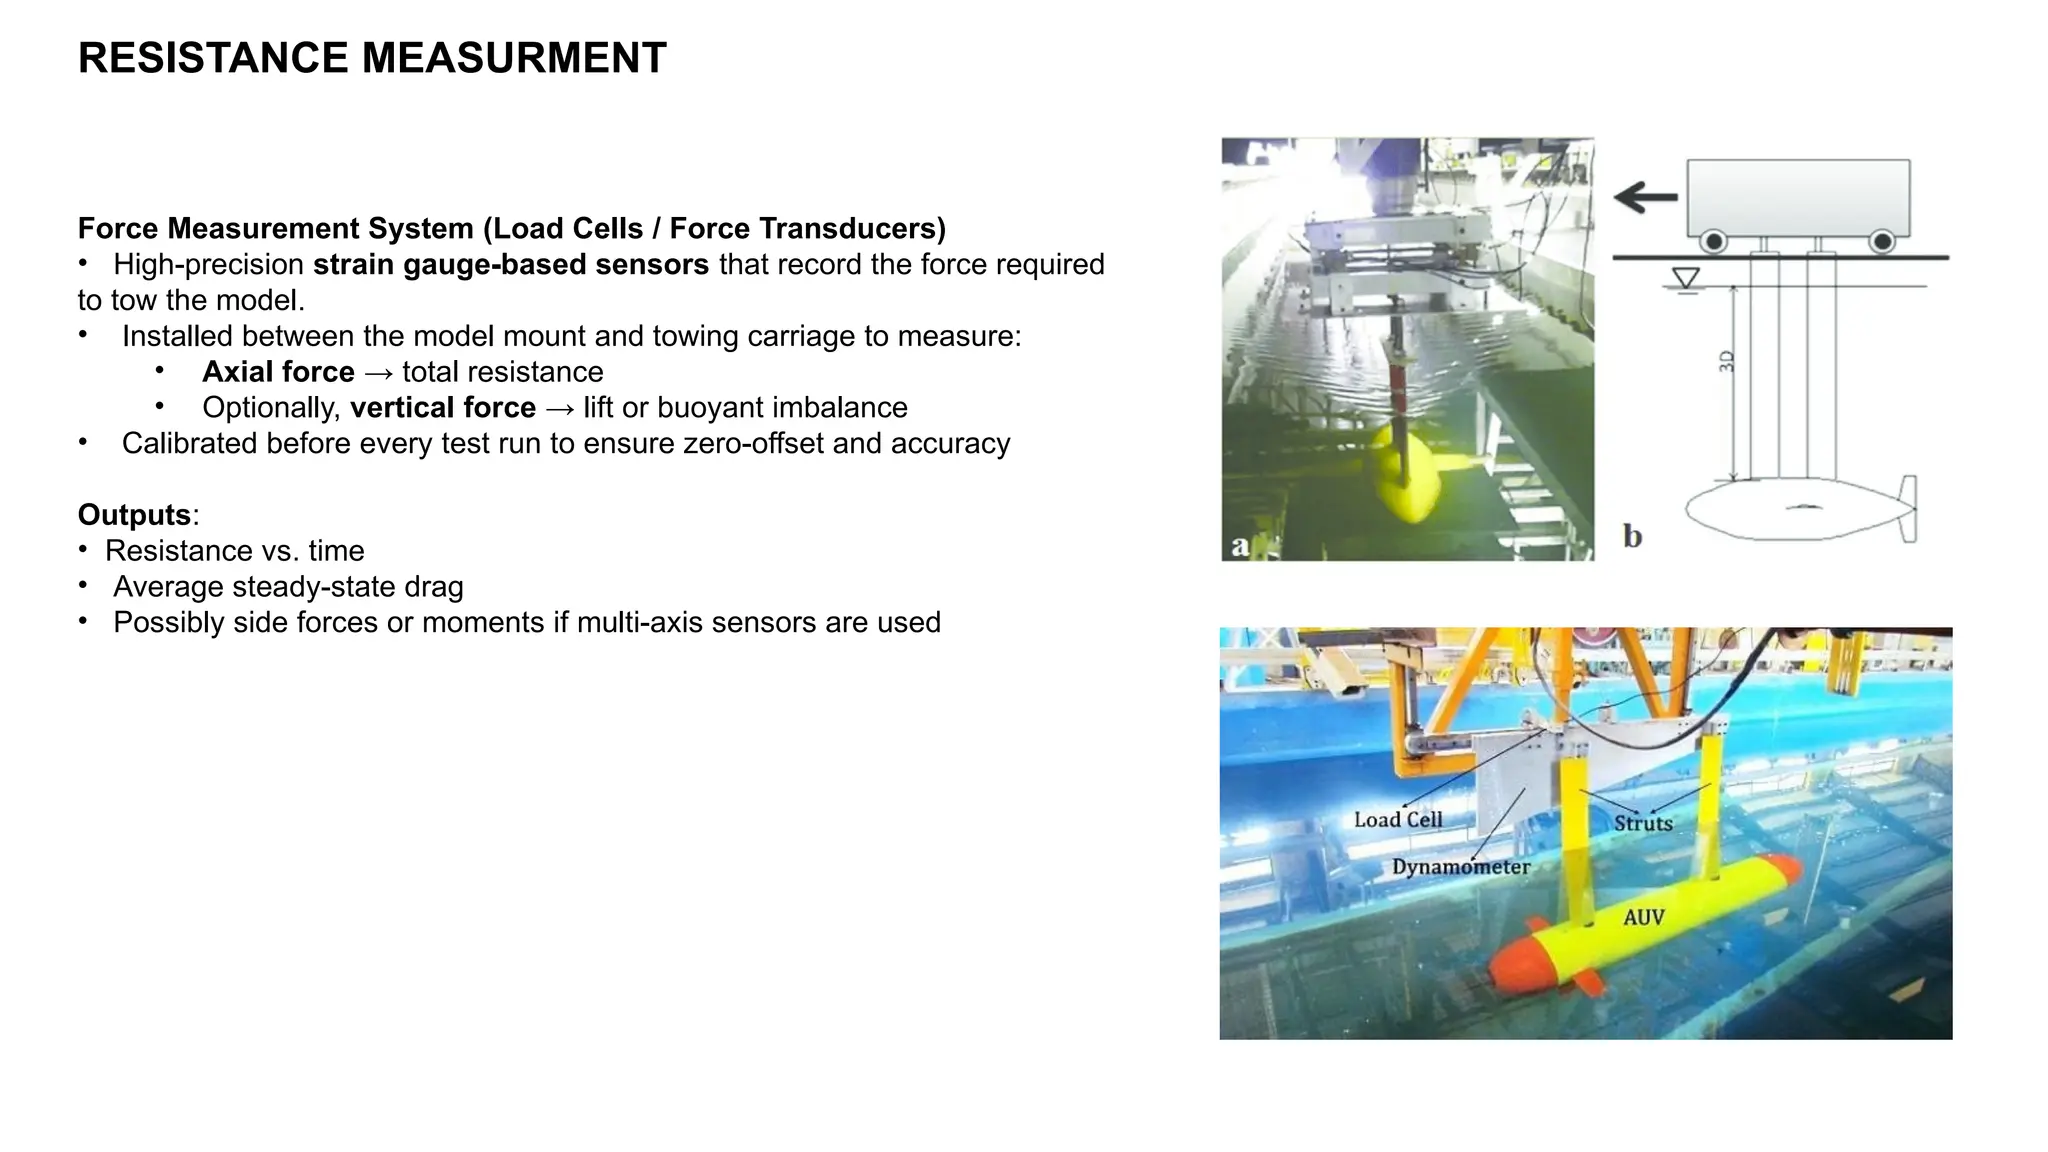
Force MeasurementSystem (Load Cells / Force Transducers)
• High-precision strain gauge-based sensors that record the force required
to tow the model.
• Installed between the model mount and towing carriage to measure:
• Axial force → total resistance
• Optionally, vertical force → lift or buoyant imbalance
• Calibrated before every test run to ensure zero-offset and accuracy
Outputs:
• Resistance vs. time
• Average steady-state drag
• Possibly side forces or moments if multi-axis sensors are used
LITERATURE REVIEW
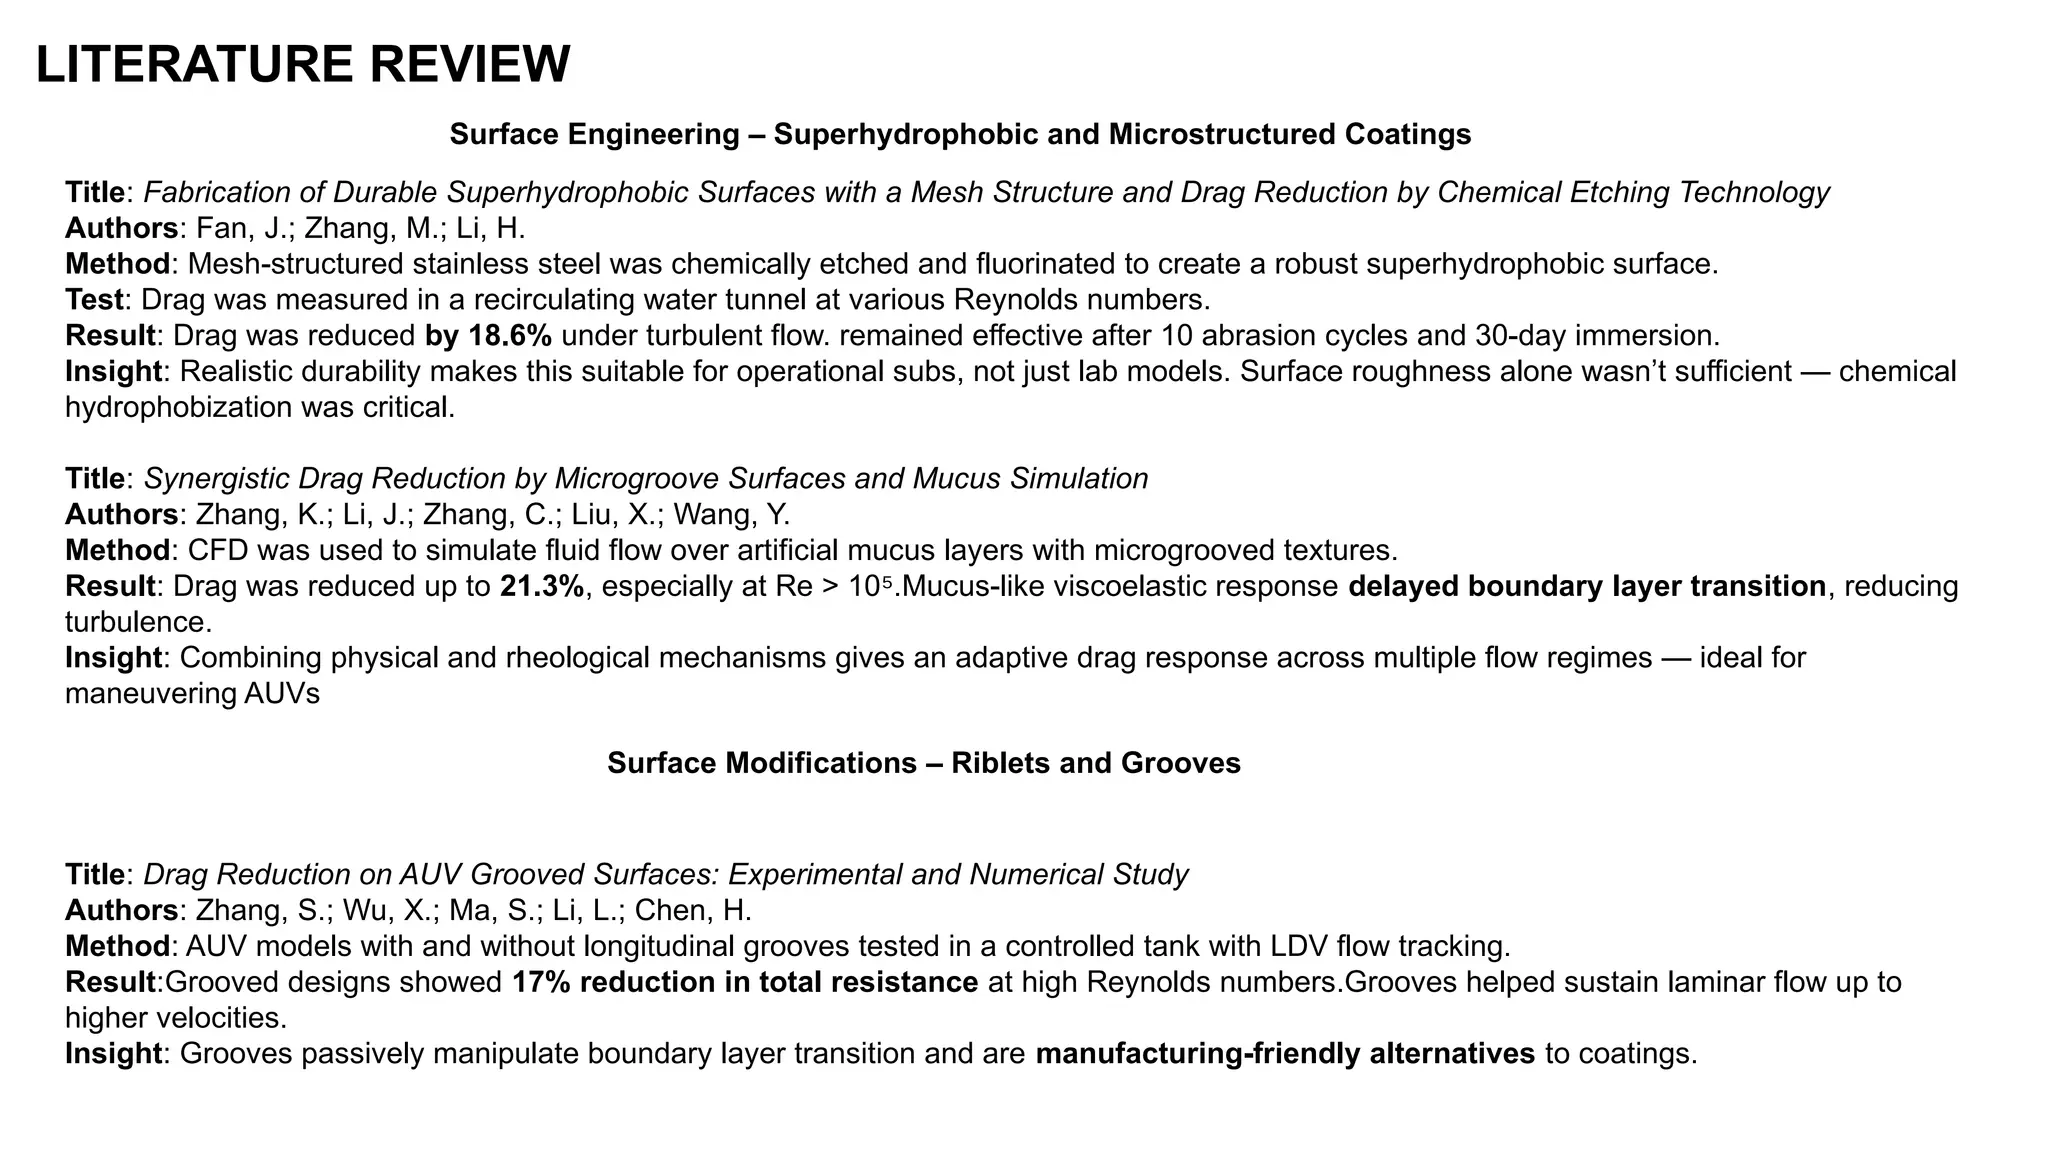
Title: Fabricationof Durable Superhydrophobic Surfaces with a Mesh Structure and Drag Reduction by Chemical Etching Technology
Authors: Fan, J.; Zhang, M.; Li, H.
Method: Mesh-structured stainless steel was chemically etched and fluorinated to create a robust superhydrophobic surface.
Test: Drag was measured in a recirculating water tunnel at various Reynolds numbers.
Result: Drag was reduced by 18.6% under turbulent flow. remained effective after 10 abrasion cycles and 30-day immersion.
Insight: Realistic durability makes this suitable for operational subs, not just lab models. Surface roughness alone wasn’t sufficient — chemical
hydrophobization was critical.
Title: Synergistic Drag Reduction by Microgroove Surfaces and Mucus Simulation
Authors: Zhang, K.; Li, J.; Zhang, C.; Liu, X.; Wang, Y.
Method: CFD was used to simulate fluid flow over artificial mucus layers with microgrooved textures.
Result: Drag was reduced up to 21.3%, especially at Re > 10 .Mucus-like viscoelastic response
⁵ delayed boundary layer transition, reducing
turbulence.
Insight: Combining physical and rheological mechanisms gives an adaptive drag response across multiple flow regimes — ideal for
maneuvering AUVs
Surface Engineering – Superhydrophobic and Microstructured Coatings
Surface Modifications – Riblets and Grooves
Title: Drag Reduction on AUV Grooved Surfaces: Experimental and Numerical Study
Authors: Zhang, S.; Wu, X.; Ma, S.; Li, L.; Chen, H.
Method: AUV models with and without longitudinal grooves tested in a controlled tank with LDV flow tracking.
Result:Grooved designs showed 17% reduction in total resistance at high Reynolds numbers.Grooves helped sustain laminar flow up to
higher velocities.
Insight: Grooves passively manipulate boundary layer transition and are manufacturing-friendly alternatives to coatings.
9.
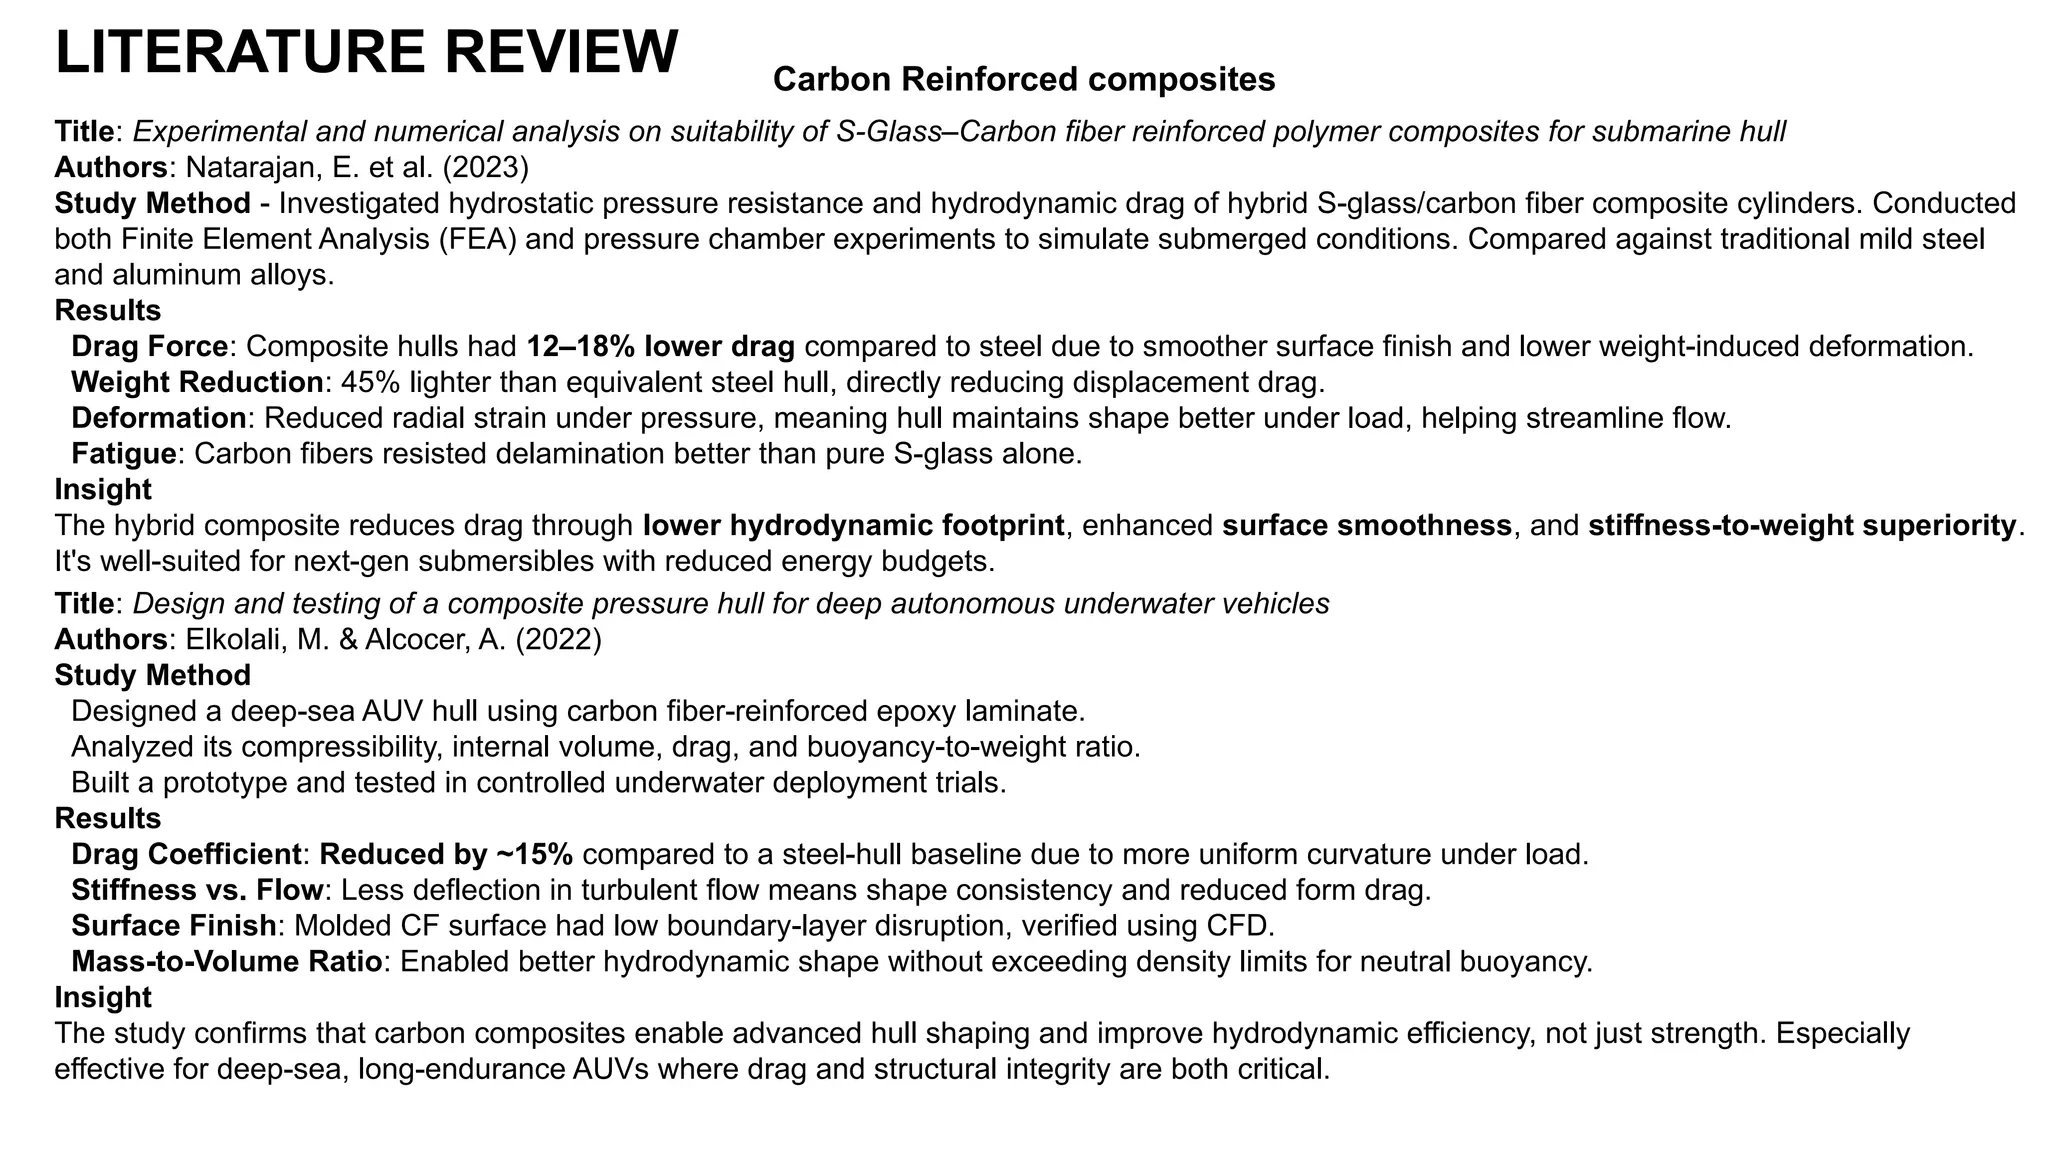
Title: Experimental andnumerical analysis on suitability of S-Glass–Carbon fiber reinforced polymer composites for submarine hull
Authors: Natarajan, E. et al. (2023)
Study Method - Investigated hydrostatic pressure resistance and hydrodynamic drag of hybrid S-glass/carbon fiber composite cylinders. Conducted
both Finite Element Analysis (FEA) and pressure chamber experiments to simulate submerged conditions. Compared against traditional mild steel
and aluminum alloys.
Results
Drag Force: Composite hulls had 12–18% lower drag compared to steel due to smoother surface finish and lower weight-induced deformation.
Weight Reduction: 45% lighter than equivalent steel hull, directly reducing displacement drag.
Deformation: Reduced radial strain under pressure, meaning hull maintains shape better under load, helping streamline flow.
Fatigue: Carbon fibers resisted delamination better than pure S-glass alone.
Insight
The hybrid composite reduces drag through lower hydrodynamic footprint, enhanced surface smoothness, and stiffness-to-weight superiority.
It's well-suited for next-gen submersibles with reduced energy budgets.
Title: Design and testing of a composite pressure hull for deep autonomous underwater vehicles
Authors: Elkolali, M. & Alcocer, A. (2022)
Study Method
Designed a deep-sea AUV hull using carbon fiber-reinforced epoxy laminate.
Analyzed its compressibility, internal volume, drag, and buoyancy-to-weight ratio.
Built a prototype and tested in controlled underwater deployment trials.
Results
Drag Coefficient: Reduced by ~15% compared to a steel-hull baseline due to more uniform curvature under load.
Stiffness vs. Flow: Less deflection in turbulent flow means shape consistency and reduced form drag.
Surface Finish: Molded CF surface had low boundary-layer disruption, verified using CFD.
Mass-to-Volume Ratio: Enabled better hydrodynamic shape without exceeding density limits for neutral buoyancy.
Insight
The study confirms that carbon composites enable advanced hull shaping and improve hydrodynamic efficiency, not just strength. Especially
effective for deep-sea, long-endurance AUVs where drag and structural integrity are both critical.
LITERATURE REVIEW Carbon Reinforced composites
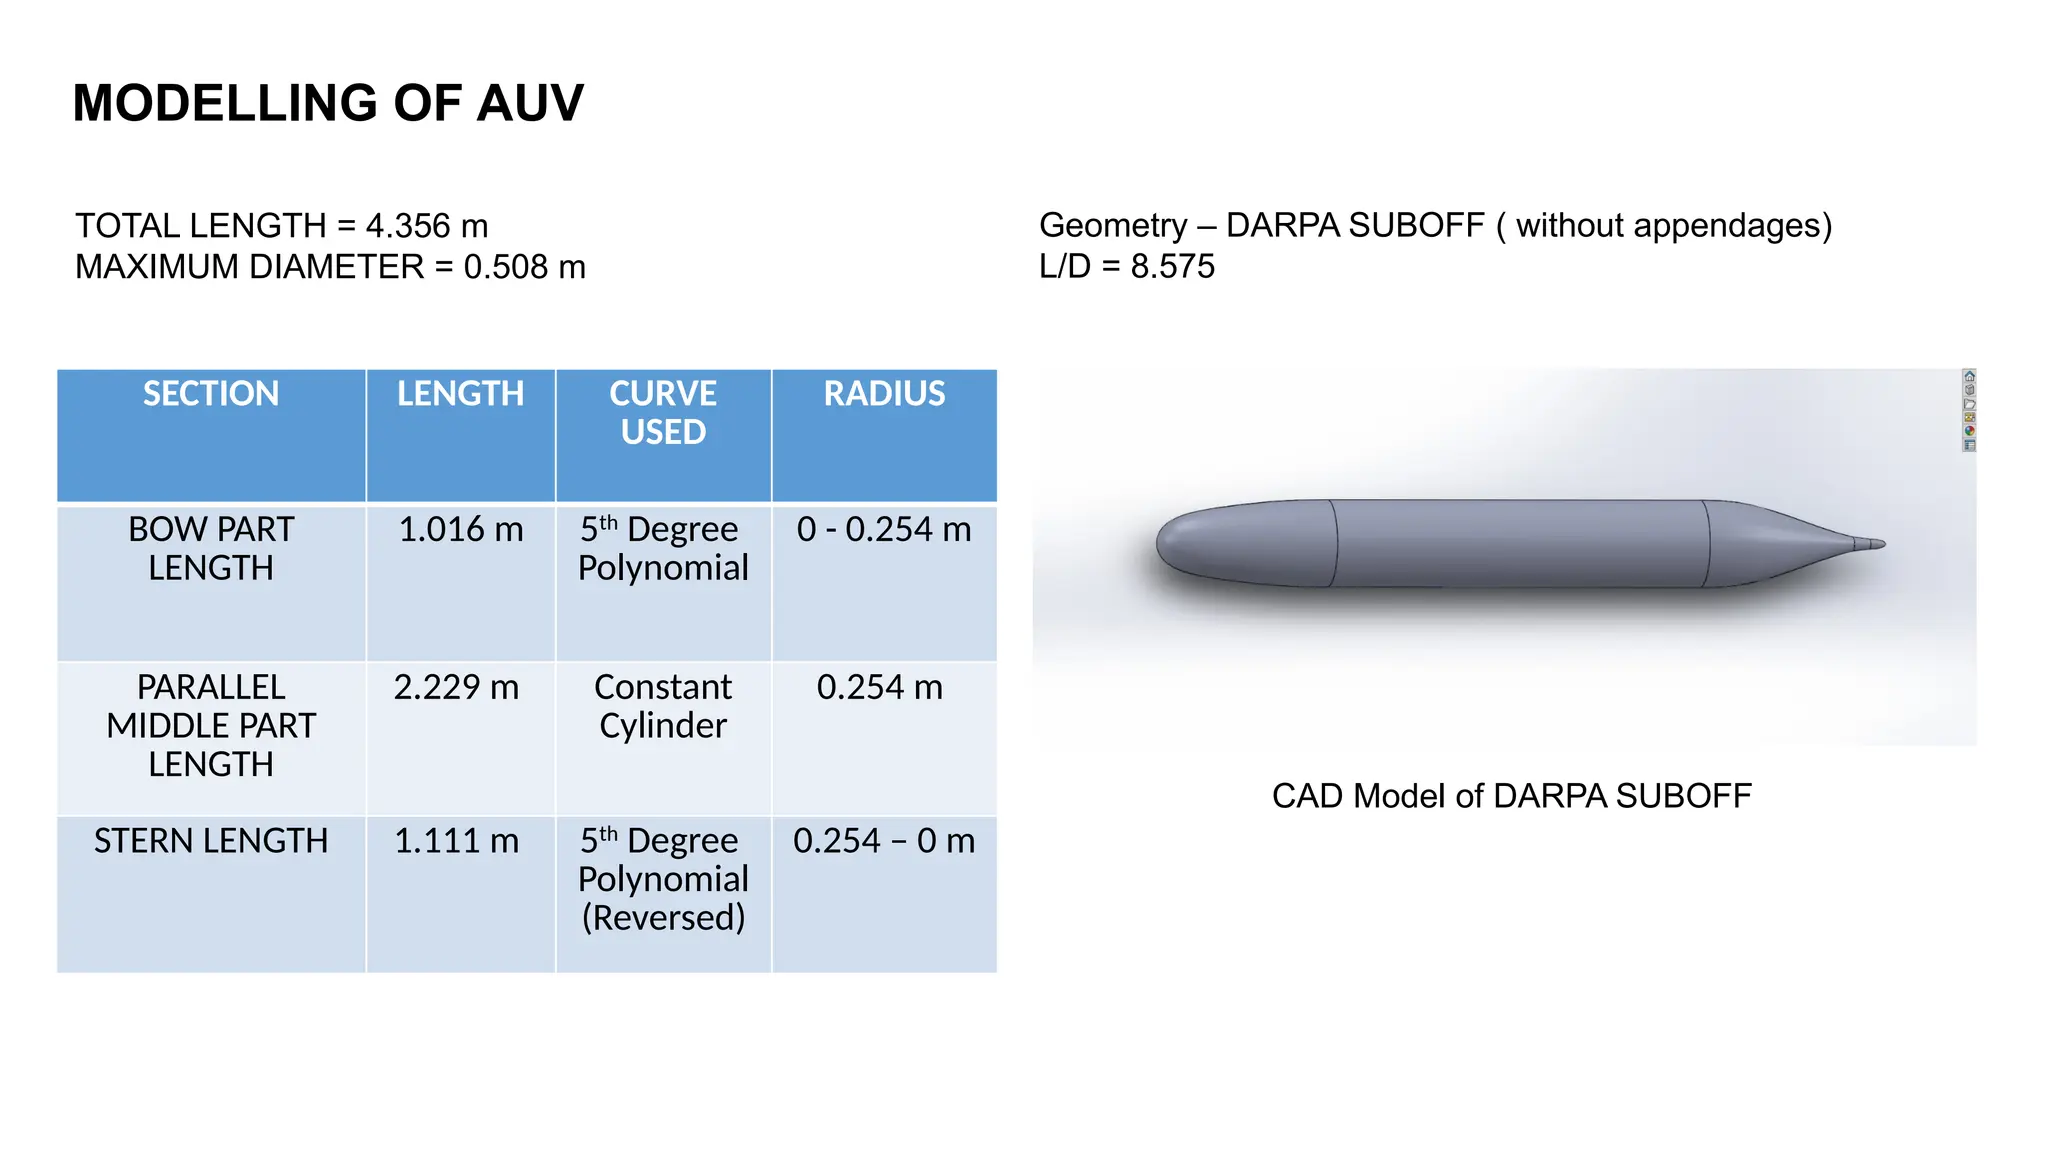
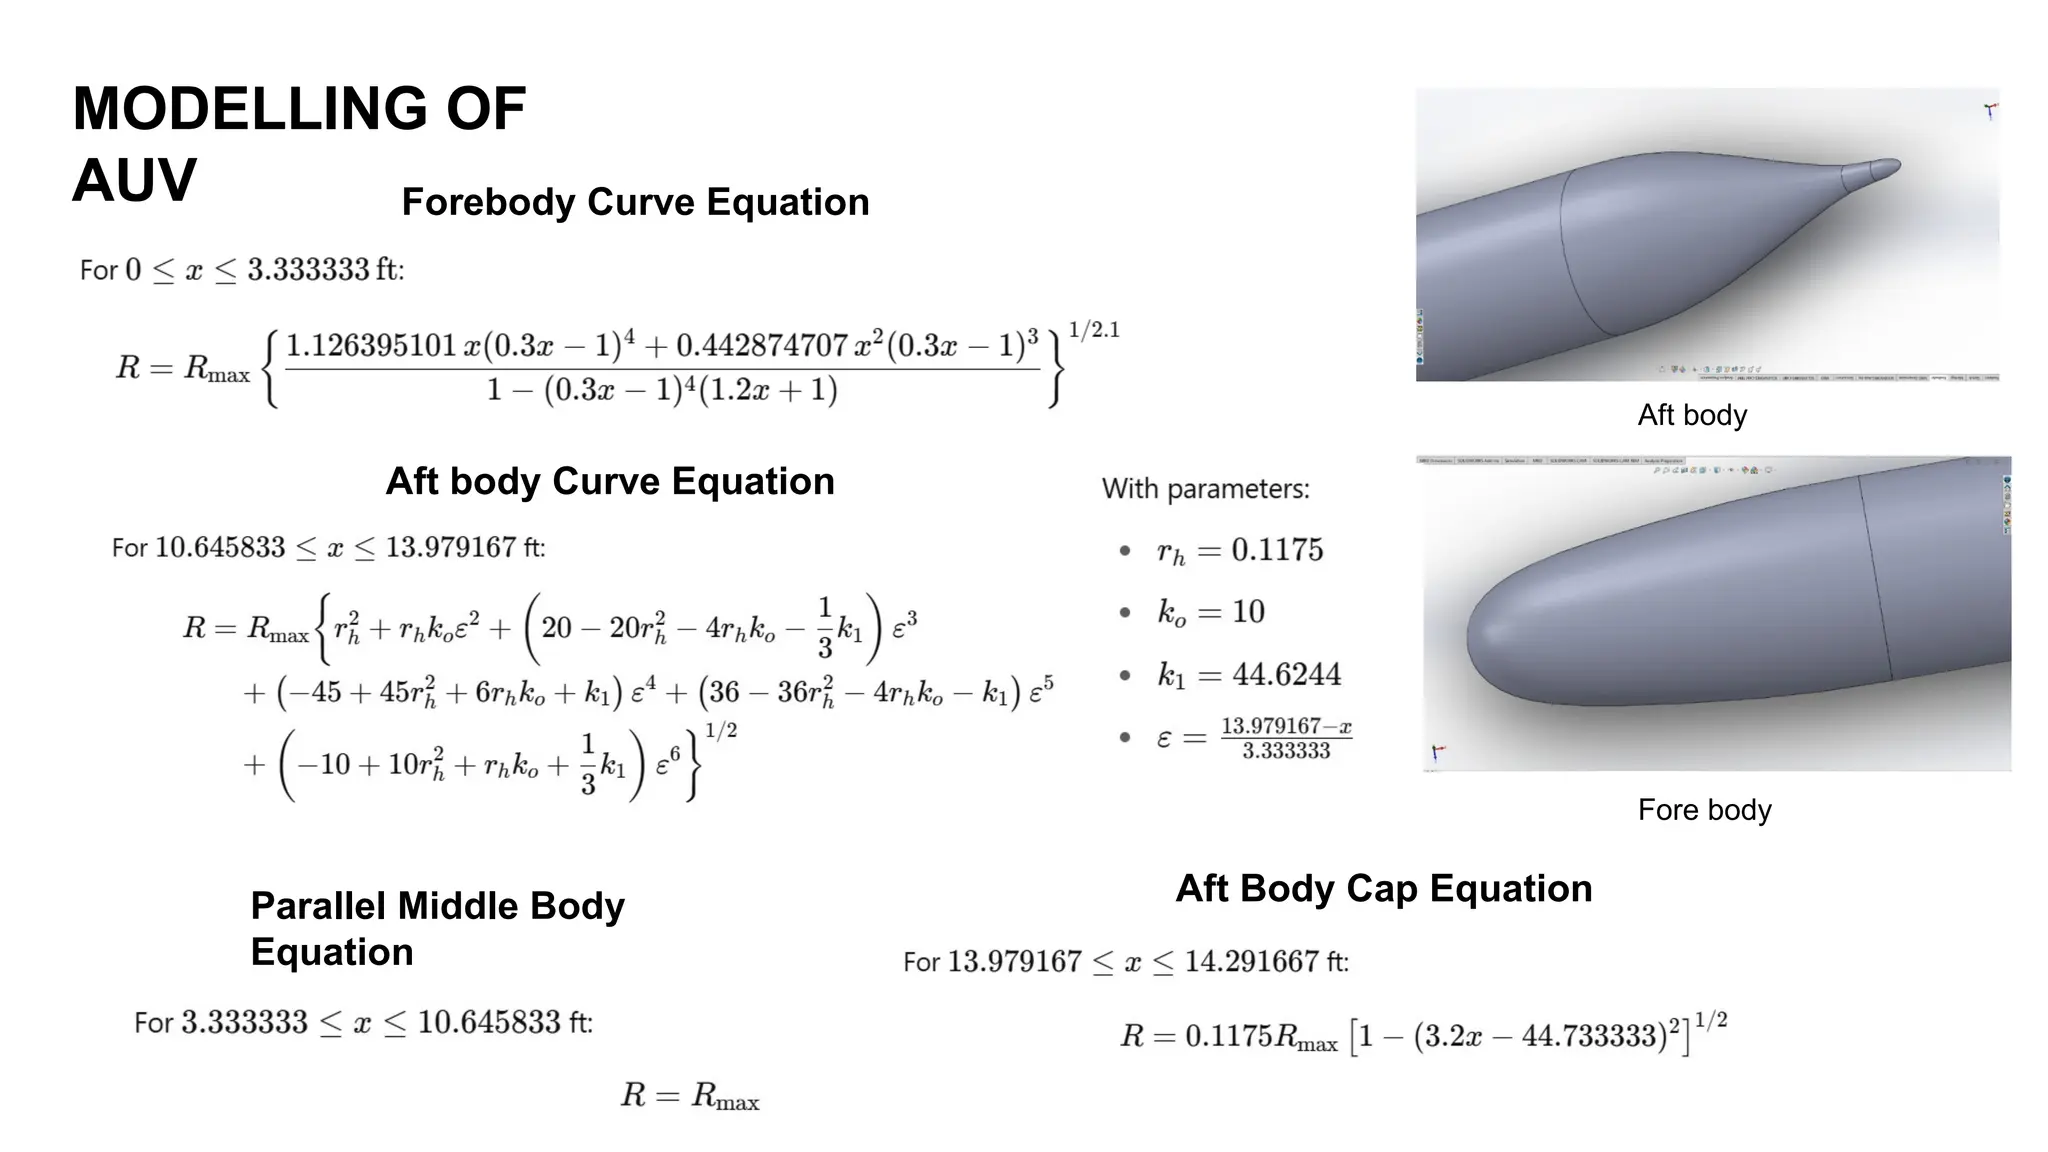
MODELLING OF AUV
Geometry– DARPA SUBOFF ( without appendages)
L/D = 8.575
SECTION LENGTH CURVE
USED
RADIUS
BOW PART
LENGTH
1.016 m 5th
Degree
Polynomial
0 - 0.254 m
PARALLEL
MIDDLE PART
LENGTH
2.229 m Constant
Cylinder
0.254 m
STERN LENGTH 1.111 m 5th
Degree
Polynomial
(Reversed)
0.254 – 0 m
CAD Model of DARPA SUBOFF
TOTAL LENGTH = 4.356 m
MAXIMUM DIAMETER = 0.508 m
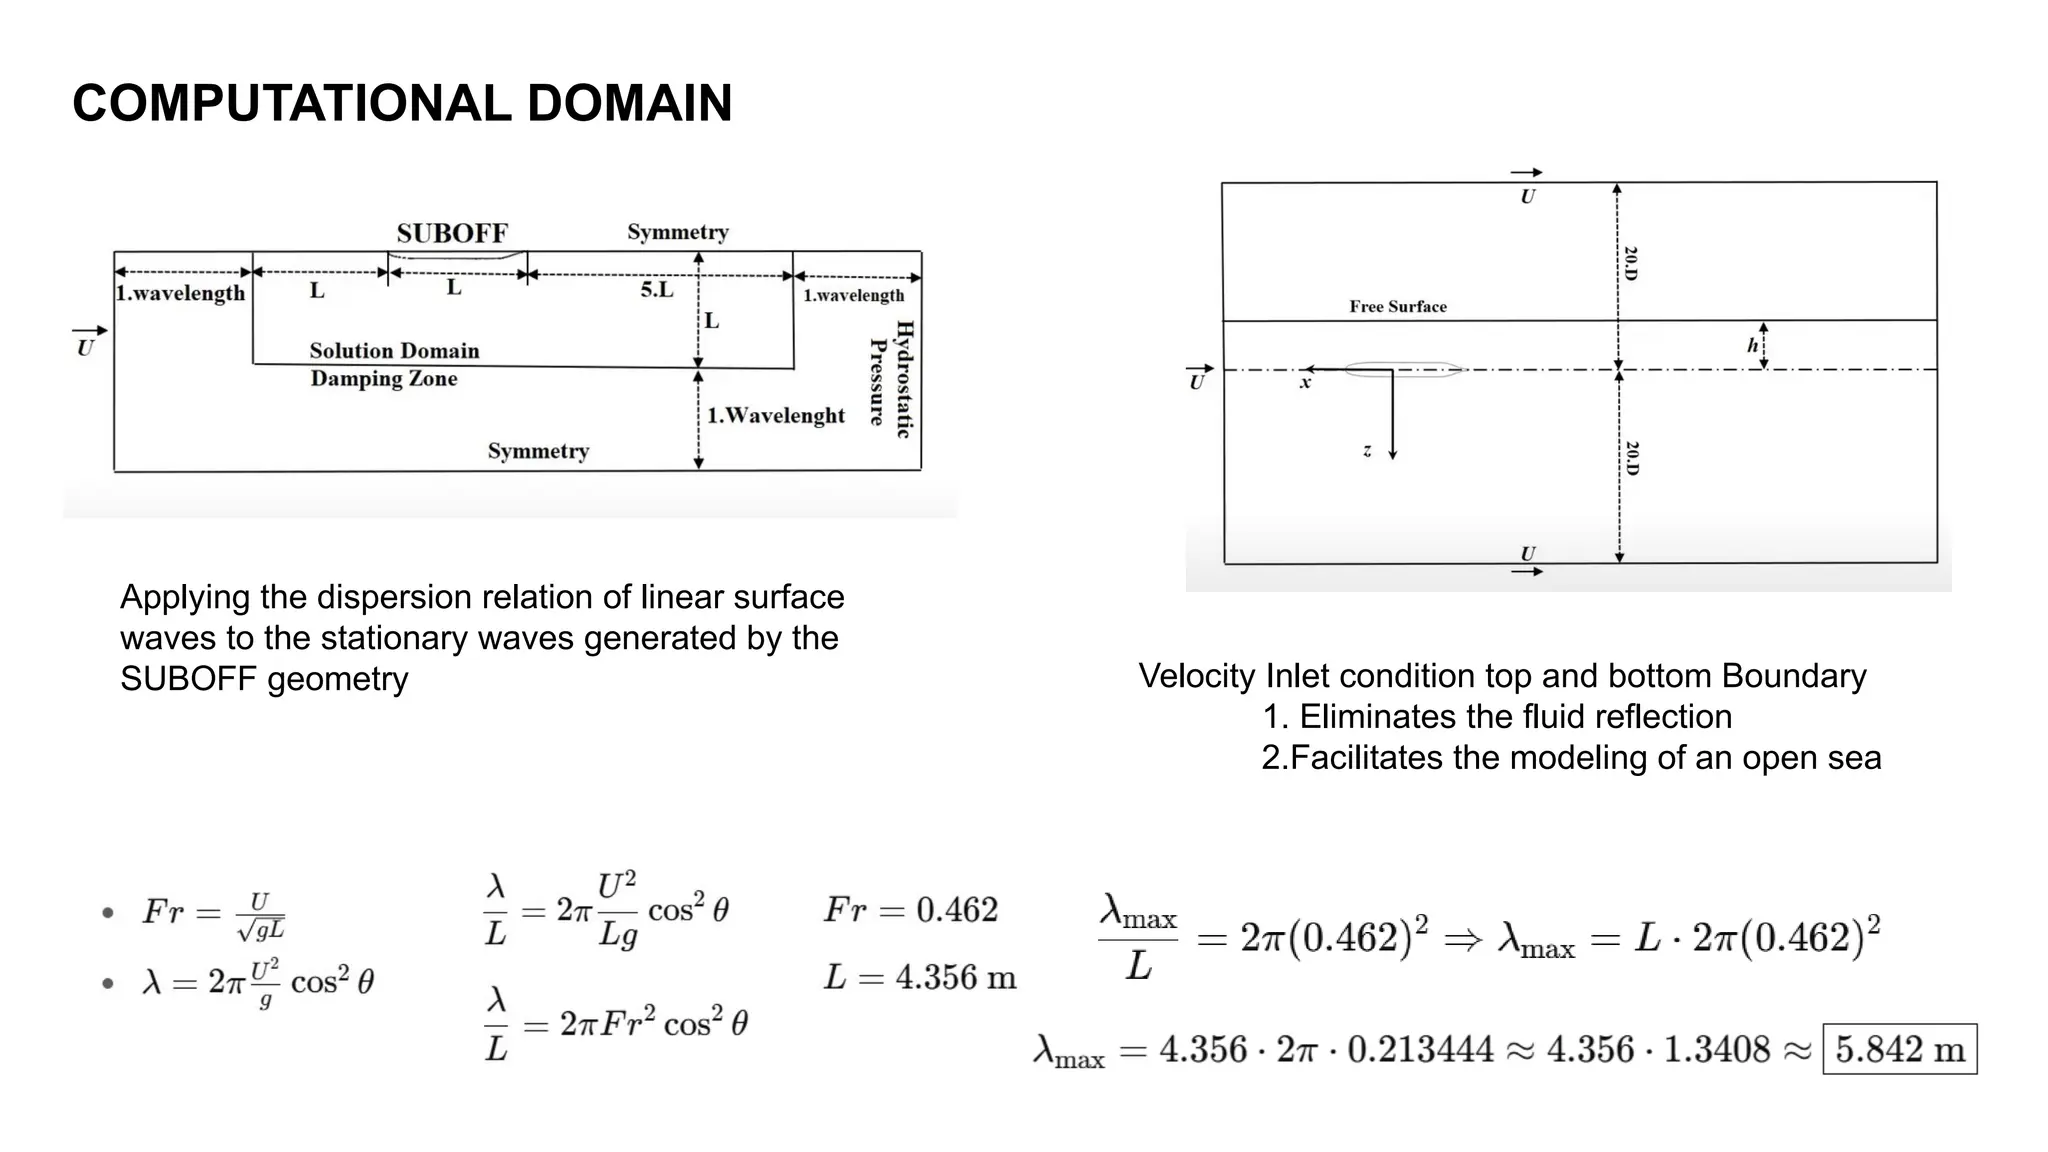
COMPUTATIONAL DOMAIN
Velocity Inletcondition top and bottom Boundary
1. Eliminates the fluid reflection
2.Facilitates the modeling of an open sea
Applying the dispersion relation of linear surface
waves to the stationary waves generated by the
SUBOFF geometry
14.
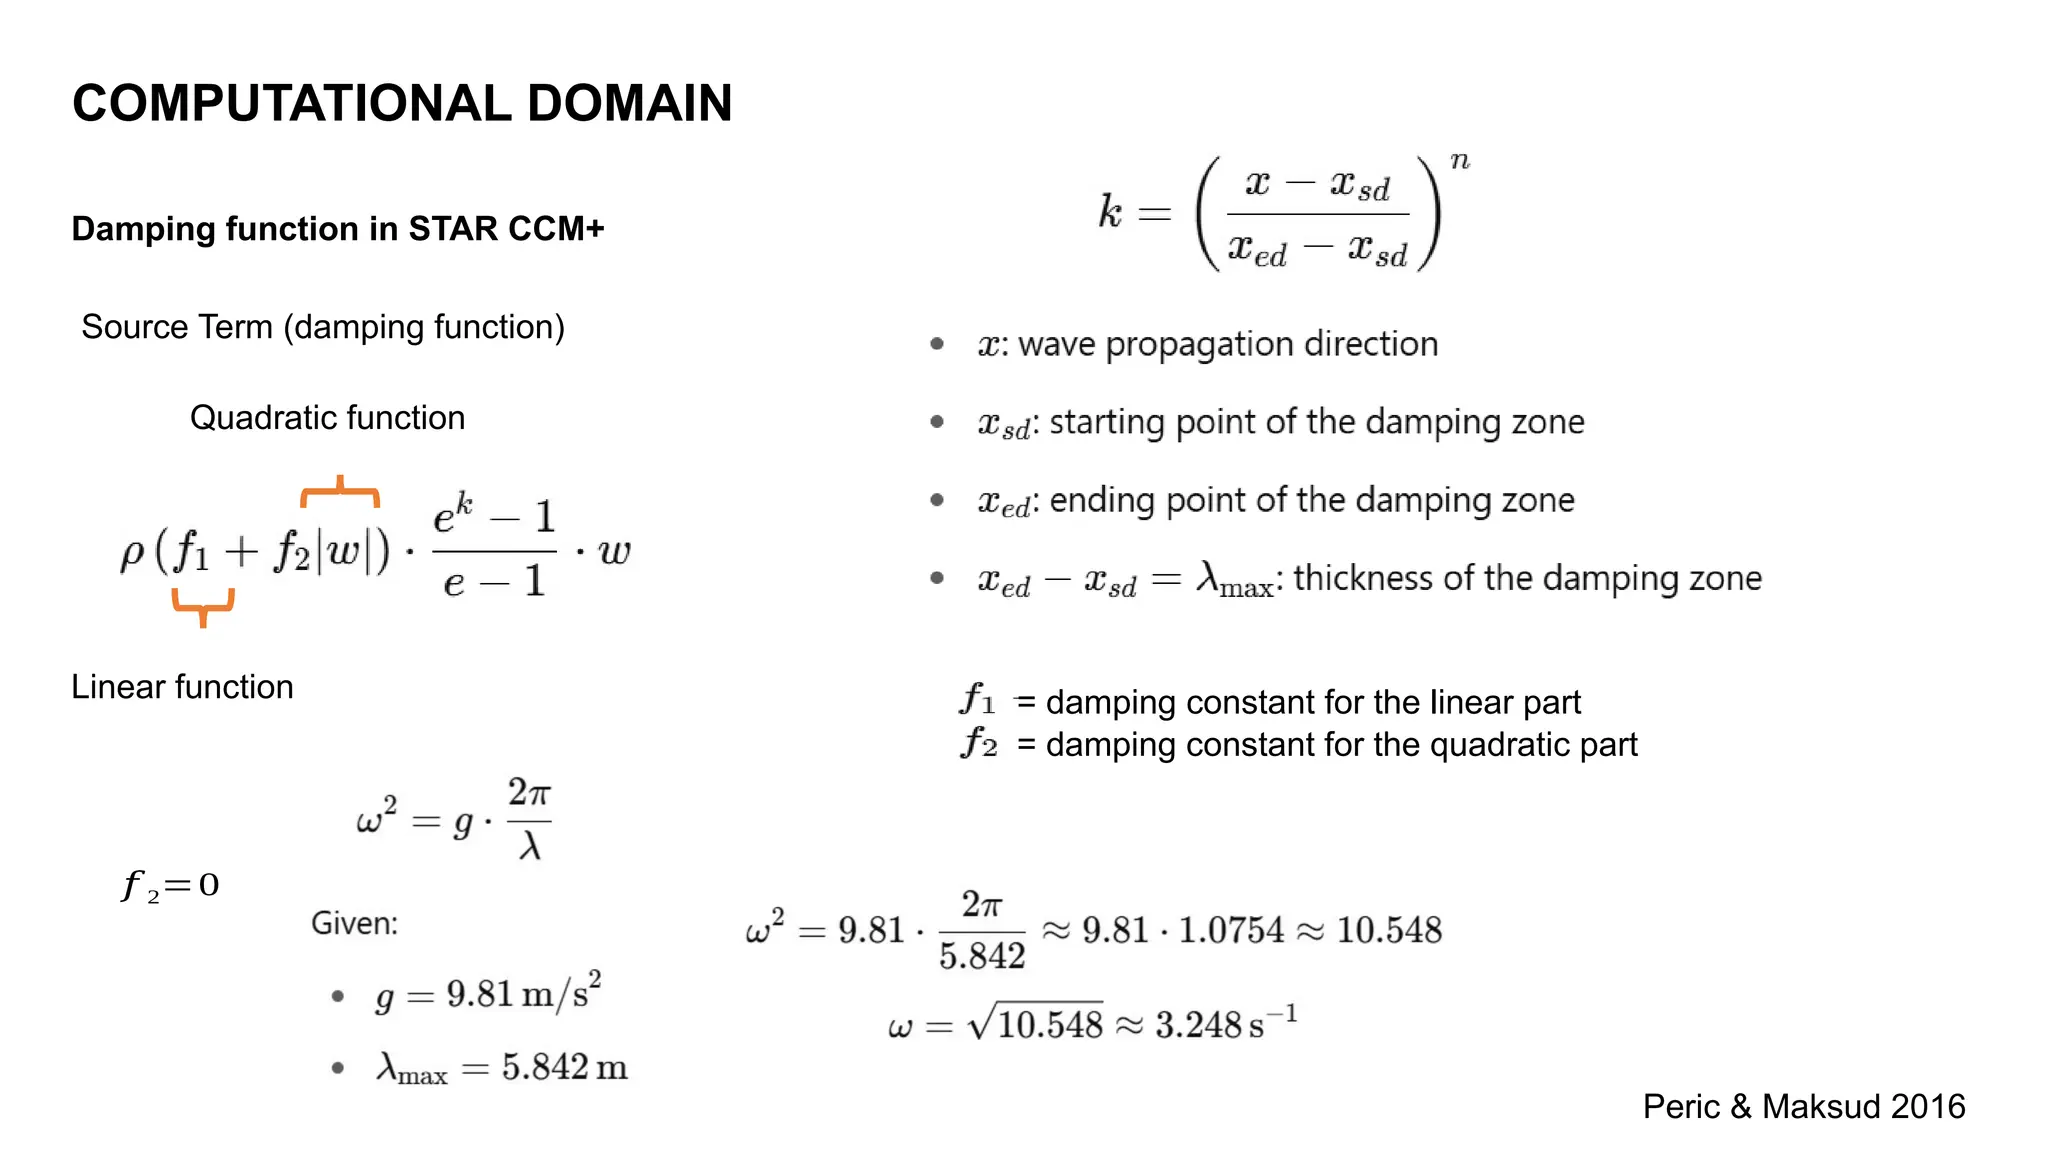
COMPUTATIONAL DOMAIN
Damping functionin STAR CCM+
Source Term (damping function)
Linear function
Quadratic function
= damping constant for the linear part
= damping constant for the quadratic part
𝑓 2=0
Peric & Maksud 2016
15.
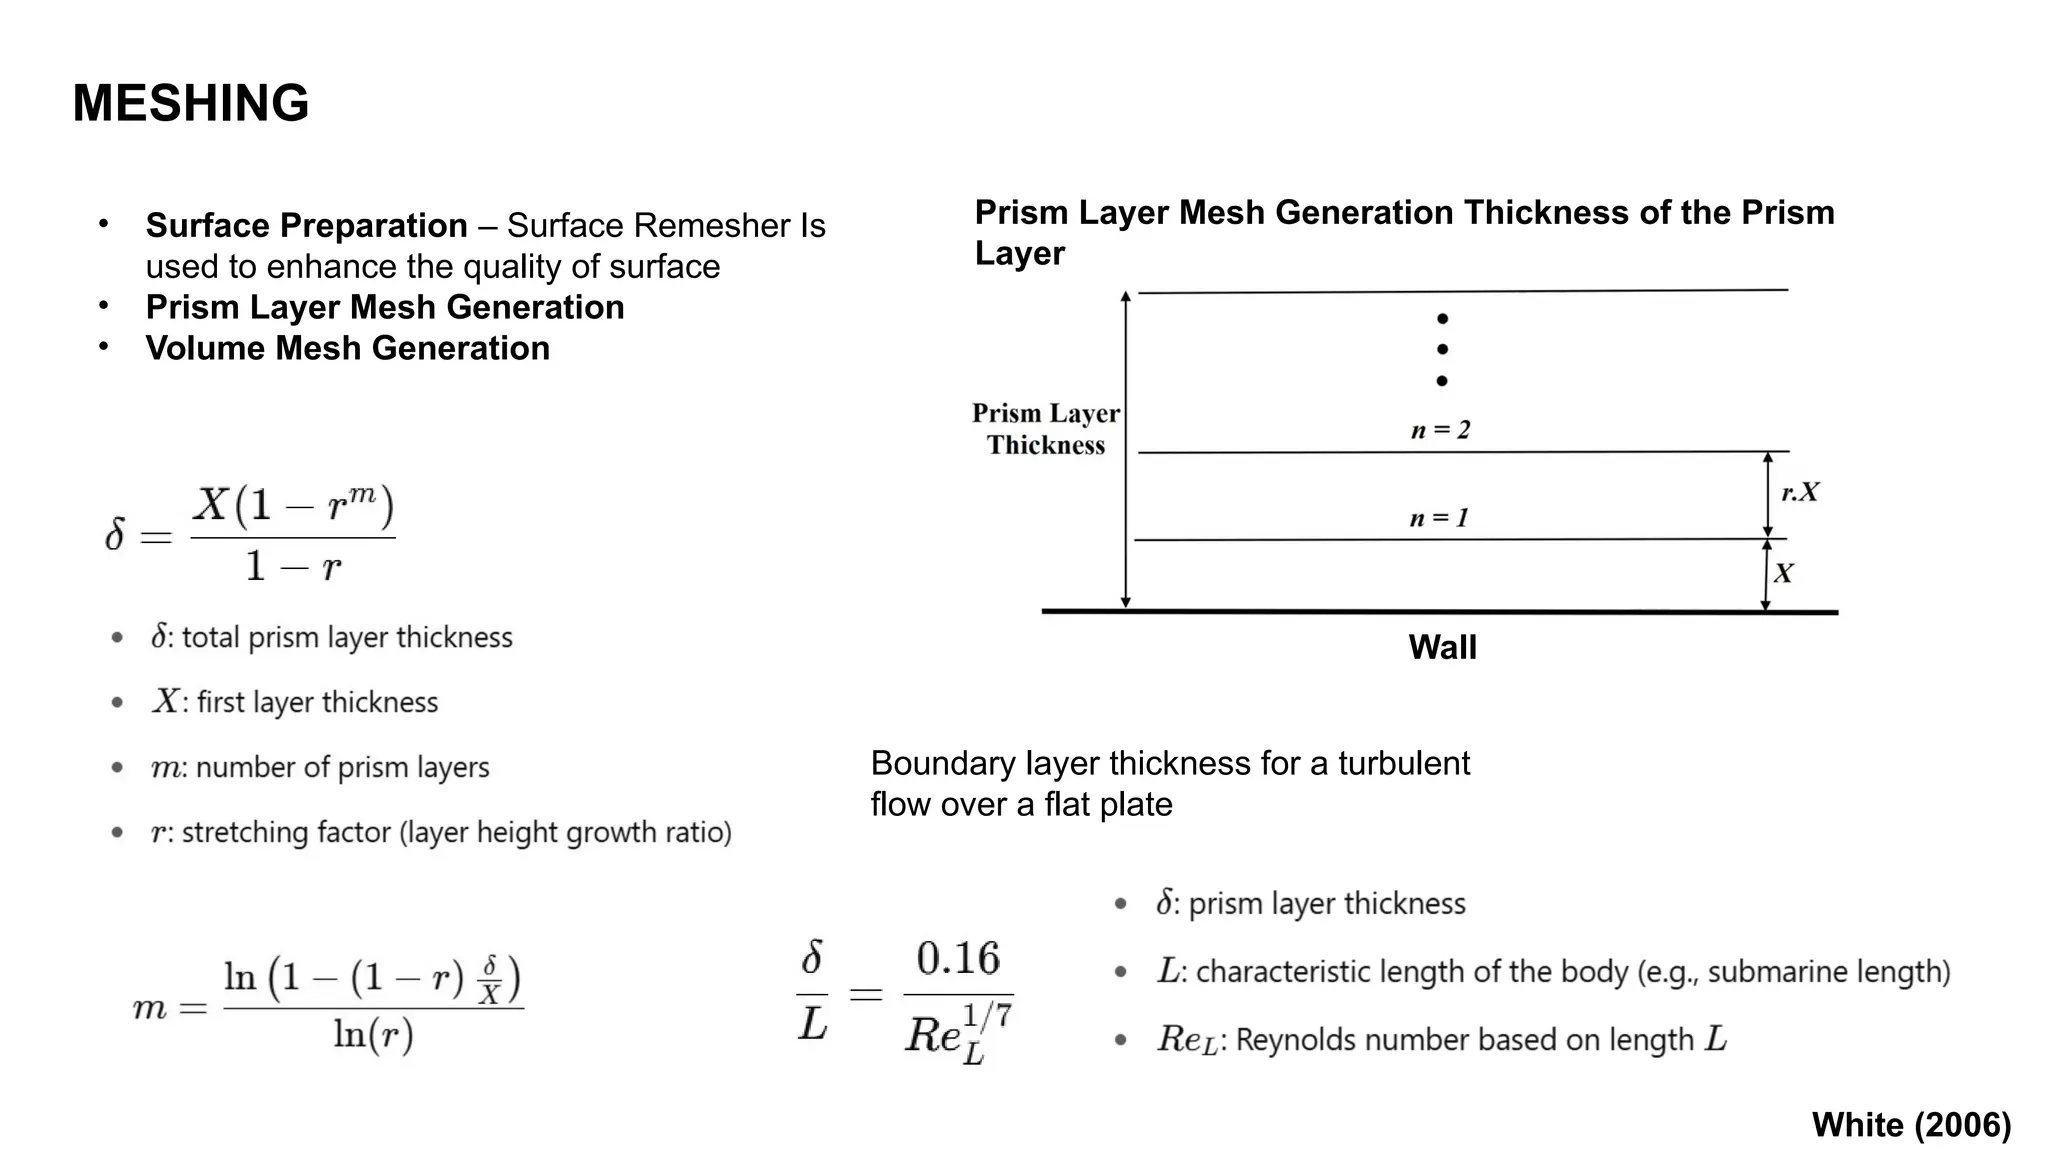
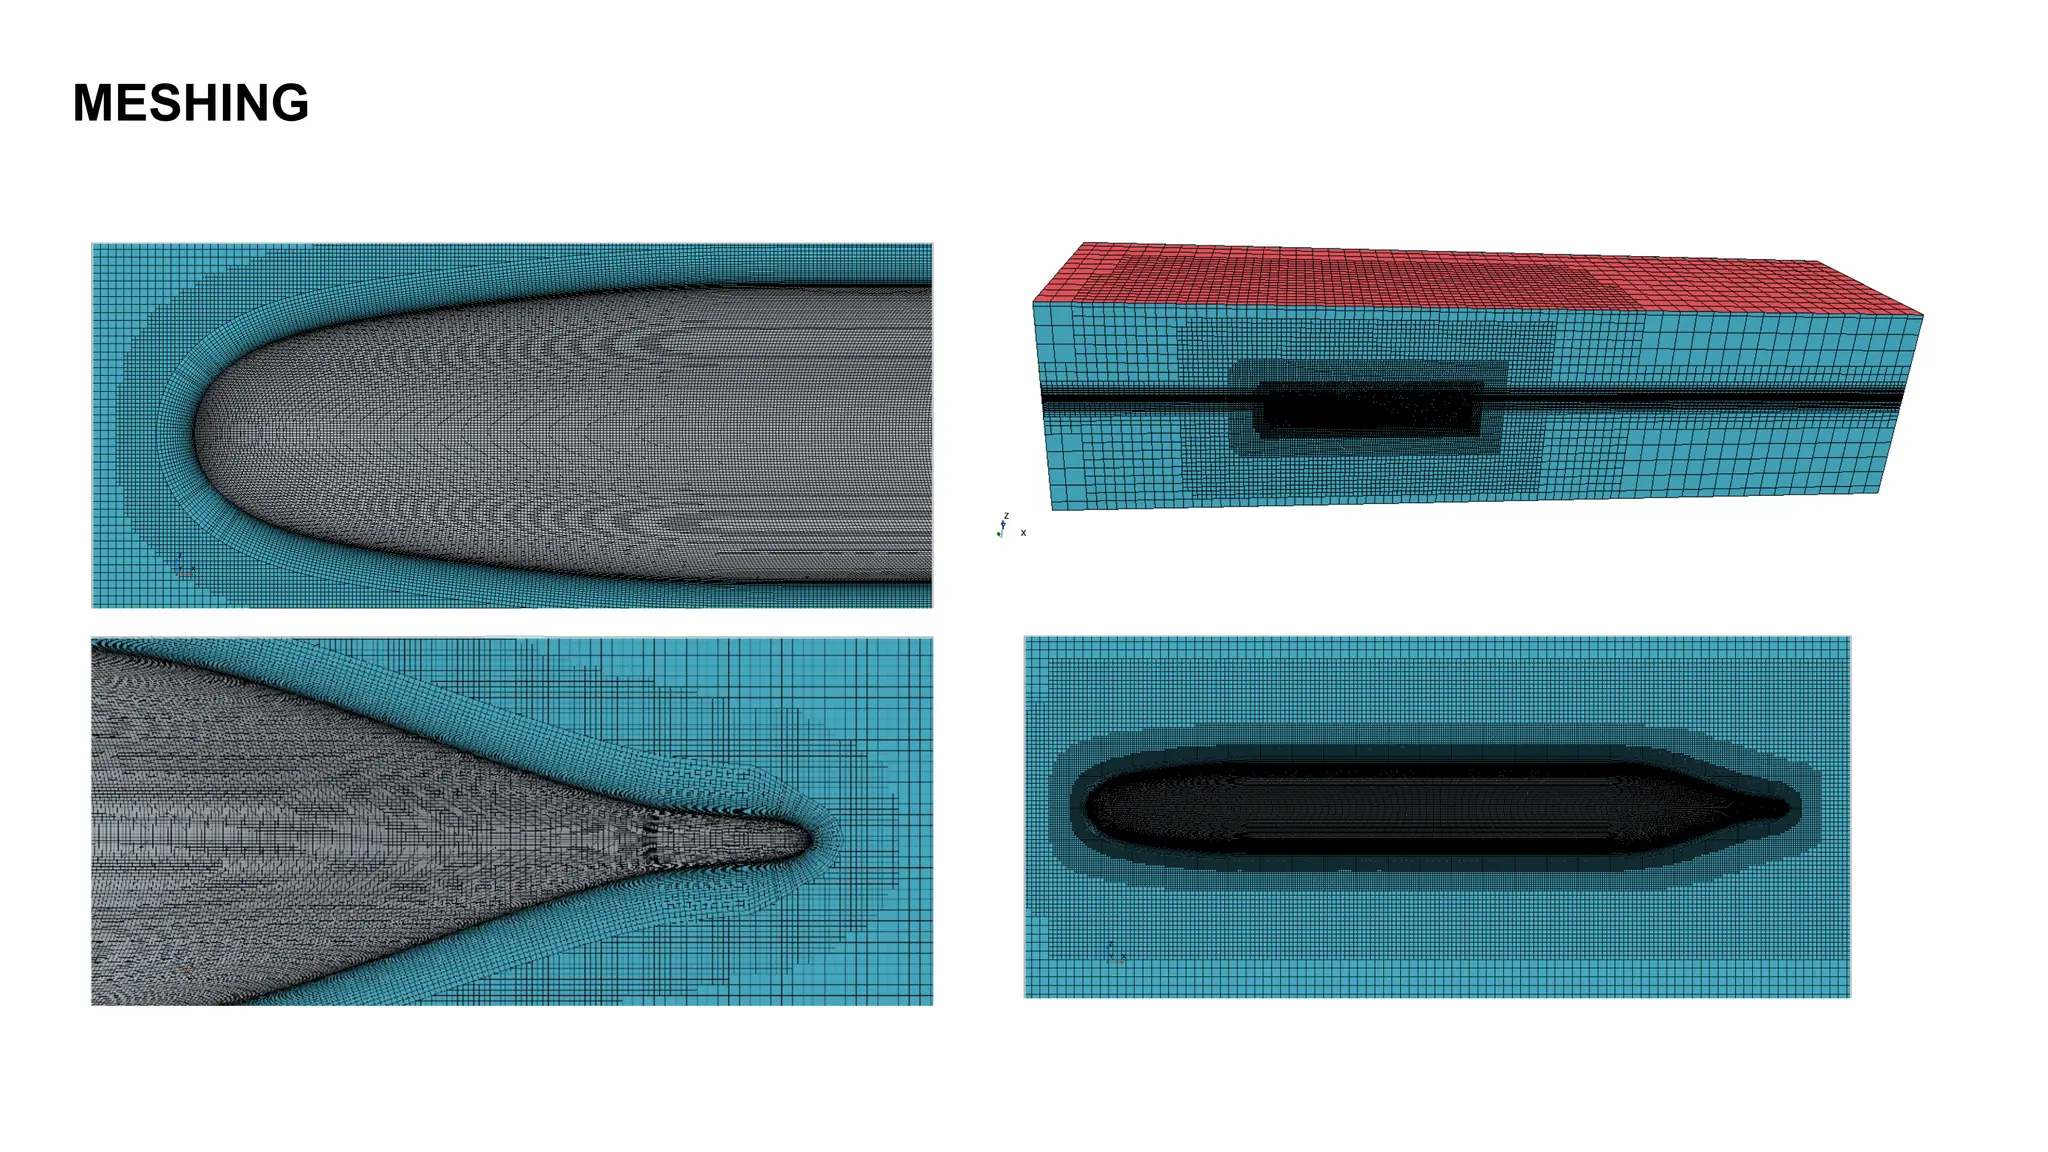
Prism Layer MeshGeneration Thickness of the Prism
Layer
• Surface Preparation – Surface Remesher Is
used to enhance the quality of surface
• Prism Layer Mesh Generation
• Volume Mesh Generation
White (2006)
Boundary layer thickness for a turbulent
flow over a flat plate
Wall
MESHING
16.
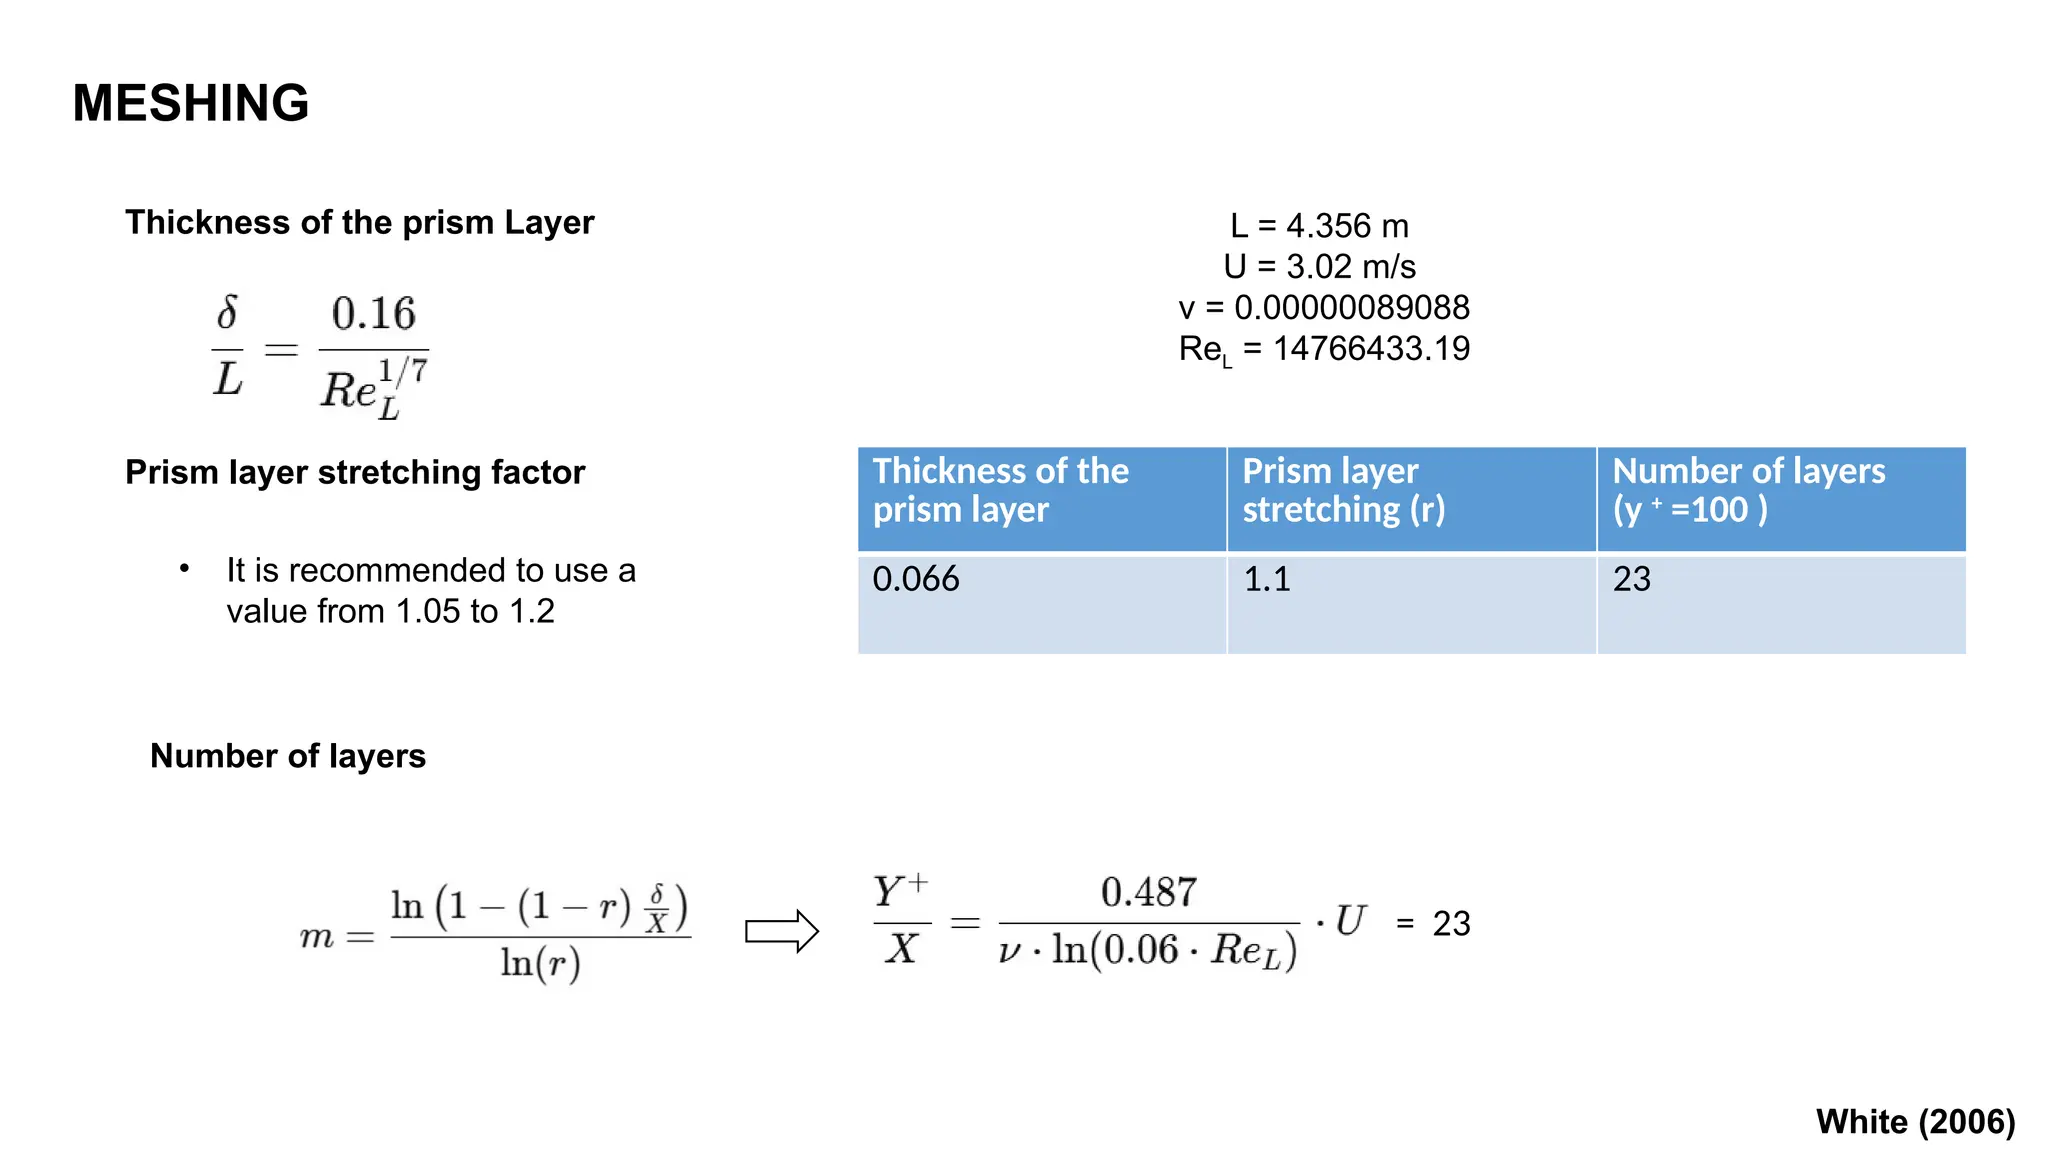
MESHING
White (2006)
Thickness ofthe prism Layer
Prism layer stretching factor
• It is recommended to use a
value from 1.05 to 1.2
Number of layers
L = 4.356 m
U = 3.02 m/s
v = 0.00000089088
ReL = 14766433.19
Thickness of the
prism layer
Prism layer
stretching (r)
Number of layers
(y +
=100 )
0.066 1.1 23
= 23
SIMULATION SETUP
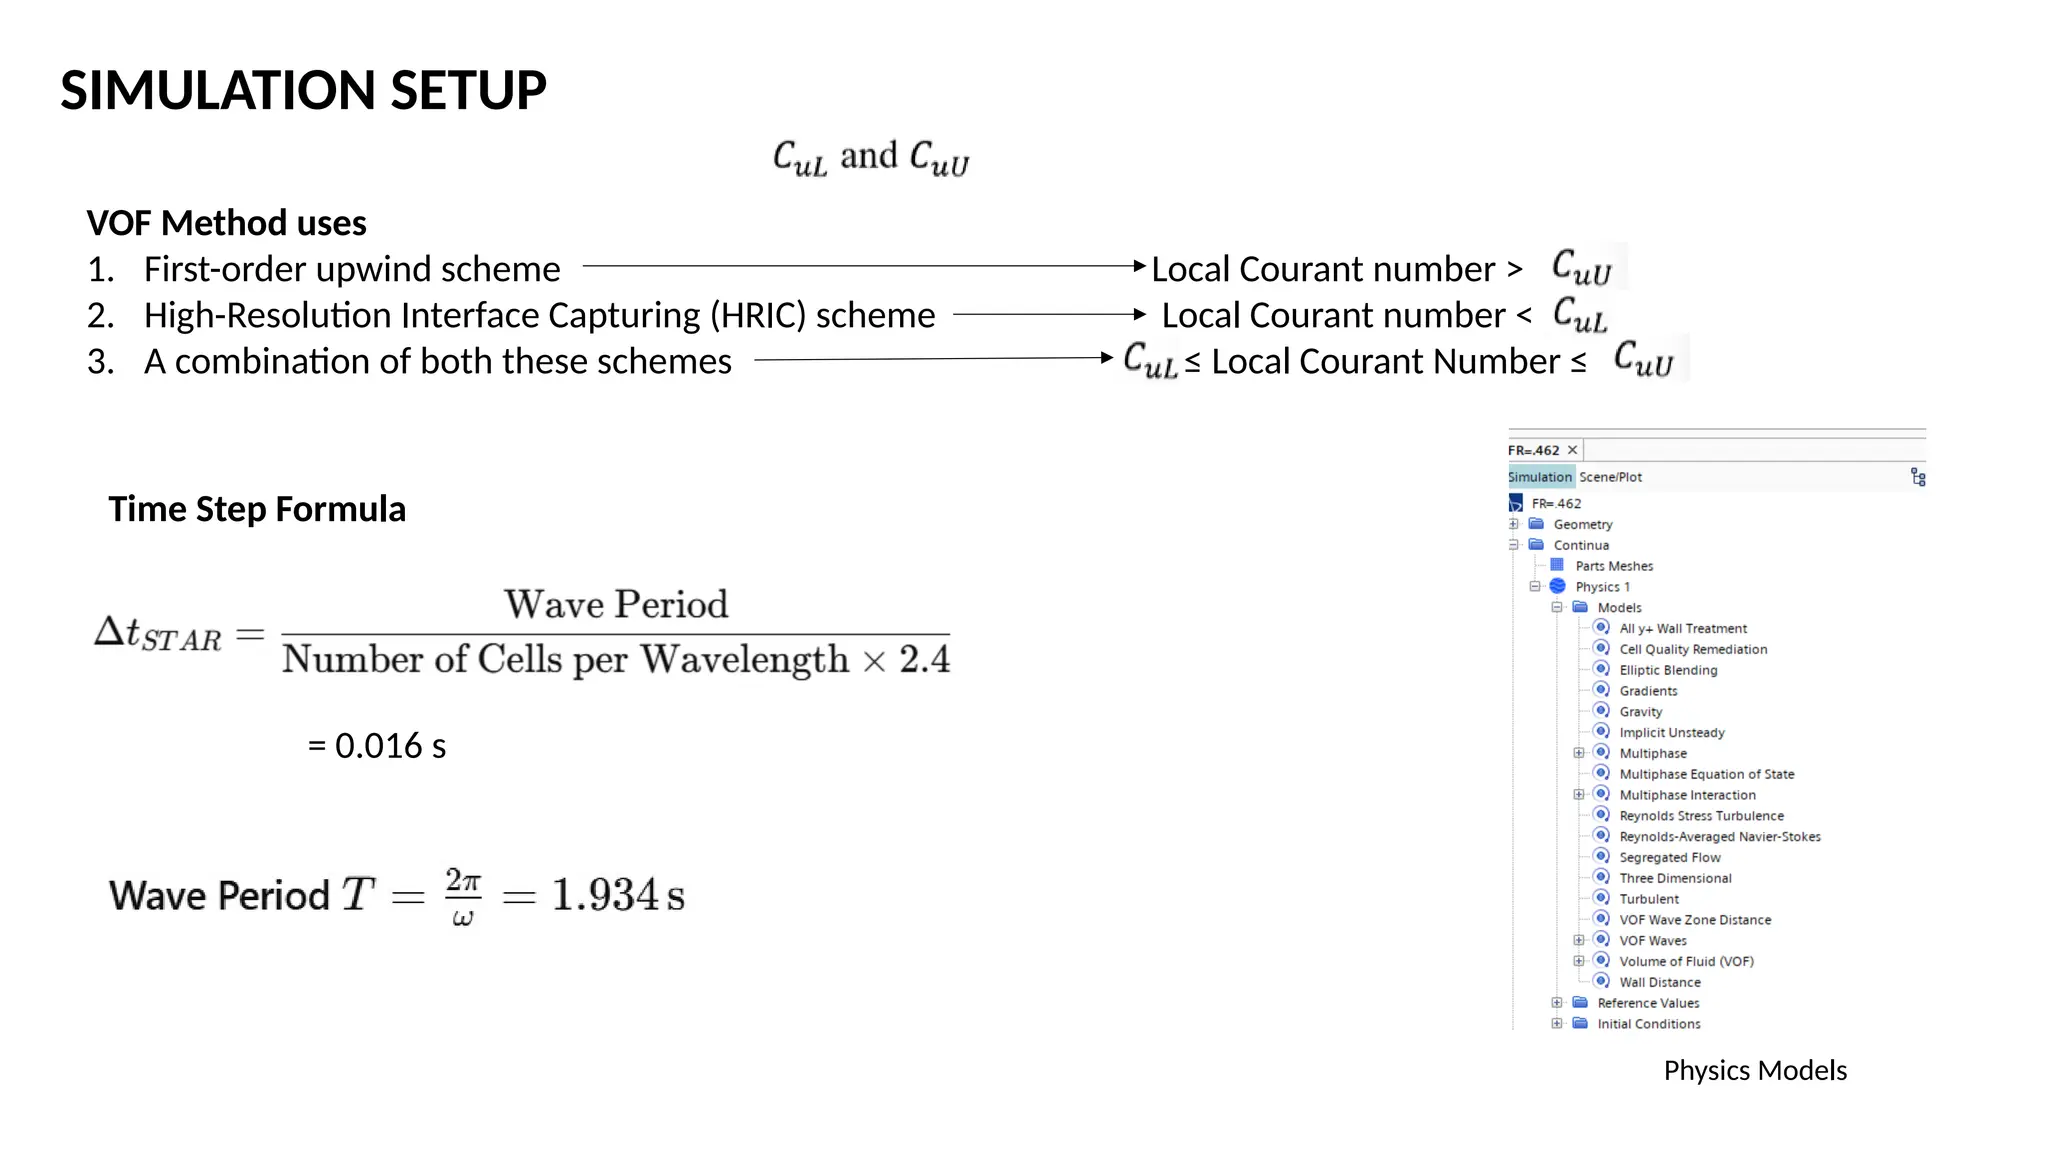
VOF Methoduses
1. First-order upwind scheme Local Courant number >
2. High-Resolution Interface Capturing (HRIC) scheme Local Courant number <
3. A combination of both these schemes ≤ Local Courant Number ≤
Time Step Formula
= 0.016 s
Physics Models
20.
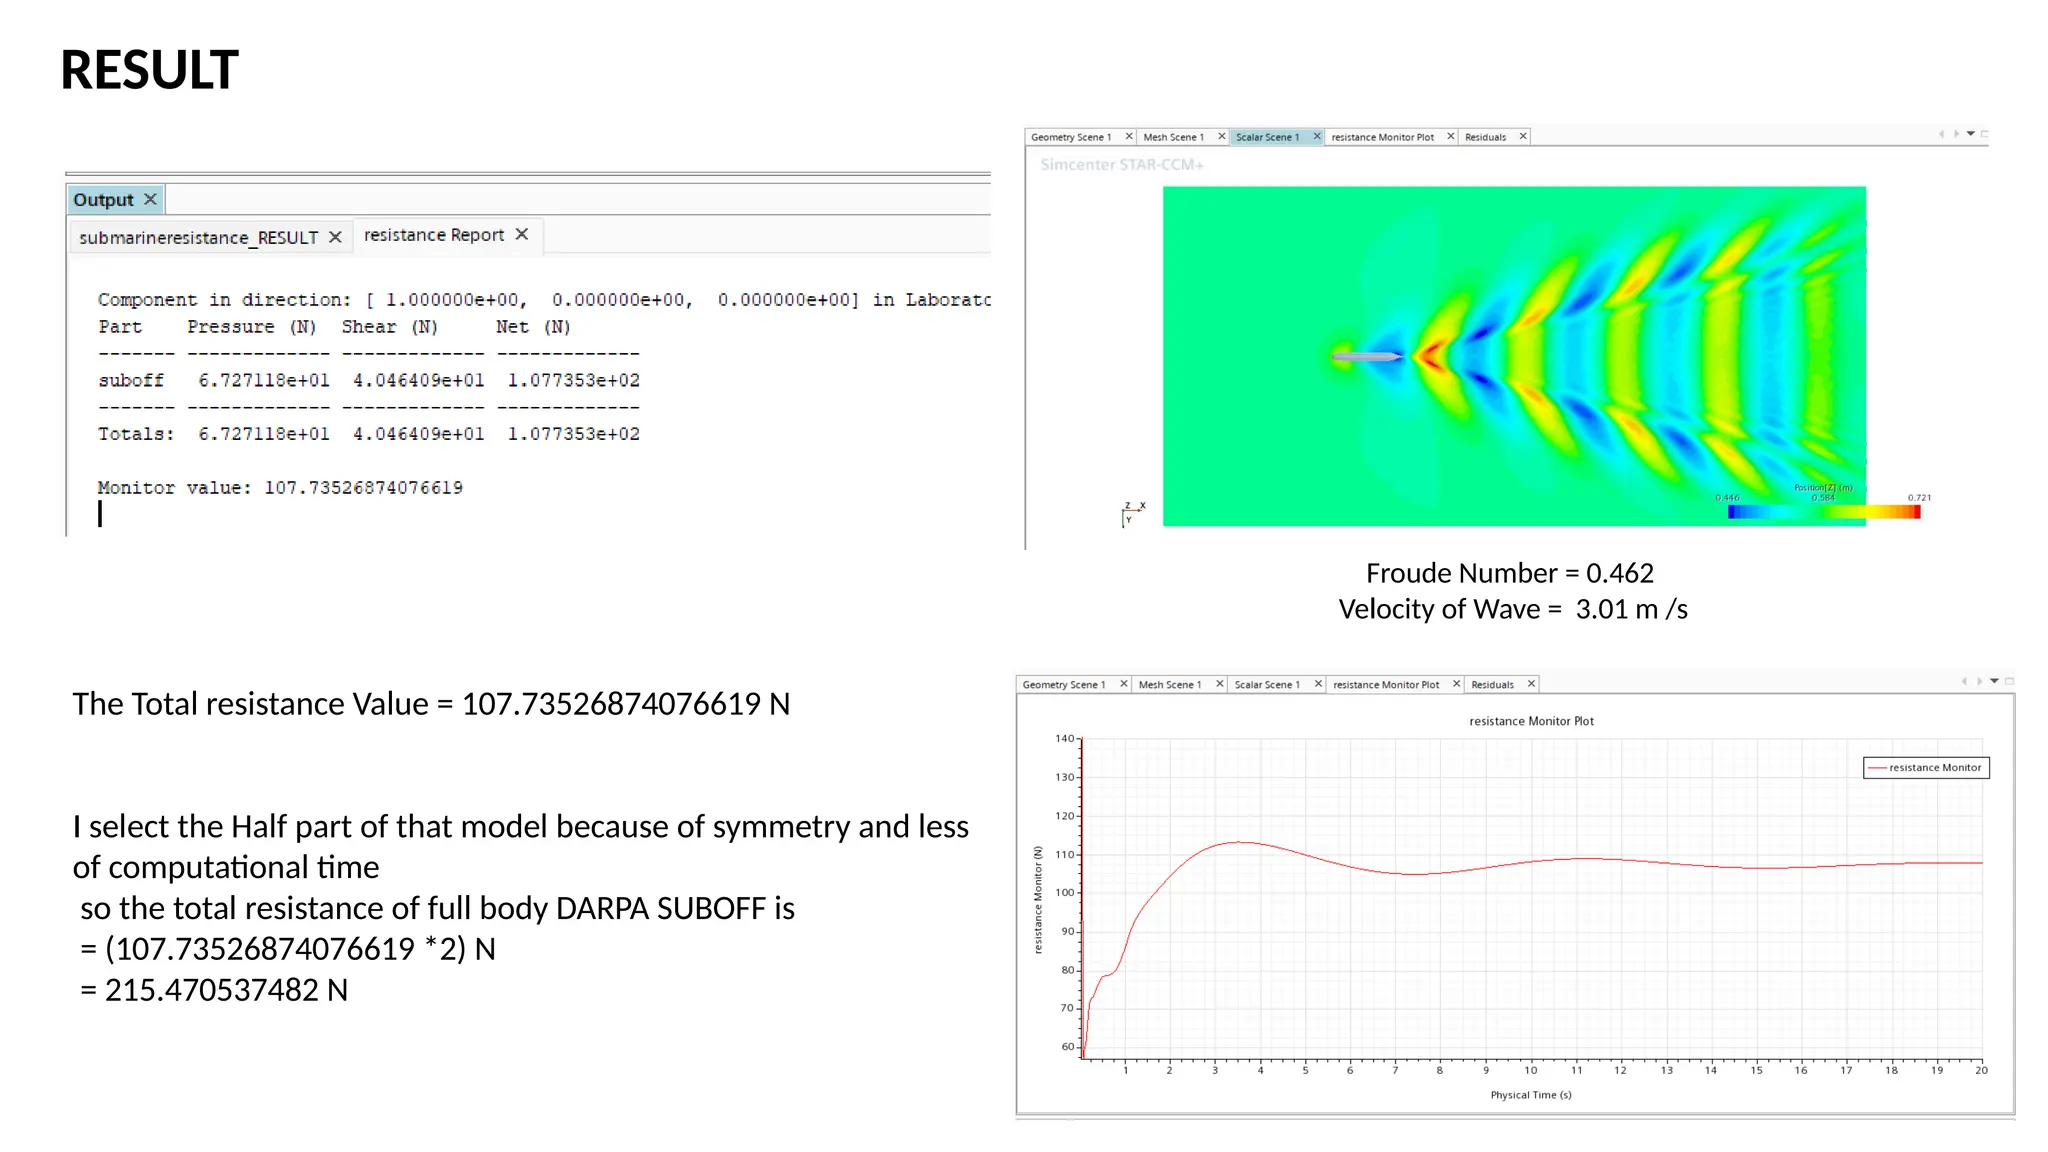
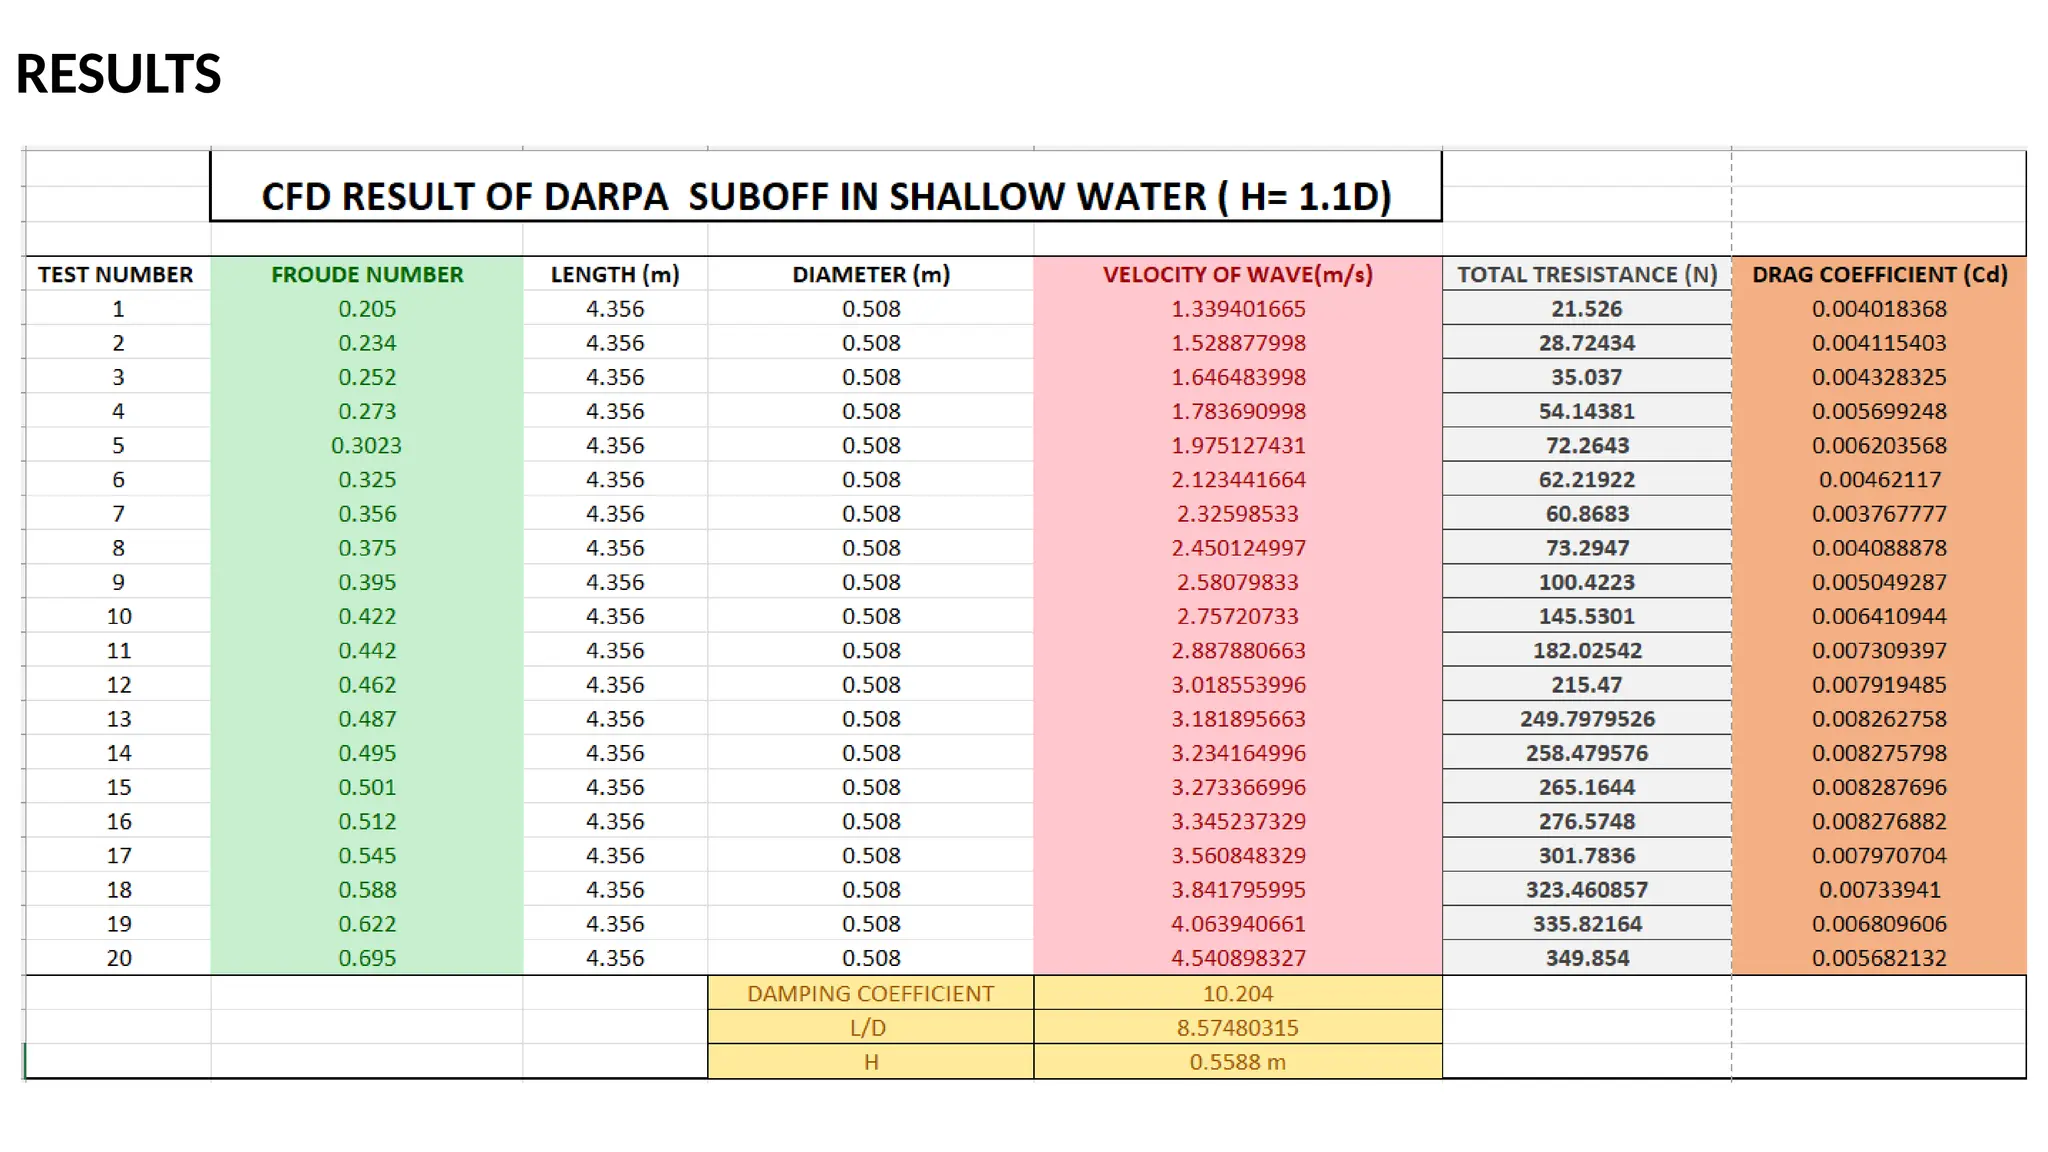
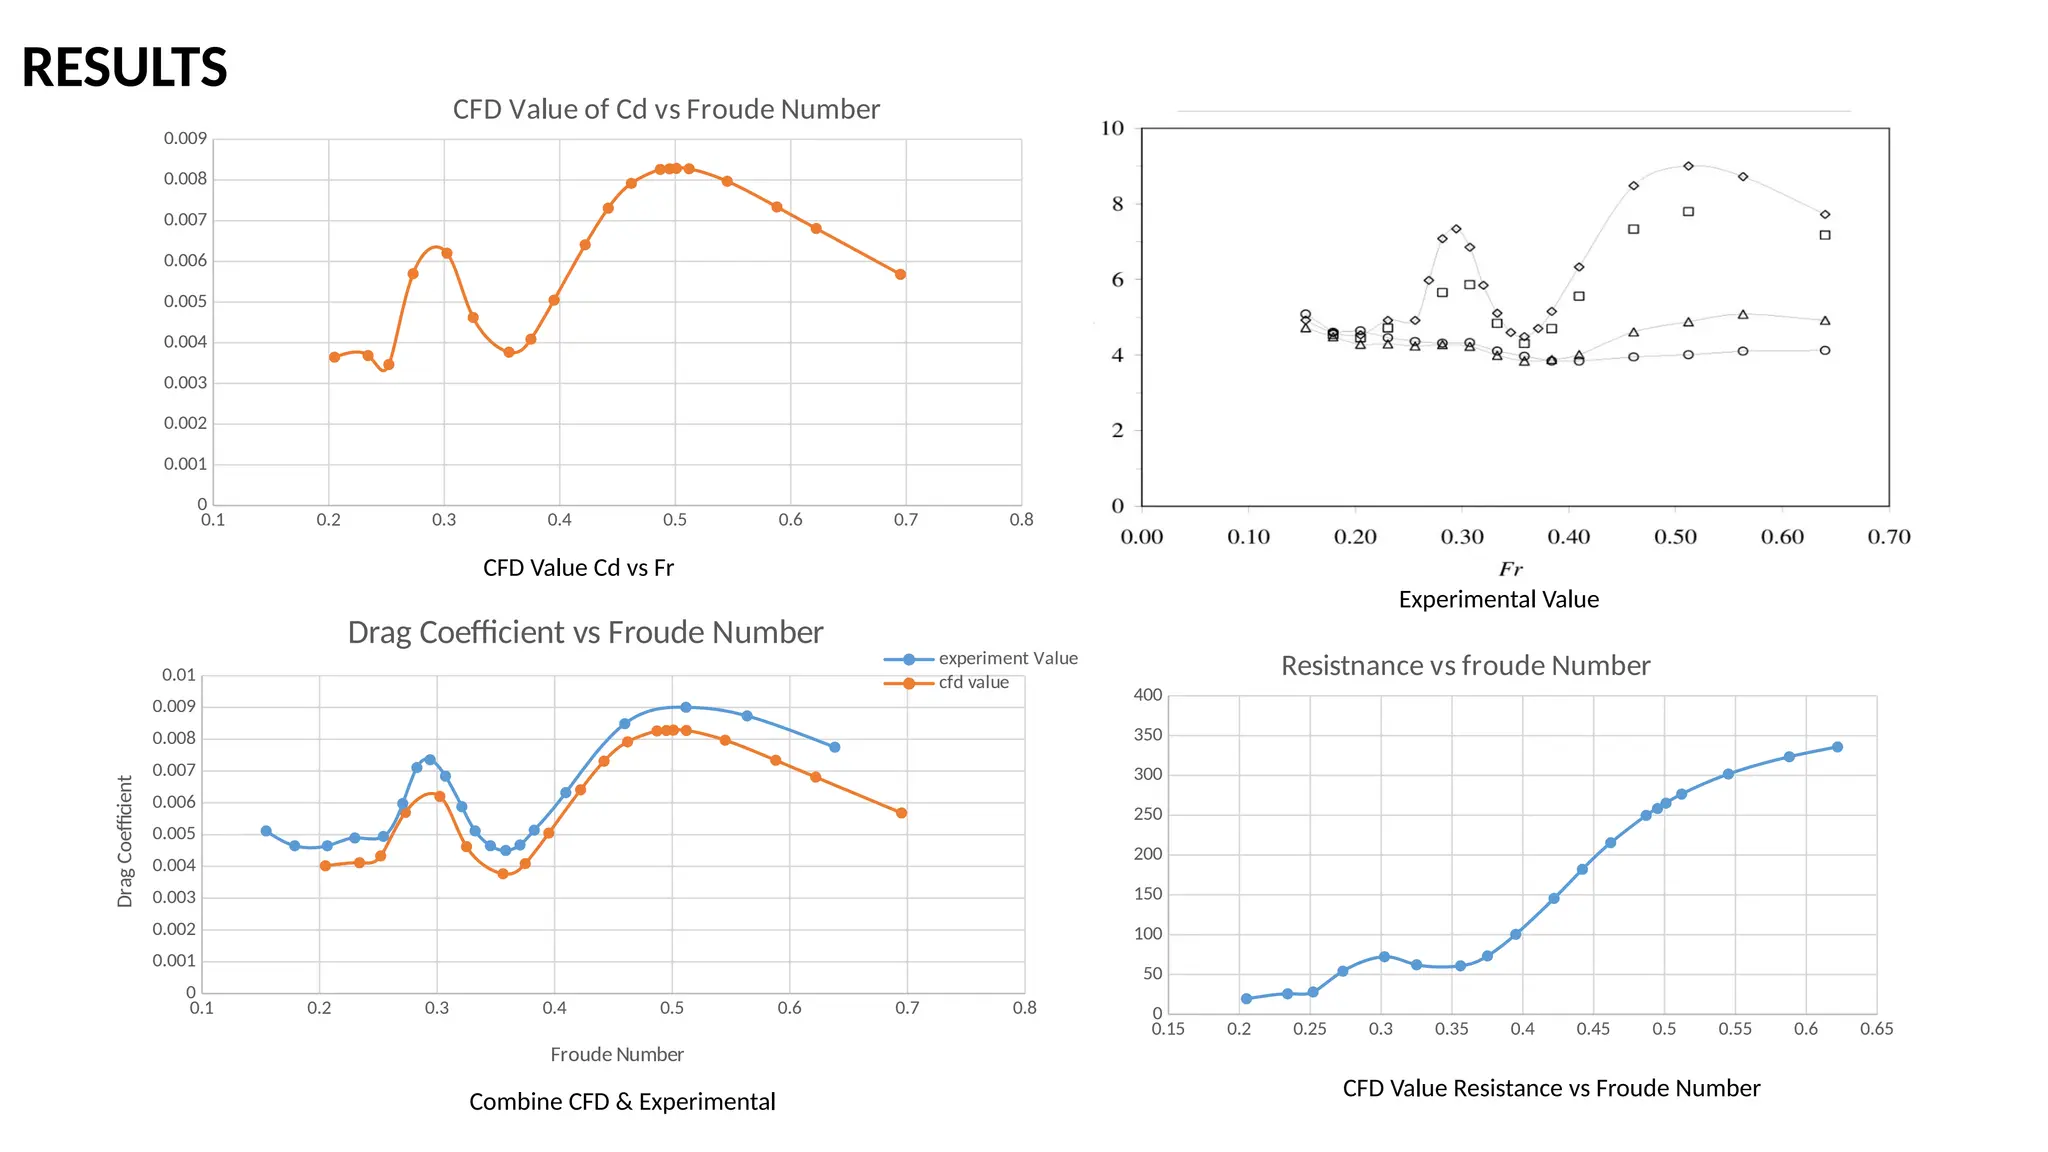
RESULT
The Total resistanceValue = 107.73526874076619 N
I select the Half part of that model because of symmetry and less
of computational time
so the total resistance of full body DARPA SUBOFF is
= (107.73526874076619 *2) N
= 215.470537482 N
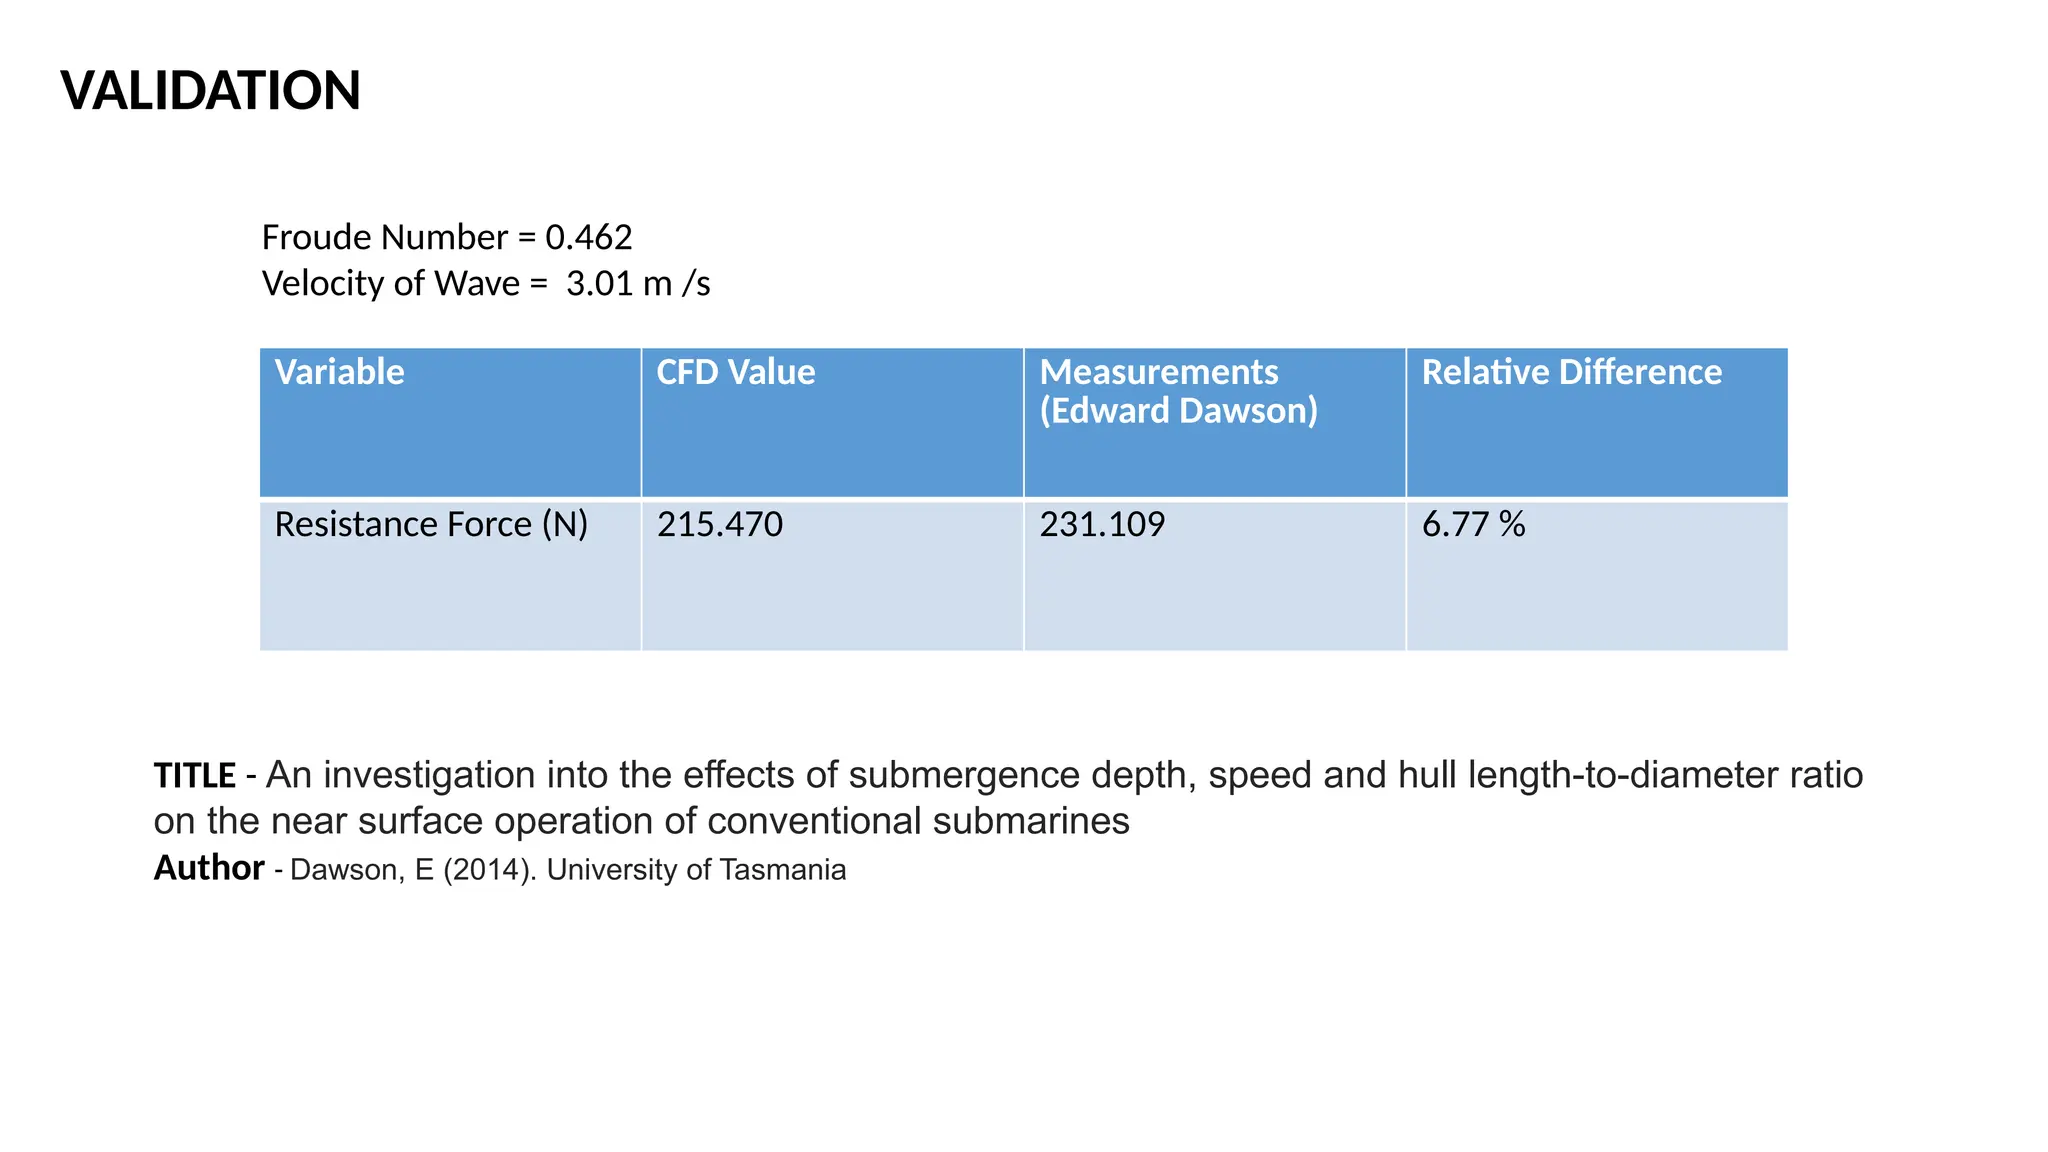
Froude Number = 0.462
Velocity of Wave = 3.01 m /s
21.
VALIDATION
Variable CFD ValueMeasurements
(Edward Dawson)
Relative Difference
Resistance Force (N) 215.470 231.109 6.77 %
Froude Number = 0.462
Velocity of Wave = 3.01 m /s
TITLE - An investigation into the effects of submergence depth, speed and hull length-to-diameter ratio
on the near surface operation of conventional submarines
Author - Dawson, E (2014). University of Tasmania
22.
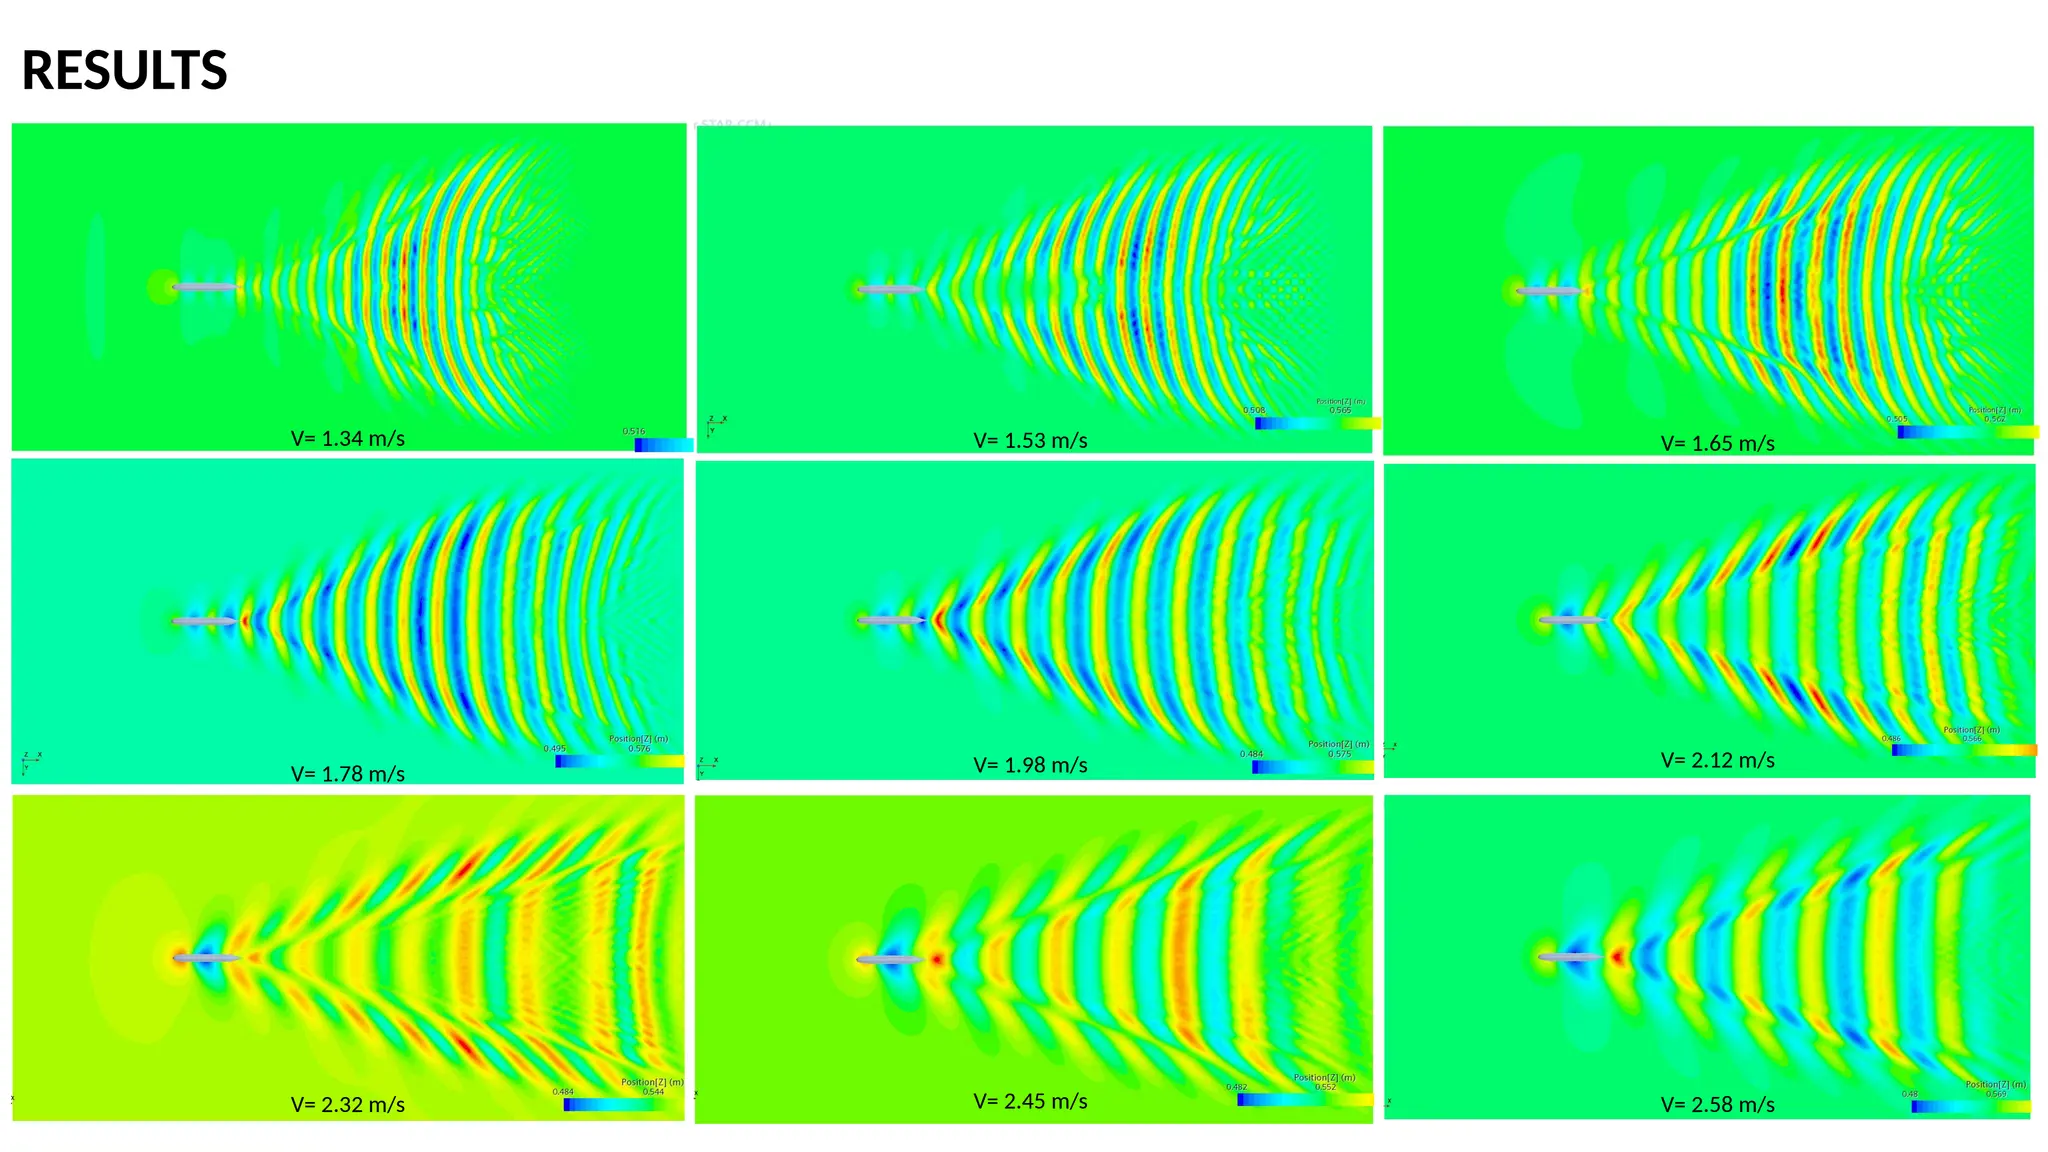
RESULTS
V= 1.34 m/sV= 1.53 m/s V= 1.65 m/s
V= 1.78 m/s V= 1.98 m/s V= 2.12 m/s
V= 2.32 m/s V= 2.58 m/s
V= 2.45 m/s
23.
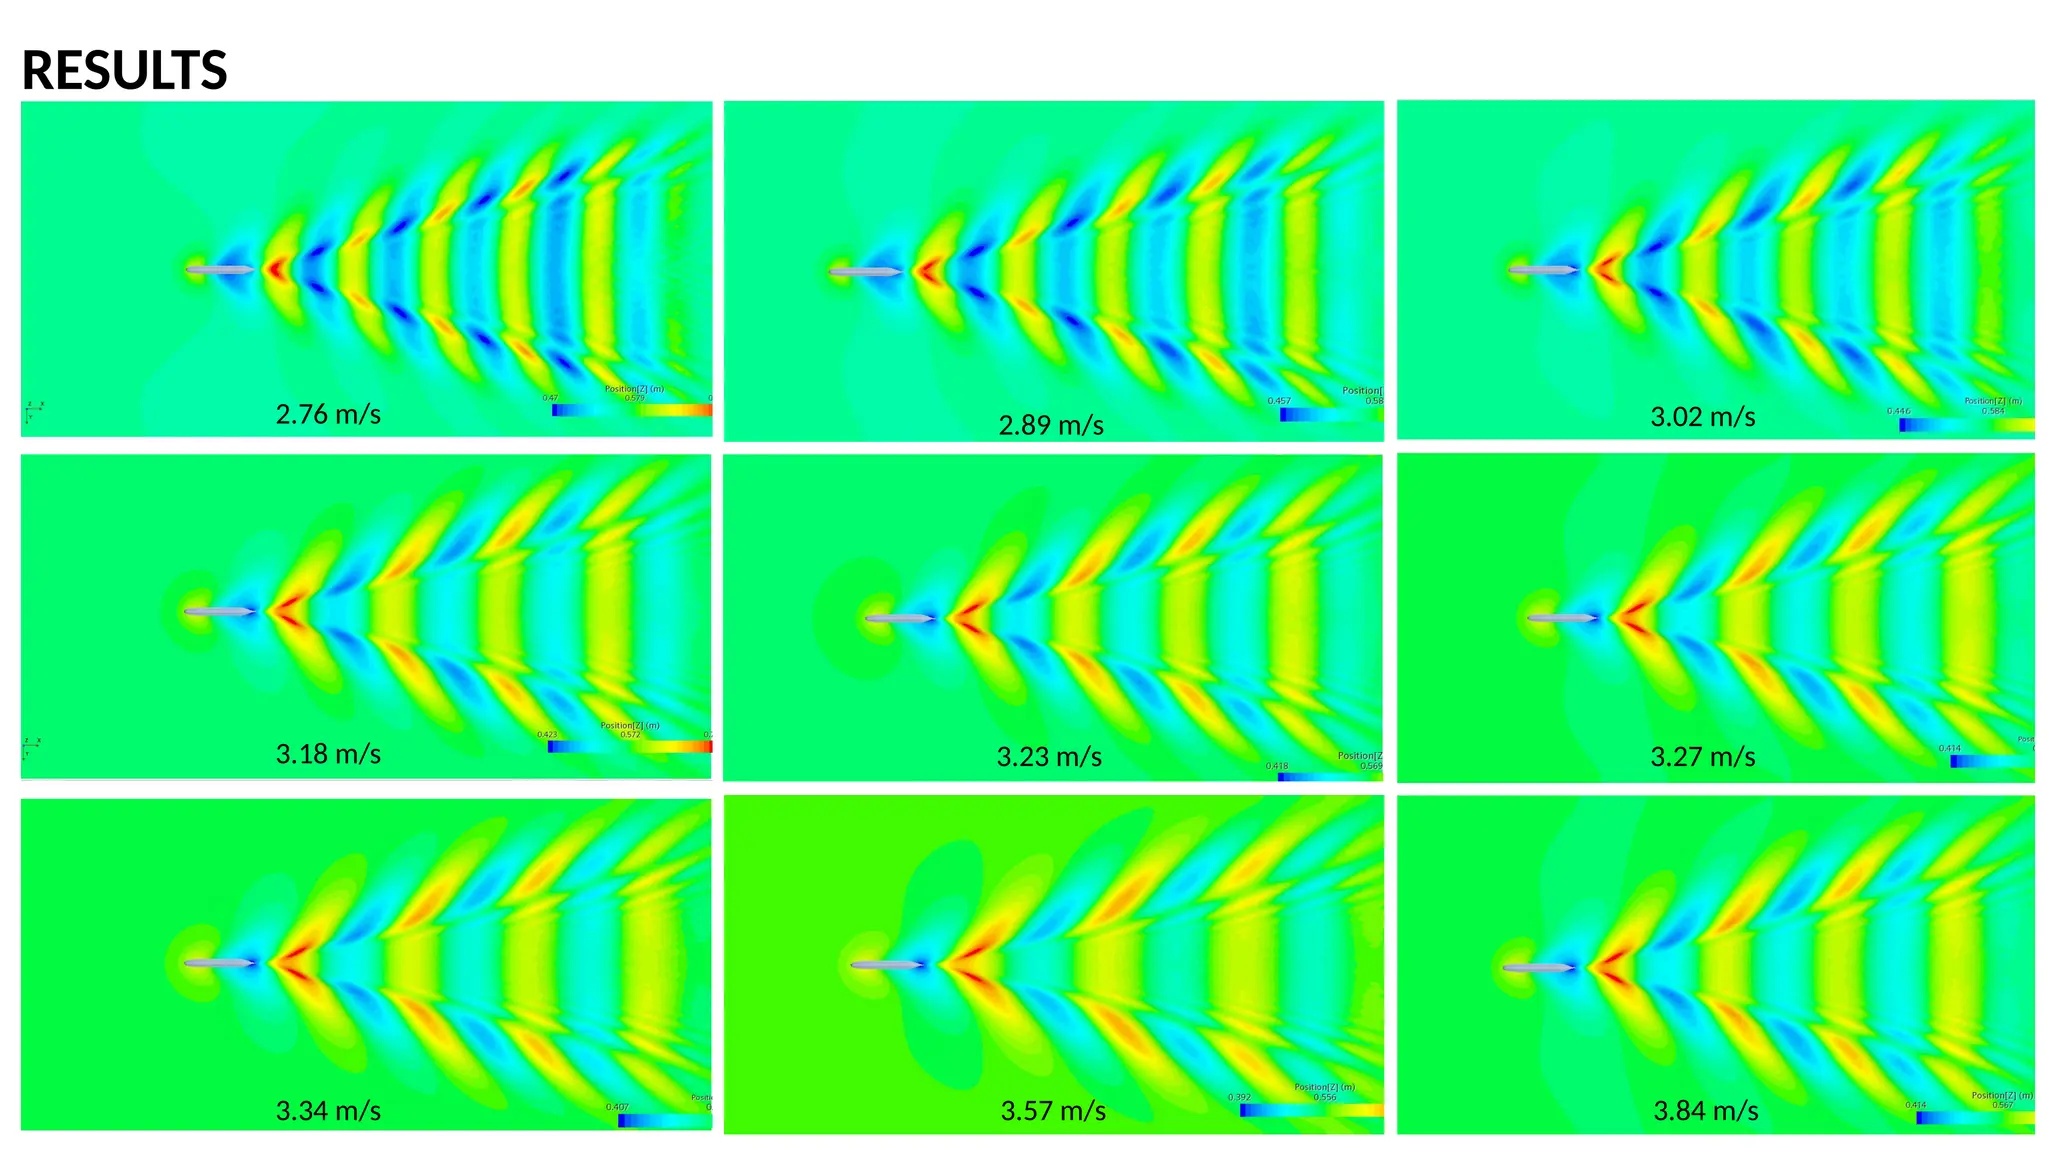
RESULTS
2.76 m/s 2.89m/s 3.02 m/s
3.18 m/s 3.23 m/s 3.27 m/s
3.34 m/s 3.57 m/s 3.84 m/s
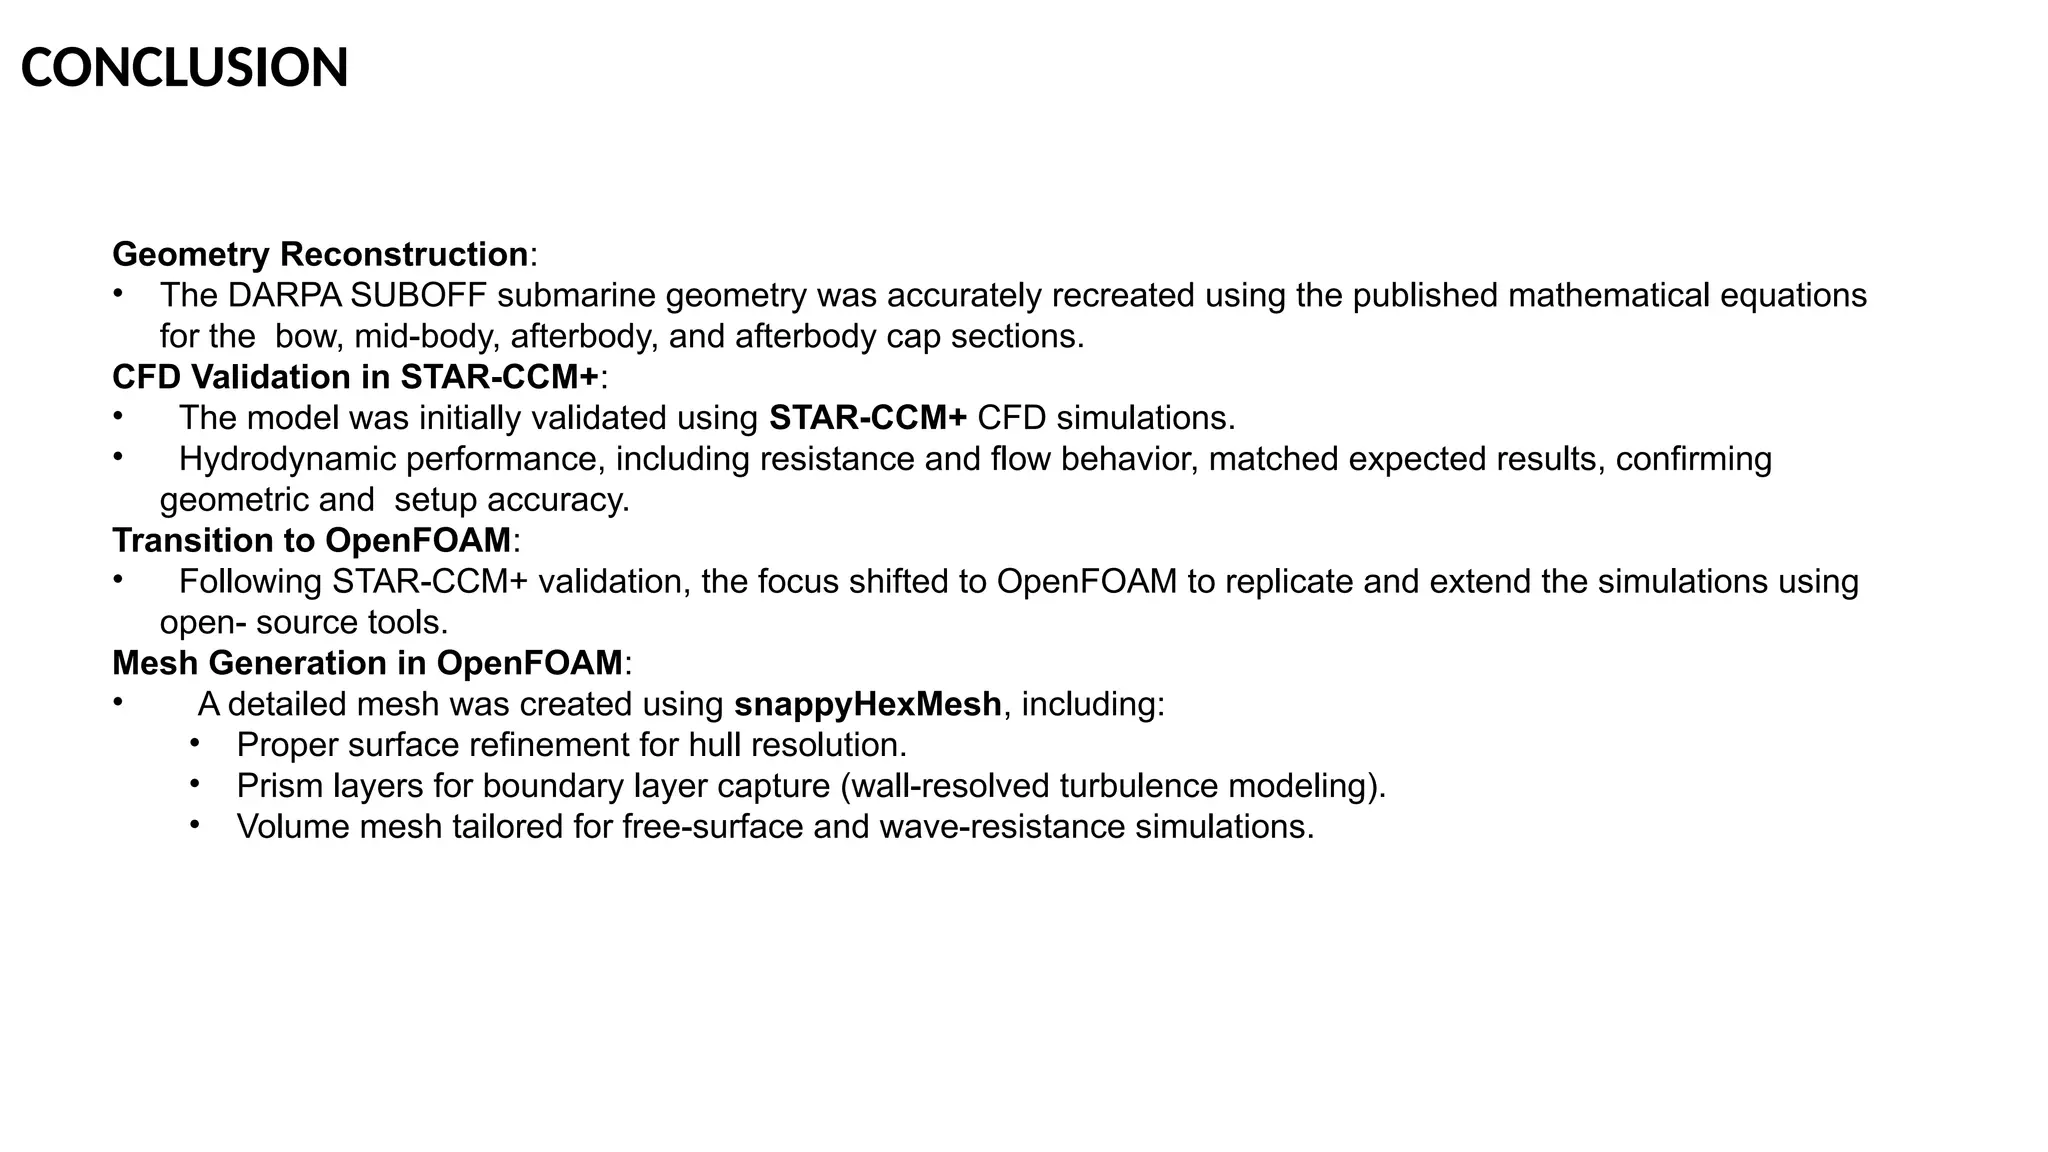
CONCLUSION
Geometry Reconstruction:
• TheDARPA SUBOFF submarine geometry was accurately recreated using the published mathematical equations
for the bow, mid-body, afterbody, and afterbody cap sections.
CFD Validation in STAR-CCM+:
• The model was initially validated using STAR-CCM+ CFD simulations.
• Hydrodynamic performance, including resistance and flow behavior, matched expected results, confirming
geometric and setup accuracy.
Transition to OpenFOAM:
• Following STAR-CCM+ validation, the focus shifted to OpenFOAM to replicate and extend the simulations using
open- source tools.
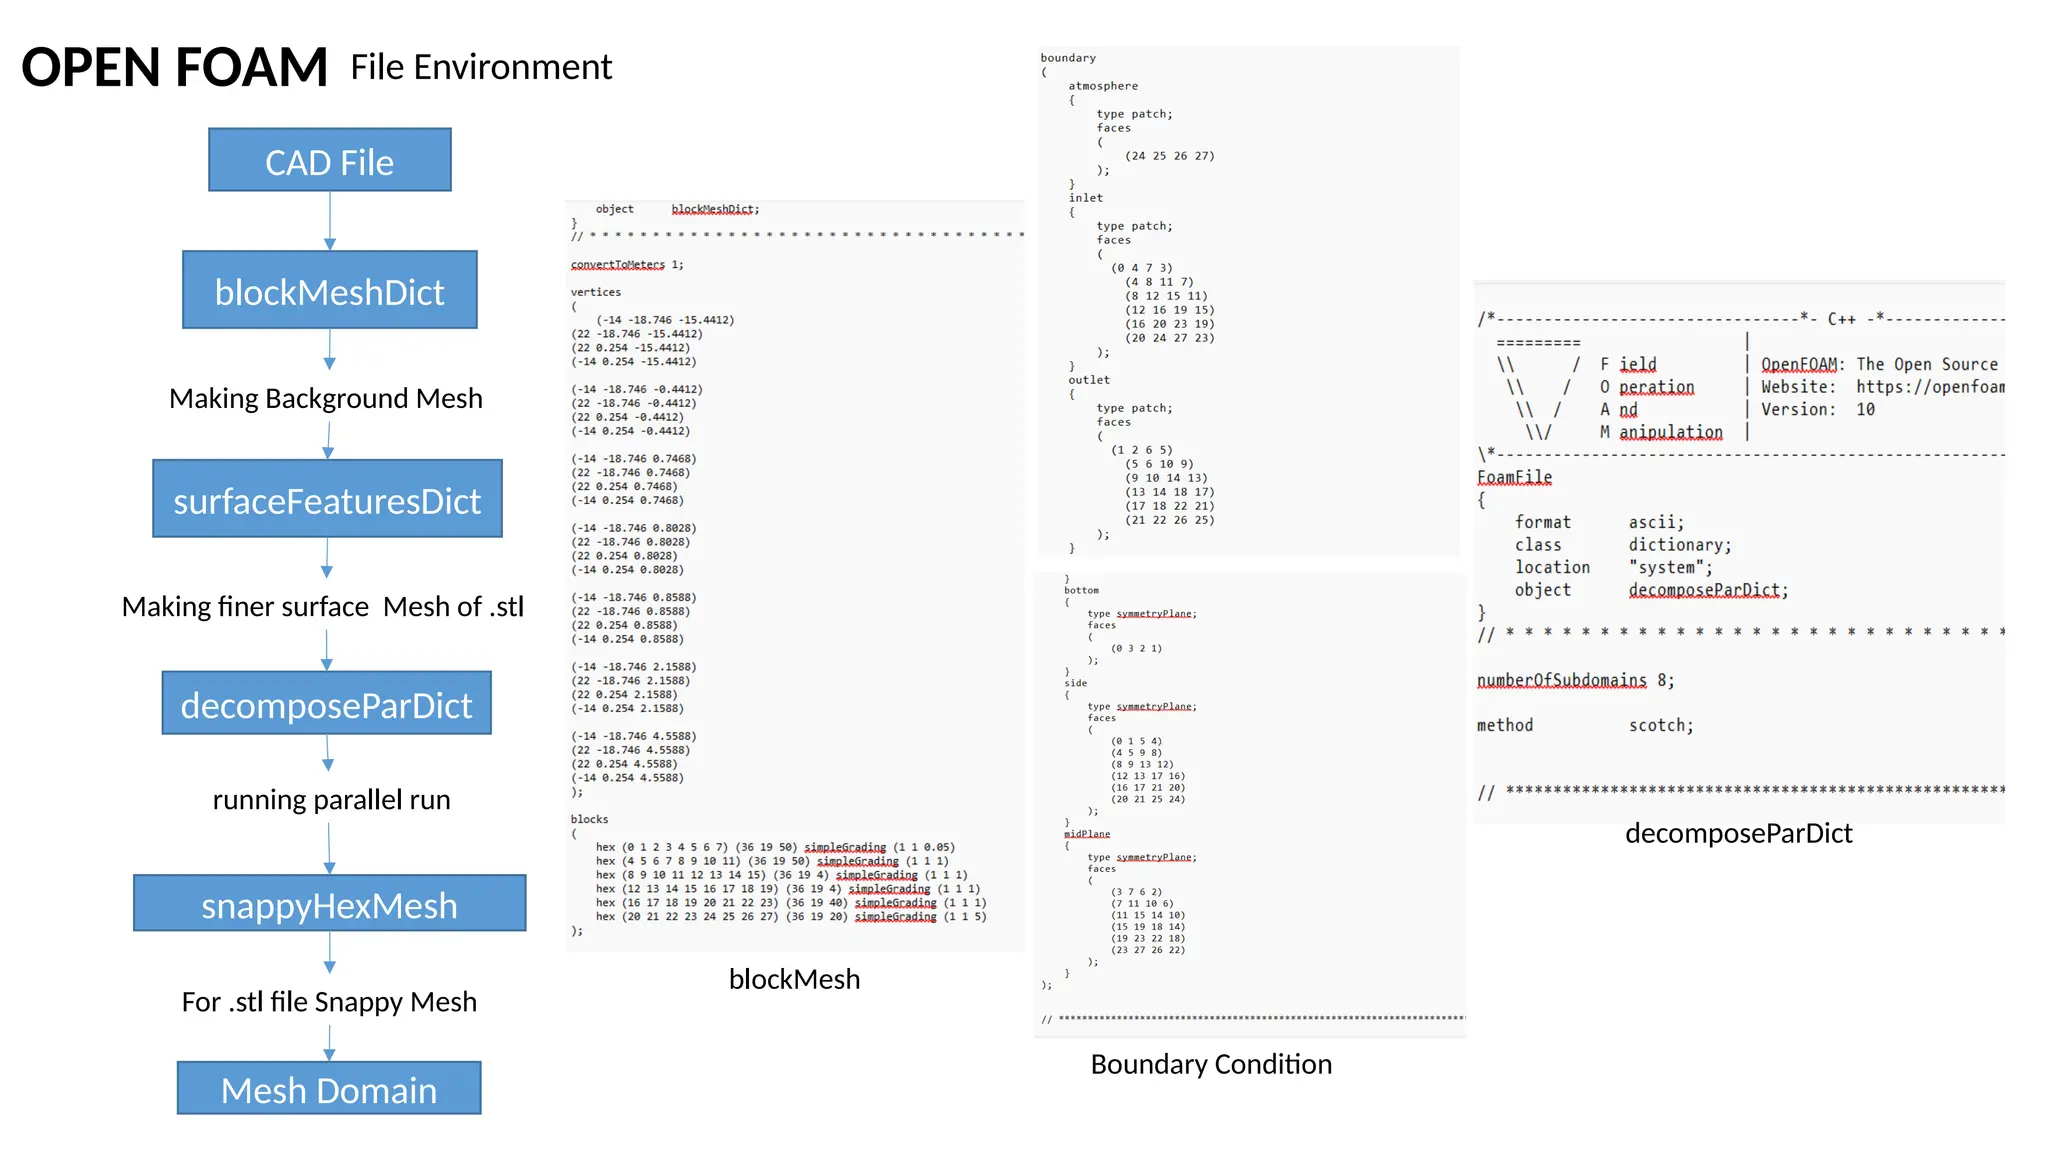
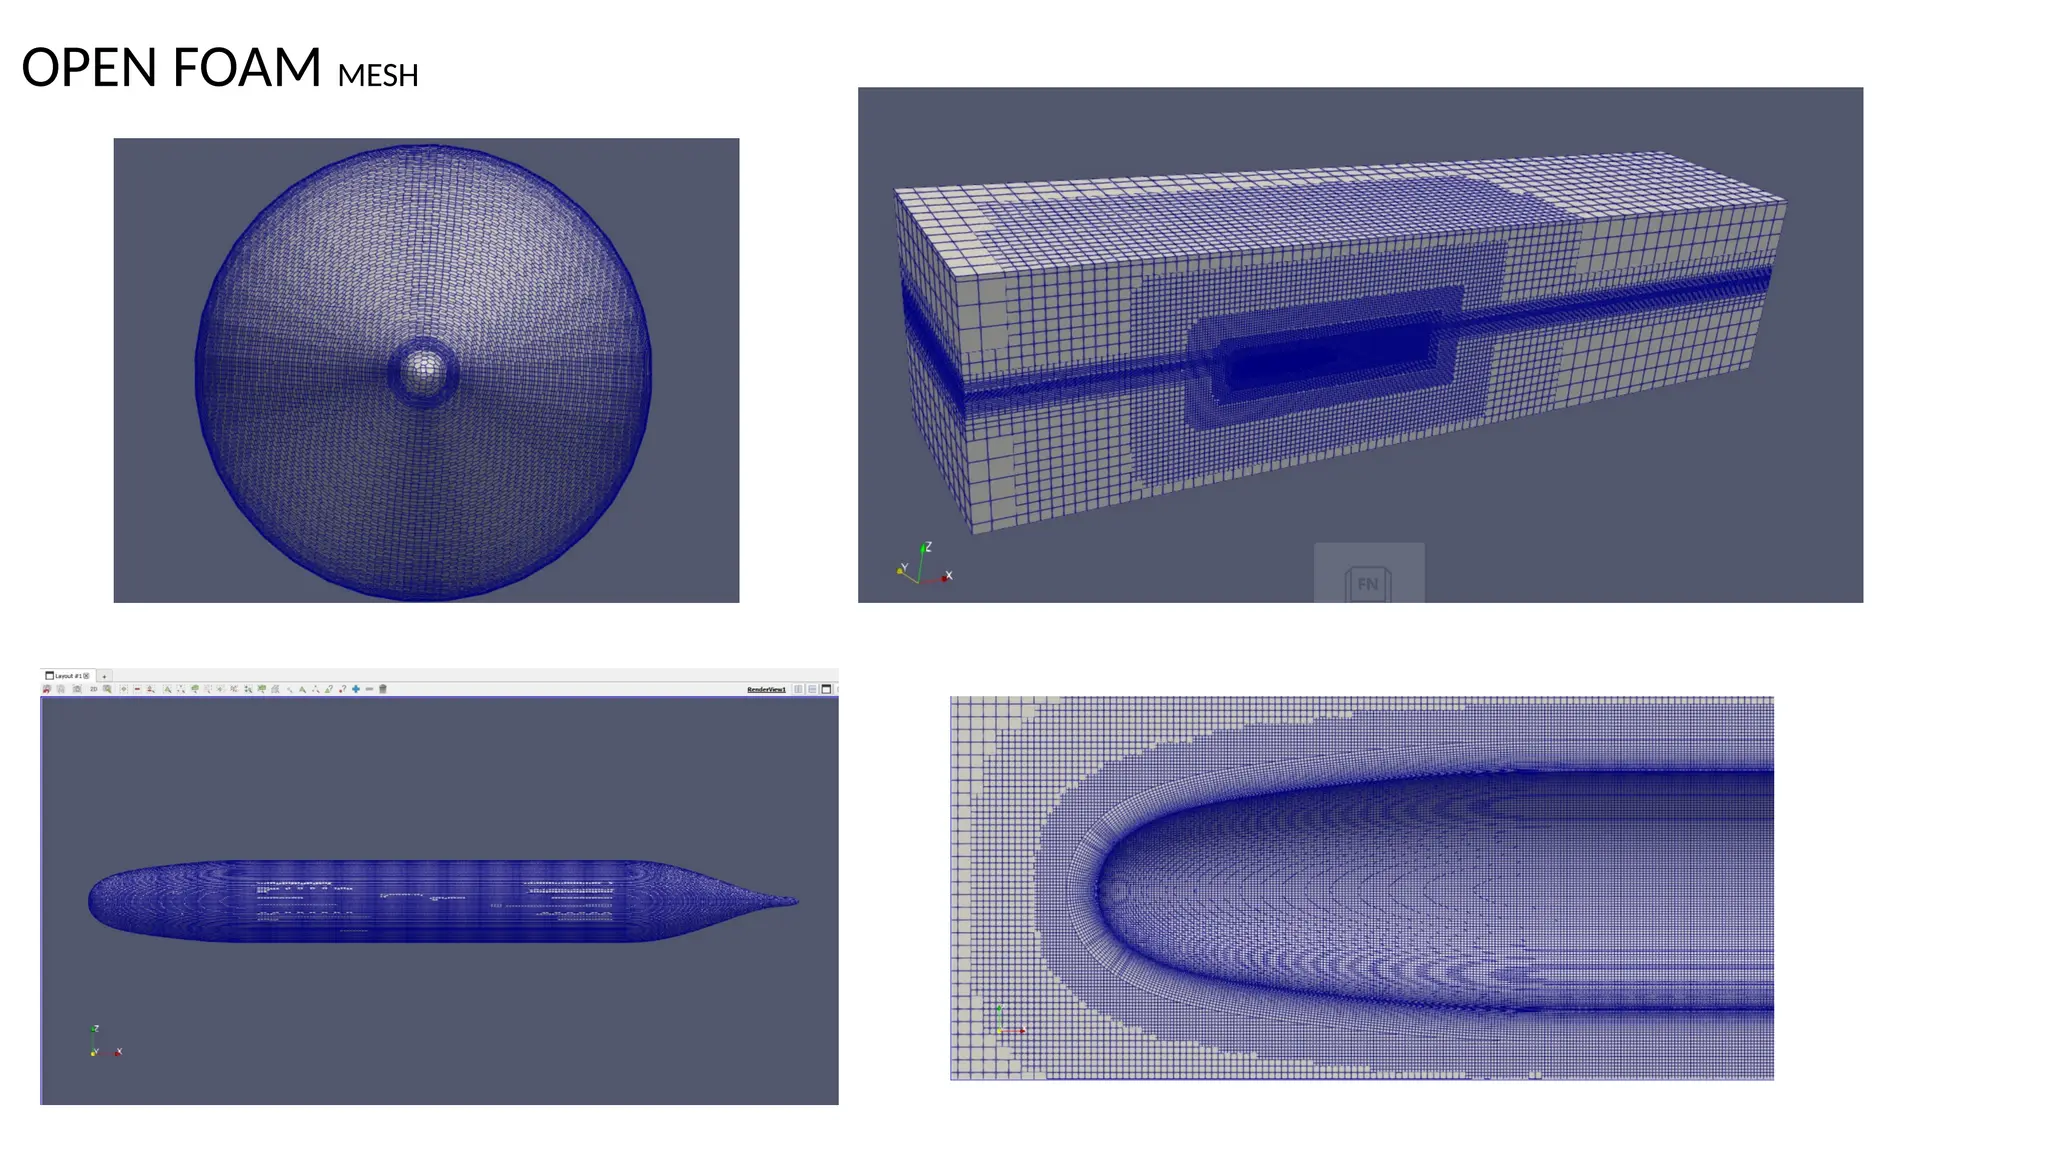
Mesh Generation in OpenFOAM:
• A detailed mesh was created using snappyHexMesh, including:
• Proper surface refinement for hull resolution.
• Prism layers for boundary layer capture (wall-resolved turbulence modeling).
• Volume mesh tailored for free-surface and wave-resistance simulations.
29.
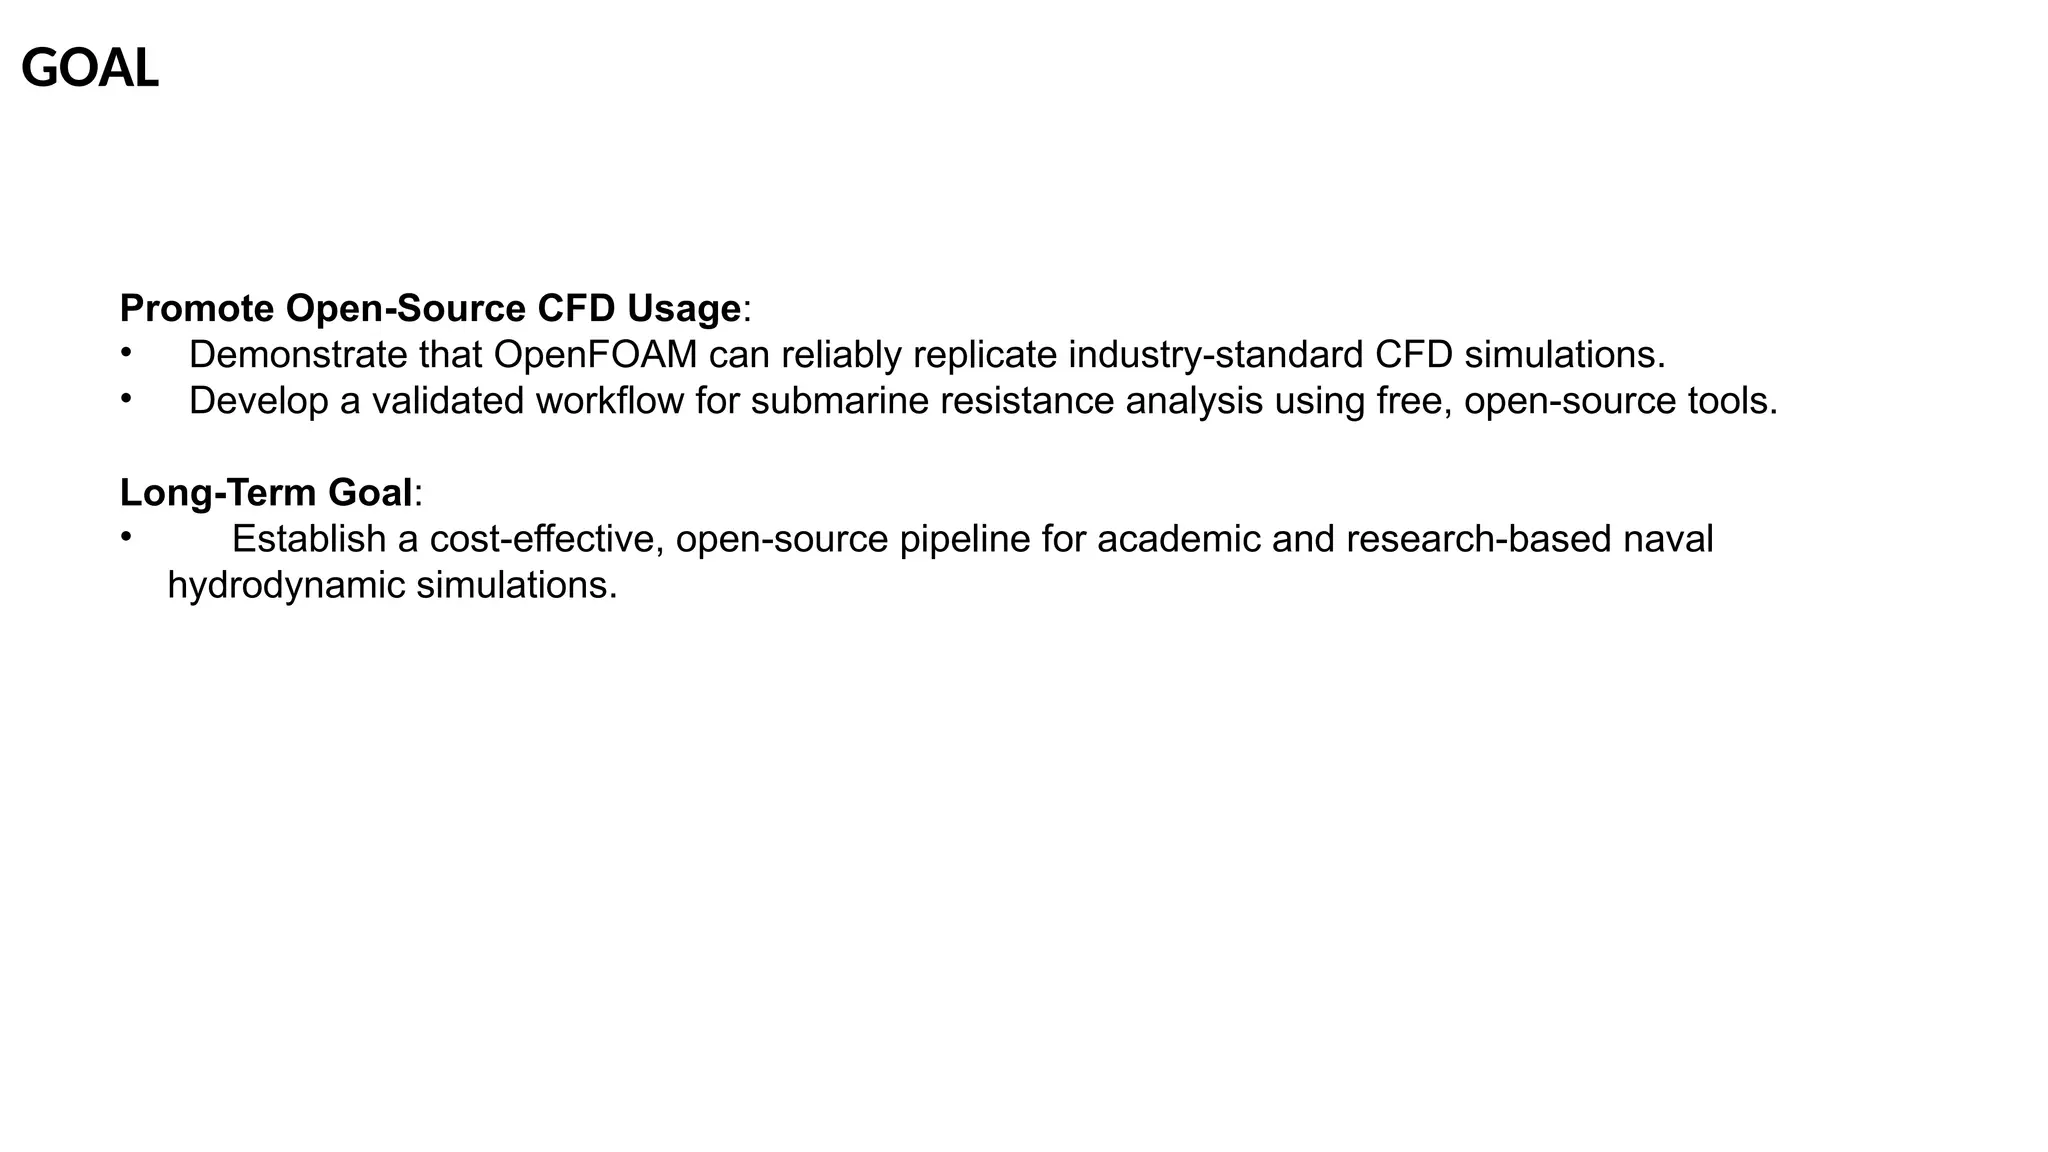
GOAL
Promote Open-Source CFDUsage:
• Demonstrate that OpenFOAM can reliably replicate industry-standard CFD simulations.
• Develop a validated workflow for submarine resistance analysis using free, open-source tools.
Long-Term Goal:
• Establish a cost-effective, open-source pipeline for academic and research-based naval
hydrodynamic simulations.
30.
REFERENCE
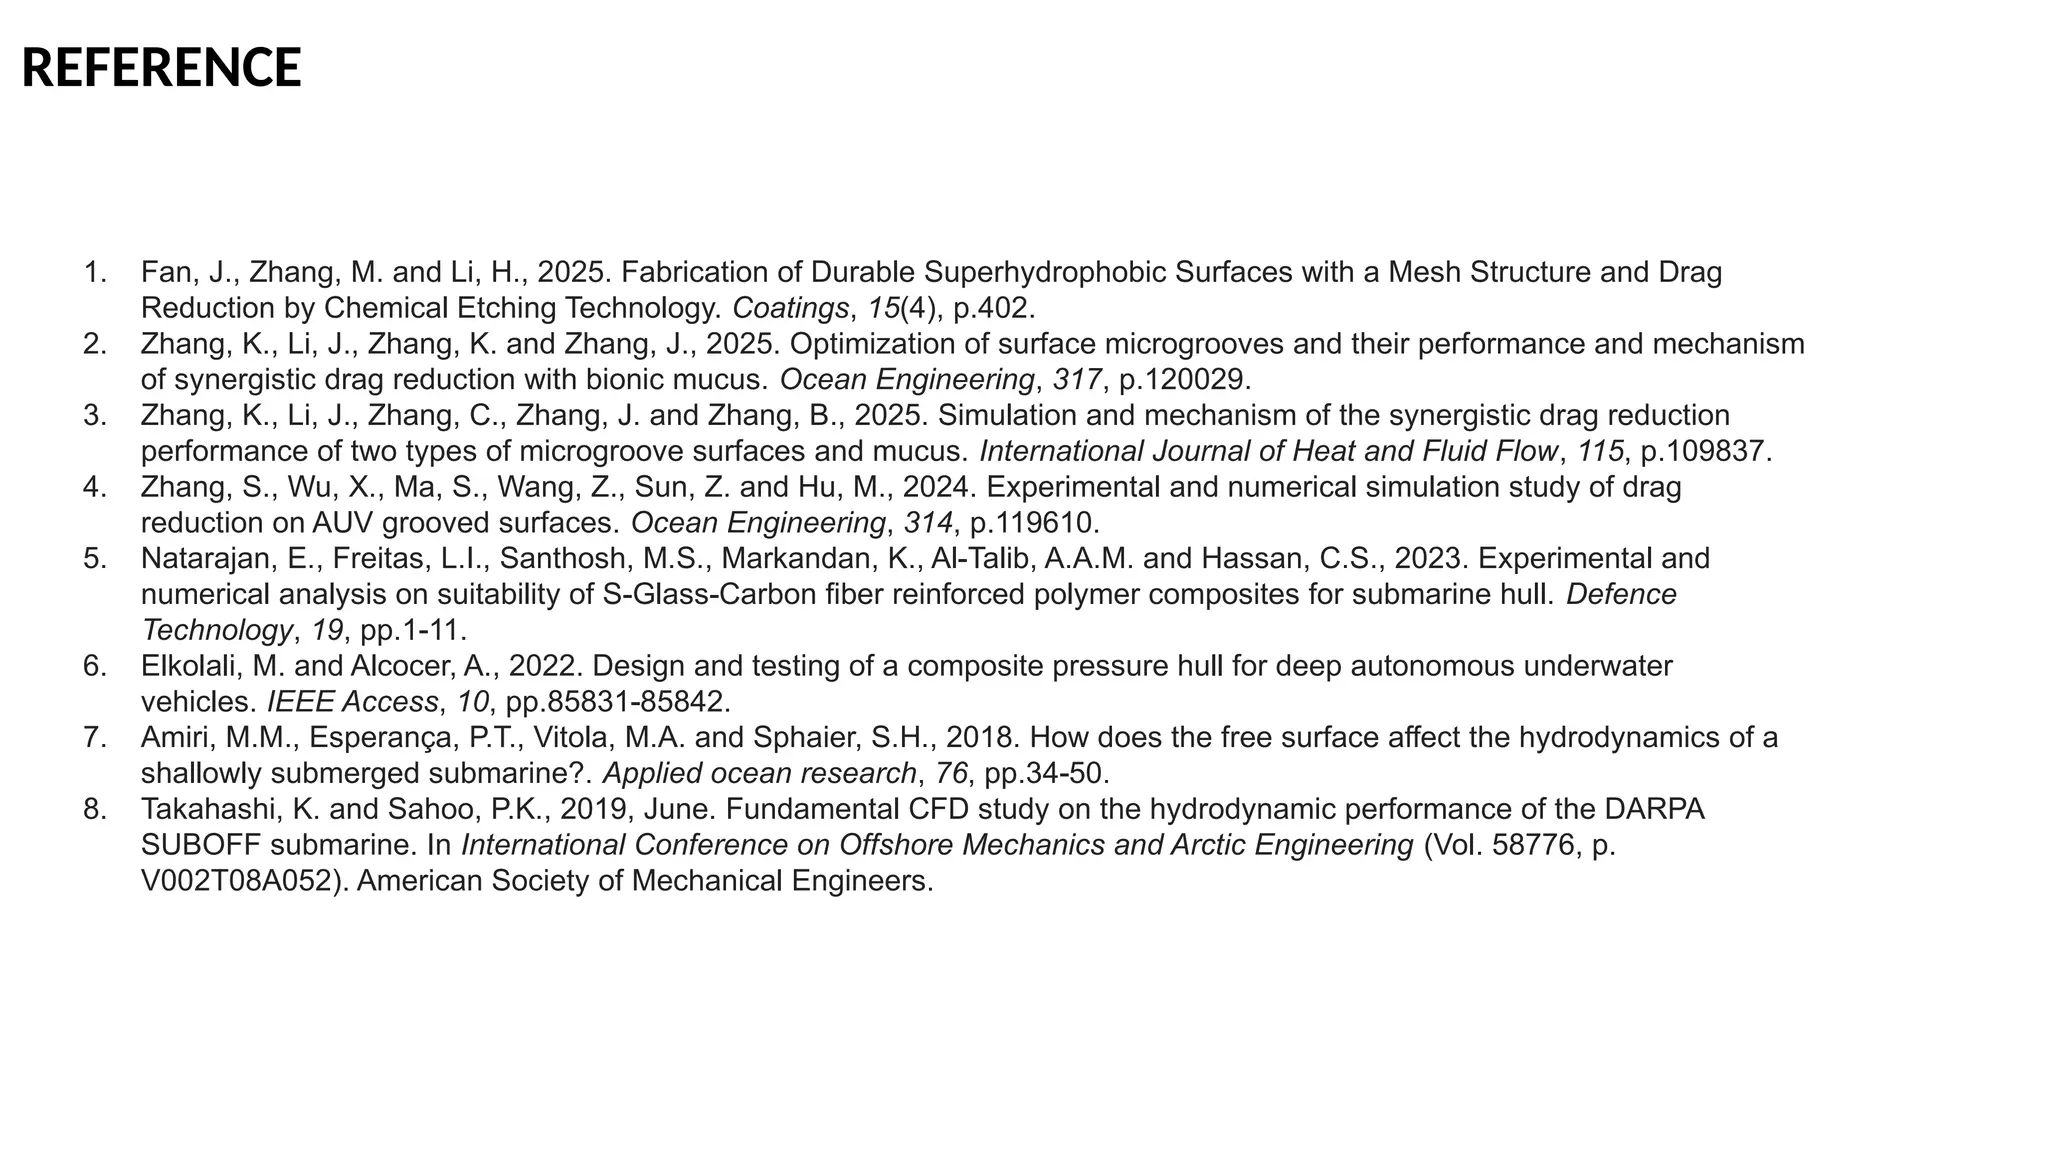
1. Fan, J.,Zhang, M. and Li, H., 2025. Fabrication of Durable Superhydrophobic Surfaces with a Mesh Structure and Drag
Reduction by Chemical Etching Technology. Coatings, 15(4), p.402.
2. Zhang, K., Li, J., Zhang, K. and Zhang, J., 2025. Optimization of surface microgrooves and their performance and mechanism
of synergistic drag reduction with bionic mucus. Ocean Engineering, 317, p.120029.
3. Zhang, K., Li, J., Zhang, C., Zhang, J. and Zhang, B., 2025. Simulation and mechanism of the synergistic drag reduction
performance of two types of microgroove surfaces and mucus. International Journal of Heat and Fluid Flow, 115, p.109837.
4. Zhang, S., Wu, X., Ma, S., Wang, Z., Sun, Z. and Hu, M., 2024. Experimental and numerical simulation study of drag
reduction on AUV grooved surfaces. Ocean Engineering, 314, p.119610.
5. Natarajan, E., Freitas, L.I., Santhosh, M.S., Markandan, K., Al-Talib, A.A.M. and Hassan, C.S., 2023. Experimental and
numerical analysis on suitability of S-Glass-Carbon fiber reinforced polymer composites for submarine hull. Defence
Technology, 19, pp.1-11.
6. Elkolali, M. and Alcocer, A., 2022. Design and testing of a composite pressure hull for deep autonomous underwater
vehicles. IEEE Access, 10, pp.85831-85842.
7. Amiri, M.M., Esperança, P.T., Vitola, M.A. and Sphaier, S.H., 2018. How does the free surface affect the hydrodynamics of a
shallowly submerged submarine?. Applied ocean research, 76, pp.34-50.
8. Takahashi, K. and Sahoo, P.K., 2019, June. Fundamental CFD study on the hydrodynamic performance of the DARPA
SUBOFF submarine. In International Conference on Offshore Mechanics and Arctic Engineering (Vol. 58776, p.
V002T08A052). American Society of Mechanical Engineers.