Omics int conference series analbioanal dr sudeb mandal jr scientist vimta ...
RESEARCH PROJECT
1. 1
CHAPTER 1
INTRODUCTION
1.1 BACKGROUND OF STUDY
Counterfeit or substandard drugs popularly known as fake drugs have become order of the day for some
of the selfish pharmaceutical dealers. Reports have shown that various substandard drugs are available in
markets worldwide. Treatment failure and drug resistance are frequently reported in developing
countries largely as a result of the prevalence of substandard or counterfeit drugs particularly in African
and Asian countries (Caudron et al., 2008). In a random quality testing conducted in Nigeria, 48% of the
samples of different categories of drug products were found to be outside the British Pharmacopoeia
(BP) specifications for drug assay and about 40% of these products were manufactured in India (Taylor
et al., 2001). Another study also reported that most of the bulk active ingredients produced by China and
India are used in the manufacture of counterfeit pharmaceuticals worldwide (Charatan, 2001). Hence,
the WHO has suggested a rapid alert system for the relevant authorities in Asian countries to combat the
global threat posed by counterfeit pharmaceutical products (Parry, 2005).
In Nigeria, the prevalence of substandard and counterfeit drugs in the market has resulted in the belief
that innovator pharmaceutical products are more effective, being in most cases, imported and relatively
expensive. However, a large percentage of the population lack the purchasing power to afford these
branded products. As a result generic drugs, many of which are manufactured in Asia, have offered
opportunities for significant cost savings over innovator drug products. Inadequate surveillance and
monitoring, as well as lack of adequate information to the public have contributed to the flourishing
market of these substandard drug products. In Nigeria, the National Agency for Food and Drug
Administration and Control (NAFDAC), an agency of the Federal Ministry of Health, was established to
regulate and control the manufacture, importation, exportation, distribution, advertisement, sale and use
of drugs. An important land mark in the renewed fight against substandard pharmaceuticals by
NAFDAC was the prohibition of the importation of some generics including paracetamol tablets and
syrups (NAFDAC, 2007). This restriction has proved to be effective in encouraging pharmaceutical
companies in the country to embark on local production of these drug products. The generic
manufacturers do not incur the cost of drug discovery, bear the burden of proving the safety and efficacy
of the drugs through clinical trials and may also receive the benefit of the previous marketing efforts of
the innovator company, and this makes the prices of generic products to be significantly lower than those
of innovator brands. However, generic drug products must satisfy the same standards of quality, efficacy
and safety as those applicable to the innovator products.
2. 2
Paracetamol also known as acetaminophen is a well-known analgesic and antipyretic agent used for the
treatment of pains and aches in adults and children. With the prevalence of several brands of
paracetamol tablets in the Nigerian market, there is need to evaluate the physical and chemical
parameters of these different brands of the paracetamol to determine the potency and efficacy of these
products.
1.2 AIMS AND OBJECTIVES
The study is aimed at the analysis and determination of the physical and chemical parameters of
different brands of paracetamol tablets sold in Lagos State markets and compares the results with United
States Pharmacopeia to evaluate the potency and efficacy of the tablets.
1.3 SCOPE OF WORK
Different brands of paracetamol tablets sold in the Lagos markets were bought and analyzed in the study,
considering the following parameters; appearance, average weight, identification by ultra violet
absorption, hardness, friability, disintegration time, percentage assay and dissolution rate.
3. 3
CHAPTER 2
LITERATURE REVIEW
Paracetamol is a white, odorless crystalline powder with a bitter taste, chemically known as 4-hydroxy
acetanilide or N-acetyl-p-aminophenol and in the US Pharmacopoeia it is known as acetaminophen. It is
soluble in 70 parts of water (1 in 20 boiling water), 7 parts of alcohol (95%), 13 parts of acetone, 40
parts of glycerol, 9 parts of propylene glycol, 50 parts of chloroform, or 10 parts of methyl alcohol. It is
also soluble in solutions of alkali hydroxides. It is insoluble in benzene and ether. A saturated aqueous
solution of paracetamol has a pH of about 6 and is stable (half-life over 20 years) but stability decreases
in acid or alkaline conditions, and the paracetamol being slowly broken down into acetic acid.
Paracetamol belong to non-steroidal anti-inflammatory drug (NSAID) and it is prescribed most
frequently for pain relieve. It is also used as antipyretic agent with analgesic and in the relief of
headaches, fever and other aches. While it has analgesic and antipyretic properties comparable to those
of aspirin or other NSAIDs, its peripheral anti-inflammatory activity is usually limited by several
factors, one of which is high level of peroxides present in inflammatory lesions (Tripathi, 2004).
Paracetamol is generally safe for human use at the recommended doses. While generally safe for use at a
recommended dose, toxicity of paracetamol is the foremost cause of acute gastro intestinal problems
(Sarg et al., 2007). Paracetamol is considered to be the inhibitor of cyclooxygenase (COX), and recent
findings suggest that it is highly selective for COX-2. Overdoses of paracetamol cause fatal liver damage
and in rare individuals, normal dose can do the same (Daly et al., 2008). Paracetamol is processed and
manufactured in different dosage form: tablet, caplets, capsules, drops, elixirs, suspension and
suppositories. Dosage form of paracetamol and its combinations with other drugs have been listed in
various pharmacopoeias. The main purpose of solid dosage forms of paracetamol is to make available to
the human body a certain and defined amount of the active ingredient, through the gastro-intestinal
system. Studies on the bioavailability of drugs from a given dosage form revealed, that in many
situations, solid dosage form with the same content of active ingredient did not give the same therapeutic
effect. This fact is traced to the differences in physical characteristics of the active compound in
formulation factors or in technological processes employed by different manufacturers.
There is serious need for constant market surveillance to ensure that the quality of drugs in the market
complies with specifications at all times. Random quality testing of drugs conducted in Nigeria revealed
that 48% of the samples of different categories of drug products were found to be outside the British
Pharmacopoeia (BP) specifications for drug assay and about 40% of these products were manufactured
in India. Another study also reported that most of the bulk active ingredients produced by China and
India are used in the manufacture of counterfeit pharmaceuticals worldwide.
4. 4
The safety and efficacy of a pharmaceutical dosage form depend on its quality. The efficacy of
pharmaceutical dosage forms generally depends on their formulation properties, and manufacturing
methods, hence it is likely that the quality of dosage form may vary (Yogananda et al., 2009).
Pharmaceutical availability or in-vitro availability is one of the aspects of drug bioavailability.
Dissolution test which is one of the in-vitro tests is usually used to assess the quality of oral
pharmaceutical dosage forms such as tablets and capsules. In-vitro dissolution tests can be used as a
guide line for formulation developments, and also identify manufacturing variables, quality monitor
formulation from batch to batch and also predict the in vivo performances and also important for
bioavailability and bioequivalence. Dissolution test is considered to be a sensitive, reliable and rational
test for predicting drug bioavailability behavior. Since it is one of the most important quality control
tests performed on drugs and drug products, many apparatus for dissolution testing have been developed
over the years. Mainly three types have been retained in the official compendia which include; the
rotating basket, the paddle and the flow-through cell method. Each of these methods has their merits and
demerits. The choice of the method to be used is mainly governed by the characteristics of the drug
product. Pharmaceutical industry focus on the evaluation of drug release kinetics from the dosage drugs
and this study is generally performed on official or non-official devices. The dissolution tests have been
widely used in the areas of quality control and research and development of drugs and drug products.
The in-vitro dissolution of drug from dosage forms is employed either as a primary aid in the
characterization of formulations or a quality control procedure for monitoring the uniformity and
reproducibility of production batches or both. The British Pharmacopeia (B.P.) (2012) specifies that not
less than 70% of the labeled amount of paracetamol should be released within 45 minutes of a
dissolution profile while United States Pharmacopeia (U.S.P.) (2013) specifies that not less than 80% of
the labeled amount of paracetamol should be released within 30 minutes of a dissolution profile.
Disintegration tests are performed to find out within how much time the tablet disintegrates as it is very
important and necessary for all the analysis of tablets, coated or uncoated to be swallowed because the
dissolution rate depends upon the time of disintegration, which ultimately affects the rate of absorption
of drugs. The disintegration time of tablets determines to a large extent, the surface area of contact
between the solid and liquid in the dissolution process and could be the rate-determining step in the
process of drug absorption.
Assay is another important in-vitro test carried out to assess the quality and efficacy of the oral
pharmaceutical dosage forms such as tablets, suspensions and capsules. It is the measure of amount of
the active pharmaceutical ingredients (APIs) present in the oral pharmaceutical dosage forms, and this is
a key factor in determining the efficacy and potency of the drugs. British Pharmacopeia (B.P.) (2012)
5. 5
specifies assay of any oral paracetamol dosage form to be within 95 – 105% while the United States
Pharmacopeia (U.S.P.) (2013) specifies 90 – 110%. The usual assay for a dissolution sample is either
determined by ultra violet spectrophotometric or by high performance liquid chromatography (HPLC).
The preferred method of analysis is ultra violet spectrophotometric determination because the results can
be obtained faster and the analysis is simpler, with fewer solvents being used (U.S.P.) (2013). HPLC
methods are used when there is significant interference from excipients or among drugs in the
formulation to improve analytical sensitivity and/or when the analysis can be automated.
Generally, tablet including paracetamol tablets places a certain demand on the bonding, structure and
integrity of the compressed matrix. Tablets must be able to withstand the rigors of handling and
transportation experienced in the manufacturing plant, in the drug distribution system, and in the field at
the hands of the end users (patients/consumers). Manufacturing processes such as blistering, packaging
and printing can involve considerable stresses, which the tablets must be able to withstand. For these
reasons, the mechanical strength of tablets is of considerable importance and is routinely measured.
Tablet strength serves both as a criterion by which to guide product development and as a quality control
specification. One commonly employed test of the ability of tablets to withstand mechanical stresses
determines their resistance to chipping and surface abrasion by tumbling them in a rotating cylinder, and
the percentage of weight loss after tumbling is referred to as the friability of the tablets. Another measure
of the mechanical integrity of tablets is their breaking force, which is the force required to cause the
tablets to break in a specific plane, and this breaking force of the tablets is known as the hardness of the
tablets.
Numerous methods like titrimetry (Srivastav et al., 2012), fluorimetry, colorimetry, UV
spectrophotometry, quantitative thin-layer chromatography (TLC), high-performance liquid
chromatography (HPLC) (Narayan et al., 2012) and gas chromatography (GC) (Bisceglia et al., 2010)
have been reported for the analysis of paracetamol alone and its combinations in pharmaceuticals. The
fluorimetric methods were developed either by oxidation of acetaminophen with alkaline
hexacyanoferrate(III) or hydrolysis followed by reaction with benzylamine (Llorent-Martinez et al.,
2007). These methods are subject to interferences, the materials present in syrup formulations causing
the most interference. In the standard method, paracetamol is determined titrimetrically with Ce (IV) in
acidic medium, using ferroin as indicator. The titration is performed in cold conditions and hence the
estimation takes long time with limited accuracy (British Pharmacopeia, 2012) and this call for the need
for a quicker and accurate method. Method development is the setting up of an analytical procedure that
will be appropriate for the analysis of a particular sample and makes the analysis simpler, sensitive and
easier. There are many Spectrophotometry methods of determining acetaminophen contents in drug
6. 6
formulation especially tablets some of which are based on hydrolysis of paracetamol to p-aminophenol
and the latter is reacted with specific reagents to produce coloured substance and the absorbance of
which is measured in visible region at appropriate wavelength. (Xu and Li, 2004). Literature reveled that
most of analytical work has been performed using H.P.L.C. method which is complex, time consuming
and very costly. Besides in many official compendia organic solvents have been used for the analysis of
paracetamol which are toxic, and costly. For this reason, a less toxic, cheap, eco-friendly but equally
sensitive spectroscopic method for quantitative analysis of paracetamol for regular quality control
purpose in laboratories was developed. In line to this a new method which is easier, sensitive, cost
effective and ecofriendly that can be easily performed in laboratory using simple instrument like UV-
spectrophotometer was employed. Ultraviolet spectrophotometric procedures have been adopted by the
British Pharmacopoeia and US National Formulary XI for the determination of paracetamol in tablets.
Although the official ultraviolet spectrophotometric assay for paracetamol (acetaminophen) is fast and
simple, its accuracy is greatly influenced by the interferences from active substances or common
excipients such as diluents and binders in tablets or colouring matter, sweetening agents and
preservatives in syrups and drops. For the determination of paracetamol in multicomponent
pharmaceutical preparations computer-controlled instrumentation and multivariate calibration methods
are playing a very important role (Mot et al., 2010). Various colour reactions have been proposed for the
determination of paracetamol, including indophenol dye, and Schiff`s base formation, nitrosation and
subsequent chelation, oxidation, oxidative coupling. Most of these methods require lengthy treatments
and lack the simplicity needed for routine analysis. The majority of published spectrophotometric
methods are based on the preliminary hydrolysis of paracetamol to p-aminophenol and coupling of the
latter with various phenolic reagents (Cekic et al., 2005; Shrestha and Pradhananga, 2009). Although
these methods are rather selective but both processes are slow. The hydrolysis of paracetamol in acid
solution is completed after 0.5 - 2 hours of boiling. In addition, coupling reaction also slows down the
determination and required additional 10 - 15 minutes for finishing.
7. 7
CHAPTER 3
MATERIALS AND METHODS
Nine different brands of 500mg paracetamol tablets samples A to I were bought from different
pharmaceutical shops in different locations of Lagos State and were all manufactured in the year 2014
according to the manufacturers’ labeled claims. The paracetamol tablets were individually analyzed in a
standard laboratory with modern state of art facilities to determine the physical and chemical parameters
of the tablets. The physical and chemical analysis carried out on the tablets includes the appearance,
average weight, hardness, friability, disintegration time, assay and dissolution.
The appearance is the simplest among all the physico-chemical analysis and it is simply the way or form
in which the tablets appear to the eyes. Ideally, 500mg paracetamol tablets appear in white round form
with the manufacturers’ name or trade mark embossed on one side of the tablet and P with 500 on the
other side with a break line separating them.
Average weights of the tablets sample is simply determined by taking 20 tablets sample at random and
weigh individually to get individual weights, and finally take the average. The average weight of
paracetamol tablet should be within 563mg plus or minus 5%.
Hardness of tablets is measure of the mechanical integrity of tablets, and it is the force required to cause
the tablets to break in a specific plane and it is also referred to as the breaking force of the tablets. The
tablets are generally placed across the diameter of the tablets between two platens of the hardness or
breaking force tester with model number EL-500, one of which moves to apply sufficient force to the
tablet to cause fracture. The hardness of tablets is expected not to be less than 4kg/f.
Friability of tablets is also another measure of the mechanical integrity of tablets, and it is the ability of
tablets to withstand the rigors of handling and transportation experienced in the manufacturing plants,
drugs distribution system and in the field at the hands of the end users. The United States Pharmacopeia
(U.S.P.) specifies that the friability of tablets should not exceed 1% to enhance the quality of the tablets.
Friability test of tablets is carried out in Erweka friability apparatus by tumbling weighed amount of the
tablets in a rotating cylinder at revolutions of 100, after which the tumbled tablets are reweighed. The
percentage weight loss after tumbling is referred to as the friability of the tablets. The friability of the
tablets was evaluated using the formula below;
Friability = [(Initial weight – Final weight) / Initial weight] x 100%
Disintegration tests are performed to find out within how much time the tablet disintegrates as it is very
important and necessary for all the analysis of tablets, coated or uncoated to be swallowed because the
dissolution rate depends upon the time of disintegration, which ultimately affects the rate of absorption
of drugs. The disintegration time of tablets determines to a large extent, the surface area of contact
8. 8
between the solid and liquid in the dissolution process and could be the rate-determining step in the
process of drug absorption. The disintegration test is carried out with the Erweka disintegration test
apparatus that consists of rotating baskets. One tablet sample is placed in each of the 6 tubes of the
basket and the tablets are individually covered with the disks with temperature of the water in beaker
being maintained at 37 plus or minus 20C, and the apparatus is allowed to start operation. The
disintegration time of tablets should not be more than 15minutes according to the United States
Pharmacopeia (U.S.P.).
Assay is an important in-vitro test carried out to assess the quality and efficacy of the oral
pharmaceutical dosage forms such as tablets, suspensions and capsules. It is the measure of amount of
the active pharmaceutical ingredients (APIs), which is paracetamol in this case present in the oral
pharmaceutical dosage forms (tablets), and this is a key factor in determining the efficacy and potency of
the drugs. United States Pharmacopeia (U.S.P.) (2013) specifies assay of any oral paracetamol dosage
form to be within 90 – 110%. Ultra violet spectrophotometric method is used in determination of the
assay of the paracetamol tablets sample using UV-1800 spectrophotometer. This is achieved by
preparing the buffer, standard and tablets sample. The buffer is prepared by weighing accurately 6.8g of
potassium di-hydrogen phosphate (KH2PO4) into 1000ml volumetric flask. The standard is prepared by
weighing accurately 125mg of paracetamol into a clean and dry 200ml volumetric flask, adding 100ml
of diluent and sonicate for 30minutes to dissolve and make up the volume to the mark. Further dilute
1ml to 100ml with the diluent. The tablets sample is prepared by weighing accurately 20 tablets and
crush into powder. 141mg of the powder is weighed into a clean and dry 200ml volumetric flask, adding
100ml of the diluent and sonicate for 30minutes to dissolve and make up the volume up the mark. Filter
the solution and further dilute 1ml to 100ml with the diluent. The amount of paracetamol dissolved from
the UV absorbance at wavelength of maximum absorbance at about 243nm is determined. The
percentage assay was determined and evaluated using the relation below;
% Assay = (sample absorbance x std. wt. x 1 x 200 x 100 x avg. wt. x working standard purity) /
(standard absorbance x 200 x 100 x sample weight x 1 x labeled claim of 500mg).
Dissolution test is another in-vitro test usually used to assess the quality of oral pharmaceutical dosage
forms such as tablets and capsules. In-vitro dissolution tests can be used as a guide line for formulation
developments, and also identify manufacturing variables, quality monitor formulation from batch to
batch and also predict the in vivo performances and also important for bioavailability and
bioequivalence. Dissolution test is considered to be a sensitive, reliable and rational test for predicting
drug bioavailability behavior. The dissolution tests have been widely used in the areas of quality control,
research and development of drugs and drug products. United States Pharmacopeia (U.S.P.) specifies
9. 9
that not less than 80% of the labeled amount of paracetamol should be dissolved within 30 minutes of
the dissolution profile. Distek 5100 dissolution system is used in analyzing and determining the
dissolution of the paracetamol tablets. This is achieved by preparing the dissolution media, standard and
tablets sample ensuring that the following conditions are maintained; 50rpm of rotating speed,
30minutes time, temperature at 370C plus or minus 0.50C, 900ml volume and phosphate buffer pH of
5.8. The dissolution media is prepared by accurately measuring 6 liters of water into a beaker, adding
47.635g of potassium di-hydrogen phosphate (KH2PO4) and 0.87gram of sodium hydroxide pellets, and
stir with glass rod to dissolve completely. The standard is prepared by weighing 50mg of paracetamol in
100ml volumetric flask, adding 50ml of the dissolution medium and sonicate for 15minutes to dissolve
and make up the volume with dissolution medium. Further dilute 1ml to 100ml with the dissolution
medium. The tablets sample preparation is achieved by weighing 1 tablet and insert into the dissolution
container in 900ml of dissolution medium. After 30minutes, 10ml of the solution is withdrawn and
filtered with the aid of a filter paper. Further dilute 1ml to 100ml with the dissolution medium. The
amount of paracetamol dissolved is determined from the UV absorbance at the wavelength of maximum
absorbance at about 243nm. The percentage dissolution of tablets was determined and evaluated using
the below relation;
% Dissolved = (sample absorbance x std. wt. x 900 x 100 x 100 x working standard purity) / (standard
absorbance x 100 x 100 x tablet weight x 1 x labeled claim of 500mg).
11. 11
Table 4.2: Hardness (Breaking Force) of Samples
S/No Sample
A (kg/f)
Sample
B (kg/f)
Sample
C (kg/f)
Sample
D (kg/f)
Sample
E (kg/f)
Sample
F (kg/f)
Sample
G (kg/f)
Sample
H (kg/f)
Sample
I (kg/f)
1. 12.54 4.82 11.69 9.34 15.14 7.64 14.55 13.68 6.20
2. 13.21 4.71 12.40 9.90 10.66 5.87 12.60 11.38 7.13
3. 11.57 5.06 12.25 10.61 16.02 9.77 10.17 10.36 7.34
4. 13.60 5.70 11.58 9.87 13.96 8.15 10.01 10.24 7.81
5. 12.06 5.59 12.19 11.90 14.99 6.97 11.92 10.30 8.16
6. 13.73 5.13 12.45 9.87 11.76 6.33 12.93 11.69 7.38
7. 10.51 5.43 11.66 11.47 14.01 7.87 9.91 9.82 6.70
8. 13.58 4.80 12.58 10.72 16.58 6.93 11.72 10.74 7.87
Sum 100.8 41.24 96.80 83.68 113.12 59.53 93.81 88.21 58.59
Average 12.60 5.16 12.10 10.46 14.14 7.44 11.73 11.03 7.32
Table 4.3: Friability of Samples
Sample
A
Sample
B
Sample
C
Sample
D
Sample
E
Sample
F
Sample
G
Sample
H
Sample
I
Initial
Weights
(mg)
5549.6 5667.7 5529.1 5478.6 5786.4 5171.2 5800.5 5855.1 5612.7
Final
Weights
(mg)
5530.3 5643.8 5518.7 5464.7 5767.3 5168.1 5767.6 5824.0 5590.2
Friability
(%)
0.35 0.42 0.19 0.25 0.33 0.06 0.57 0.53 0.40
Table 4.4: Disintegration Time of Samples
Sample
A
Sample
B
Sample
C
Sample
D
Sample
E
Sample
F
Sample
G
Sample
H
Sample
I
Disintegration
Time (mins)
1.32 2.30 1.07 1.53 2.22 1.30 6.30 8.15 1.02
12. 12
Table 4.5: Assay of Samples
Sample
A
Sample
B
Sample
C
Sample
D
Sample
E
Sample
F
Sample
G
Sample
H
Sample
I
Assay
(%)
93.6 56.9* 93.2 99.2 101.3 58.4* 96.6 99.2 99.7
Table 4.6: Dissolution Rate of Samples
Sample
A
Sample
B
Sample
C
Sample
D
Sample
E
Sample
F
Sample
G
Sample
H
Sample
I
Dissolution
(%)
95.0 55.0* 95.0 99.0 91.0 55.0* 94.0 101.0 97.0
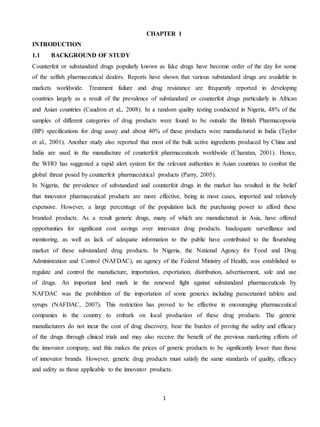
Figure 4.1: Disintegration time of different tablet samples
4.2 DISCUSSIONS
The nine tablet samples were all observed to appear in white round form with the manufactures’ names
or trademarks embossed on one side of the tablet and P with 500 on the other side with a break line
separating them.
From the results of the analysis, it is observed that all the tablet samples apart from sample F were
within the prescribed standard of 563mg plus or minus 5 percent for the average weight of paracetamol
tablets.
0
1
2
3
4
5
6
7
8
9
Disintegration Time (mins)
Disintegration Time
(mins)
13. 13
All the tablet samples were observed to be within the prescribed standard limit of not less than 4kg/f for
the breaking force or hardness of tablets.
The friability results of the tablet samples show that all the samples were within the specified limit of not
more than 1% according to the United States Pharmacopeia (U.S.P.). Sample F is seen to exhibit the best
friability status followed by sample C, while sample G exhibit the least but were all good and acceptable
according to the U.S.P.
The disintegration results show that all the tablet samples were within the specified standard of not more
than 15 minutes of time, though some tablets were seen to disintegrate faster than the others. From the
disintegration results and chart, it is seen that sample I has the best disintegrating status followed by
sample C, while sample H has the least status but were all good and acceptable according to the
standard.
Assay is a very important in-vitro quality control test that measures the amount of the active
pharmaceutical ingredients (API), which is paracetamol in this case present in the paracetamol tablets.
Assay is the key important factor that determines the potency and efficacy of the tablets, and also
determines or predicts the status quo of the dissolution tests. From the assay results, sample B and F
were seen to fail the assay test of the analysis, while the other samples were seen to pass or be within the
specified limit of 90 – 110% by the United States Pharmacopeia (U.S.P.), with sample E and I showing
the best status of assay followed by sample G.
Dissolution test is another in-vitro test usually used to assess the quality of tablets and it is considered to
be a sensitive, reliable and rational test for predicting drug bioavailability behavior. From the dissolution
results of the analysis, it is seen that sample B and F also fail the dissolution test, while the other samples
pass the test and were seen to be within the specified standard of not less than 80% of 500mg of the
paracetamol tablet been dissolved within 30 minutes of the dissolution profile by the U.S.P.
14. 14
CHAPTER 5
CONCLUSIONS
The chemical analysis (assay and dissolution rate) of the tablet samples reveal to a great extent that
sample B and F have low qualities and may lack the potencies and efficacies to work well as the non-
steroidal anti-inflammatory drug it is designed for. This implies that the amount of paracetamol
substance (active pharmaceutical ingredient) present in the tablet formulations were small relative to the
standard, and this caused the tablets to dissolve less than 80% of the labeled claim (500mg) of the
paracetamol tablets within 30 minutes of the dissolution profile. From the chemical analysis, sample E
and I prove to have the best efficacy and potency power to cure the diseases associated with their
functions because of their percentage assay proximity to 100% and can be regarded as the first choice
drugs in this case. Sample I also has the fastest disintegrating time of 1.02 minutes, which also make it
the best in that perspective followed by sample C that has disintegrating time of 1.07 minutes.
Conclusively, sample B and F are proved from the analysis to be substandard, while the other seven
samples (A, C, D, E, G, H and I) are proved to be up to standard and very effective in carrying out their
designed functions.
15. 15
APPENDIX A
Average is expressed as the sum of values divided by the number of times action is carried out.
Mathematically, Average = ΣV/N
Where ΣV is the sum of values, and N is the no of times of actions.
Friability of the tablets was evaluated using the below formula;
Friability = [(Initial weight – Final weight) / Initial weight] x 100%
Where the initial weight is the weight of the tablets before tumbling in the friability apparatus, and the
final weight is the weight of the tablets after tumbling.
Percentage assay of the tablets was evaluated using the below relation;
% Assay = (sample absorbance x std. wt. x 1 x 200 x 100 x avg. wt. x working standard purity) /
(standard absorbance x 200 x 100 x sample weight x 1 x labeled claim of 500mg).
Dissolution rate of the tablets was evaluated using the relation below;
% Dissolved = (sample absorbance x std. wt. x 900 x 100 x 100 x working standard purity) / (standard
absorbance x 100 x 100 x tablet weight x 1 x labeled claim of 500mg).
16. 16
APPENDIX B
Table B.1: Assay Analysis
Sample
A
Sample
B
Sample
C
Sample
D
Sample
E
Sample
F
Sample
G
Sample
H
Sample
I
Standard
Weight
(mg)
125.3 125.3 125.3 125.5 125.5 125.3 125.5 125.5 125.3
Standard
Absorbance
0.427 0.427 0.427 0.445 0.445 0.427 0.445 0.445 0.451
Average
Weight
(mg)
544.1 565.6 551.0 547.8 587.5 521.4 590.7 591.6 568.2
Sample
weight
(mg)
141.0 141.5 141.0 141.1 141.3 141.1 141.2 141.4 141.3
Sample
Absorbance
0.414 0.243 0.407 0.454 0.433 0.270 0.410 0.421 0.449
Standard
Potency
99.8 99.8 99.8 99.8 99.8 99.8 99.8 99.8 99.8
Assay (%) 93.6 56.9 93.2 99.2 101.3 58.4 96.6 99.2 99.7
Table B.2: Dissolution Rate Analysis
Sample
A
Sample
B
Sample
C
Sample
D
Sample
E
Sample
F
Sample
G
Sample
H
Sample
I
Std. Weight
(mg)
50.5 50.1 50.5 50.4 50.1 50.5 50.4 50.1 50.3
Standard
Absorbance
0.319 0.324 0.333 0.328 0.312 0.315 0.325 0.320 0.329
Sample wt.
(mg)
548.9 563.8 553.7 550.6 582.5 520.0 575.3 585.8 568.5
Sample
Absorbance
0.335 0.198 0.349 0.358 0.316 0.190 0.339 0.359 0.350
18. 18
REFRENCES
Adewuyi et al., Journal of Chemical and Pharmaceutical Research 2013; vol. 5(5), pp. 1 – 11.
Audu et al., International Research Journal of Pharmacy 2012; vol. 3(8): pp. 165 -167.
Bisceglia KJ, Yu JT, Coelhan M, Bouwer EJ, Roberts AL. Trace determination of pharmaceuticals and
other wastewaterderived micropollutants by solid phase extraction and gas chromatography/mass
spectrometry. Journal of Chromatography. 1217 (4):558-64 (2010).
British pharmacopoeia, Vol II; Her Majesty’s Stationary office: London, 2012, pp 1854.
Caudron J.M., Ford N., Henkens M., Macé C., Kiddle-Monroe R. and Pinel J., Tropical Medical
International Health 13 (2008) p 1062-72.
Çekiç, S. D.; Filik, H.; Apak, R., Journal of Analytical Chemistry, 2005, 60, 1019-1023.
Chandra, International Journal of Pharmacy and Pharmaceutical Sciences, vol. 5(3), 2013.
Daly FF, Fountain JS, Murray L, Grandins A,Buckley NA, Medical Journal of Australia, 2008,188(5),
296-301.
Garg G, Saraf S, Saraf S (2007). Simultaneous estimation of aceclofenac, paracetamol and
chlorzoxazone in Tablets. Indian Journal of Pharmaceutical Science 69(5), 692-694.
Lawrence J.,Moore E.,Port L.,Danchin M., paracetamol as a risk factor for allergic disorders.The lancet,
2009, pp.119-119.
Llorent-Martínez E. J., Šatinský D., Solich P., Ortega-Barrales P., and Molina-Díaz A., Journal of
Pharmaceuticals Medical Analysis, 2007, 45, 318-321.
Ogunneye et al., Journal of Research in Environmental Science and Toxicology 2012; vol. 1(10), pp.
251 – 257.
19. 19
Parry J., British Medical Journal 330 (2005) pp. 1044.
Raniah, World Academy of Science, Engineering and Technology 2012; vol. 6(9): pp. 185 – 187.
Shrestha, BR, Pradhananga RR (2009). Spectrophotometric method for the determination of
paracetamol, Journal of Nepal Chemical Society, 24: 39-44.
Srivastav A., Saxena S.R., Mishra S. and Singh Y., Orient Journal of Chemistry, 28(3): 1517-1529
(2012).
Safila et al., World Journal of Pharmaceutical Sciences 2014; vol. 2 (6), pp. 586 – 590.
Sharma et al., Orient Journal of Chemistry 2013; vol. 29 (2), pp. 787 – 792.
Tripathi K.D., (2004). Essentials of Medical Pharmacology, 5th Edition, Jaypee Brothers Medical
Publishers, NewDelhi, 2004, Pp. 142, 181 – 182.
USP 36-NF31, (2013). The United states Pharmacopoeia and the National Formulary, 31st edition.
Yogananda R, Nagaraja TS, Snehalatha, Jayadevaiah KV, Vijay Kumar MMJ, Comparative in vitro
equivalence studies of designed, branded and generic tablets of ciprofloxacin-250, International Journal
of Pharmaceutical Science, 2009, pp. 28-34.