This paper proposes a comprehensive approach for managing risks in supply chains using the Supply Chain Risk Management Process (SCRMP), which consists of phases such as risk identification, measurement, assessment, evaluation, and mitigation. The authors argue that effective risk management is crucial given the increasing complexity and interdependencies in global supply chains, and they provide structured techniques for identifying and mitigating these risks. The framework presented serves as a valuable tool for managers in addressing supply chain risks, which have become a significant concern in today’s dynamic environment.

![16/6 (2011) 474–483
q Emerald Group Publishing Limited [ISSN 1359-8546]
[DOI 10.1108/13598541111171165]
The authors are grateful to Guest Editor Dr Charlene Xie and
two
anonymous reviewers for the valuable feedback and comments
received on
earlier versions of this paper.
474
chain risks, compiled from various prior studies, most notably
Chopra and Sodhi (2004) and Schoenherr et al. (2008).
Even though the assessment and management of risk in
supply chains is more of a recent phenomenon, studies exist
that explored risk management approaches from a variety of
angles (e.g. Charette, 1989; Hayes et al., 1986; Lowrance,
1976; Rowe, 1977; Starr and Whipple, 1980). Building on
these studies, Tummala et al. (1994), by following Raiffa
(1982) and Hertz and Thomas (1983), developed a
structured Risk Management Process (RMP) consisting of
the five phases risk identification, risk measurement, risk
assessment, risk evaluation, and risk control and monitoring.
This RMP framework has been successfully applied to
identify potential risk factors and to assess their likelihood of
occurrence. In addition, the seriousness of associated
consequences can be identified, and appropriate risk](https://image.slidesharecdn.com/researchnoteassessingandmanagingrisksusingthesupply-230122012510-4f8da11d/85/Research-noteAssessing-and-managing-risks-using-the-Supply-docx-5-320.jpg)
![and others. For recent publications, please visit: http://broad.
msu.edu/supplychain/faculty/member?id ¼ 748. Tobias
Schoenherr is the corresponding author and can be
contacted at: [email protected]
Assessing and managing risks using the SCRMP
Rao Tummala and Tobias Schoenherr
Supply Chain Management: An International Journal
Volume 16 · Number 6 · 2011 · 474 – 483
483
To purchase reprints of this article please e-mail:
[email protected]
Or visit our web site for further details:
www.emeraldinsight.com/reprints
Reproduced with permission of the copyright owner. Further
reproduction prohibited without permission.
Supply Chain Integration and the SCOR Model
Honggeng Zhou
1
, W. C. Benton, Jr.](https://image.slidesharecdn.com/researchnoteassessingandmanagingrisksusingthesupply-230122012510-4f8da11d/85/Research-noteAssessing-and-managing-risks-using-the-Supply-docx-48-320.jpg)
![mediates the
impact of the Plan process on the Deliver process. The findings
provide managers with empirical evidence that the SCOR model
is in
fact valid.
Keywords: Supply Chain Operations Reference (SCOR) model;
supply chain management; business strategy
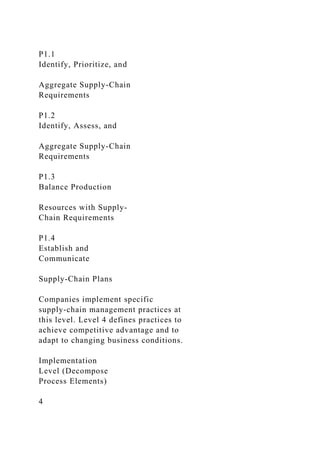
INTRODUCTION
The Supply Chain Operations Reference (SCOR) model was
developed by the Supply Chain Council in 1996. The SCOR
model focuses on the supply chain management function
from an operational process perspective and includes cus-
tomer interactions, physical transactions, and market interac-
tions. In the past decade, the SCOR model has been widely
adopted by many companies including Intel, General Electric
(GE), Airbus, DuPont, and IBM. According to the Supply
Chain Council’s (2010) website, ‘‘While remarkably simple, it
[the SCOR model] has proven to be a powerful and robust
tool set for describing, analyzing, and improving the supply
chain.’’ In the literature, several recent studies have reviewed
the SCOR model (Huang et al. 2004, 2005). Many other
studies (McCormack 1998; Lockamy and McCormack 2004;
Supply Chain Council 2010) have attempted to measure the
SCOR model’s impact on business performance. Trade jour-
nals have also reported the benefits of using SCOR model
(Davies 2004; Malin 2006).
To date, the SCOR model has been used by companies
throughout the world. Intel is one of the first major U.S.
corporations to adopt the SCOR model (Supply Chain
Council 2010). In 1999, Intel started its first SCOR project
for its Resellers Product Division. Later, they expanded the
SCOR model implementation to the Systems Manufacturing](https://image.slidesharecdn.com/researchnoteassessingandmanagingrisksusingthesupply-230122012510-4f8da11d/85/Research-noteAssessing-and-managing-risks-using-the-Supply-docx-50-320.jpg)
![anecdotal evidences have shown the value of adopting the
SCOR model, no large-scale empirical research has been
conducted to systematically examine the relationships among
the supply chain processes as suggested by the SCOR model.
Thus, the purpose of this study is to empirically validate the
SCOR model (i.e., to confirm the structure of the SCOR
model).
The results of this study show that the relationships
among the supply chain processes in the SCOR model are
generally supported. The Plan process has significant positive
Corresponding author:
W. C. Benton, Jr., Department of Management Sciences, Fisher
College of Business, The Ohio State University, 2100 Neil Ave-
nue, Columbus, OH 43210, USA; E-mail: [email protected]
Journal of Business Logistics, 2011, 32(4): 332–344
� Council of Supply Chain Management Professionals
influence on the Source, Make, and Deliver processes. The
Source process has significant positive influence on the Make
process and the Make process has significant positive influ-
ence on the Deliver process. Among the four supply chain
processes, the Plan process has received the least attention
from the implementation firms. The findings from this study
provide practitioners statistical confidence in the implementa-
tion and use of the SCOR model.
In the next section, literature review and research hypothe-
ses will be presented. The theoretical underpinnings for the
research hypotheses are also discussed in the second section.
In the third section, the research methodology and measure-
ment scale development are presented. In the fourth section,
the analysis results are given. The research findings and man-](https://image.slidesharecdn.com/researchnoteassessingandmanagingrisksusingthesupply-230122012510-4f8da11d/85/Research-noteAssessing-and-managing-risks-using-the-Supply-docx-52-320.jpg)
![first describes the multiple criteria that are used to validate
the measurement scales. Then, the final results of the scale
analysis are presented.
Scale validity and reliability
The measurement scale development process supports the
validity and reliability of the measurement scales. First,
exploratory factor analysis was performed. Then, confirma-
tory factor analysis (CFA) was performed. The content
validity of the scales was established by the literature. In
addition, both academicians and practicing managers
assessed the survey questionnaire content validity before the
surveys were distributed. Construct validity ensures that the
conceptual constructs are operationalized in the appropriate
way. To ensure construct validity, exploratory factor analysis
with principal component method is used. According to Hair
et al. (1998) and Carmines and Zeller (1979), the factor load-
ings need to be at least .3. Only one factor in each construct
can have an eigenvalue that is larger than 1.00 and the vari-
ance explained by the first factor in each construct is at least
40%. Reliability is defined as the extent to which the mea-
sures can yield same results on other replication studies. The
internal consistency measured by Cronbach’s alpha is used
to measure the construct reliability in this study. The lower
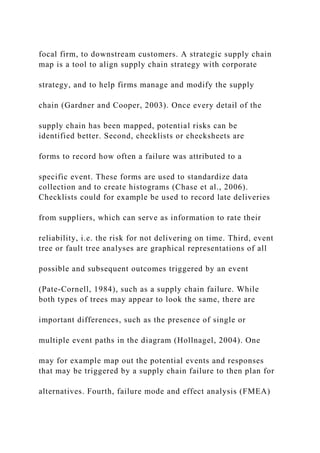
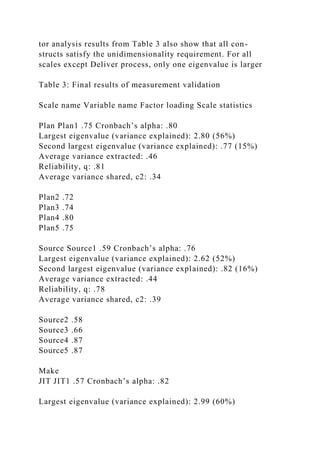
Table 2: Survey questions and descriptive statistics
Survey question Mean SD
To what extent have the following planning practices been
implemented in your company
[1 = not implemented, 7 = extensively implemented]](https://image.slidesharecdn.com/researchnoteassessingandmanagingrisksusingthesupply-230122012510-4f8da11d/85/Research-noteAssessing-and-managing-risks-using-the-Supply-docx-68-320.jpg)
![Plan1. ‘‘What–if’’ analysis has been implemented for supply ⁄
demand balancing 3.41 1.98
Plan2. A change in the demand information instantaneously
‘‘reconfigures’’ the
production and supply plans
3.21 2.18
Plan3. Online visibility of supply chain demand requirements
3.35 2.05
Plan4. The designation of a supply chain planning team 3.65
2.15
Plan5. Both marketing and manufacturing functions are
involved in supply chain
planning process
3.70 2.08
To what extent have the following sourcing practices been
implemented in your company
[1 = not implemented, 7 = extensively implemented]
Source1. Long-term relationships with strategic suppliers 5.51
1.52
Source2. Reduction in the number of suppliers 4.69 1.87
Source3. Just-in-time delivery from suppliers 4.29 1.92
Source4. Frequent measurement of suppliers’ performance 4.75
1.83
Source5. Frequent performance feedback to suppliers 4.44 1.94
To what extent have the following production practices been
implemented in your company
[1 = not implemented, 7 = extensively implemented]
JIT1. Pull system 3.97 2.11
JIT2. Cellular manufacturing 3.42 2.25
JIT3. Cycle time reduction 4.40 1.96
JIT4. Agile manufacturing strategy 3.10 2.04](https://image.slidesharecdn.com/researchnoteassessingandmanagingrisksusingthesupply-230122012510-4f8da11d/85/Research-noteAssessing-and-managing-risks-using-the-Supply-docx-69-320.jpg)
![JIT5. Bottleneck ⁄ constraint removal 4.02 1.83
TPM1. Preventive maintenance 4.98 1.75
TPM2. Maintenance optimization 4.08 2.00
TPM3. Safety improvement programs 5.57 1.65
TPM4. Planning and scheduling strategies 5.02 1.50
TQM1. Total quality management 4.88 1.84
TQM2. Statistical process control 4.19 2.16
TQM3. Formal continuous improvement program 4.75 2.06
TQM4. Six-sigma techniques 3.36 2.20
HRM1. Self-directed work teams 3.69 1.93
HRM2. We use knowledge, skill, and capabilities as criteria to
select employees 5.14 1.60
HRM3. Direct labor technical capabilities are acknowledged
4.67 1.72
HRM4. Employee cross-training program 4.76 1.51
To what extent have the following delivery practices been
practiced in your company
[1 = not practiced, 7 = extensively practiced]
Deliver1. We have a single point of contact for all order
inquiries 5.12 1.82
Deliver2. We have real-time visibilities of order tracking 4.41
2.17
Deliver3. We consolidate orders by customers, sources, carriers,
etc. 4.59 2.03
Deliver4. We use automatic identification during the delivery
process to track order status 3.26 2.19
Supply Chain Integration and SCOR Model 337
limit of .7 is considered acceptable (Nunnally and Bernstein
1994; Hair et al. 1998). The results in Table 3 show that all
factor loadings meet the criterion of larger than .3. The fac-](https://image.slidesharecdn.com/researchnoteassessingandmanagingrisksusingthesupply-230122012510-4f8da11d/85/Research-noteAssessing-and-managing-risks-using-the-Supply-docx-70-320.jpg)
![have Cronbach’s alpha values of .7 or higher. Thus, it is con-
cluded that all measurement scales are reliable.
After performing the exploratory factor analysis, CFA
was performed to confirm the measurement model of the
structural equation model. As Table 3 shows, reliability rho
scores for all constructs exceed the threshold of .7 (Fornell
and Larcker 1981). For each construct, the average shared
variance is smaller than the average variance extracted.
Moreover, the overall CFA model statistics (comparative fit
index [CFI] = .93, incremental fit index [IFI] = .93, non-
normed fit index [NNFI] = .91, and root mean square error
of approximation [RMSEA] = .09) suggest that the pro-
posed construct structure has a reasonably good fit. It is to
be noted that JIT, TPM, TQM, and HRM do not have the
three CFA-related measures (i.e., average variance extracted,
shared variance, and reliability rho) because they are the
measurement items for the latent variable Make in the CFA
model. For example, JIT value in the CFA model is the
average of the five JIT items (i.e., JIT1, JIT2, JIT3, JIT4,
and JIT5) in Table 3.
As we used a single informant to answer all questions,
potential common method bias is checked. The items com-
prising the scales of planning, sourcing, JIT, TPM, TQM,
HRM, and delivery were not highly similar in content. The
respondents are familiar with the constructs. Harman’s one-
factor test of common method bias (Podsakoff and Organ
1986; Podsakoff et al. 2003; Hochwarter et al. 2004) found
several distinct factors for the variables, which suggested that
common method variance bias was not a problem.
Summary of research methodology
This study used a survey research method. The analysis was
based on 125 useable responses from U.S. manufacturing](https://image.slidesharecdn.com/researchnoteassessingandmanagingrisksusingthesupply-230122012510-4f8da11d/85/Research-noteAssessing-and-managing-risks-using-the-Supply-docx-74-320.jpg)


![Research in Social Psychology [WLOs 1, 3, 4, 5, 6] [CLOs 1, 2, 3.docx](https://cdn.slidesharecdn.com/ss_thumbnails/researchinsocialpsychologywlos13456clos123-230122012534-e38fcccb-thumbnail.jpg?width=640&height=640&fit=bounds)


