1. Derivation of Blood Pressure by Non-invasive Cuff-less Technique for
Ambulatory Monitoring
Sakshi Bansala
*, Y. Amarendra Nath, Dr. P.S.Pandian, K. Mohanvelu, Deepa Prabhu,
M.V.Mallikarjuna Reddy, Dr B.S.Sundersheshu, Dr. V.C.Padaki
Biomedical Technology Group, Defence Bioengineering & Electromedical Laboratory,
Bangalore – 560 093, India.
a
e-mail: sakshi_bme@yahoo.co.in
Abstract: This paper describes the cuff-less approach of measuring blood pressure that plays an
important role in performing battlefield triage for trauma assessment and performance evaluation
of soldiers. The aim of this work is to correlate Pulse Transit Time (PTT) which is the time taken
by the blood ejected from the heart to reach the peripheries, with systolic and diastolic pressure
taking into account age, height and weight as depending factors and deriving an equation for
systolic and diastolic BP.
Keywords: Blood Pressure; Pulse Transit Time and Regression analysis.
1. INTRODUCTION
Pulse transit time has been identified as
a promising approach in continuous non-
invasive beat-to-beat blood pressure
measurement. It refers to the time taken by the
pulse wave to travel between two arterial sites.
The speed at which this arterial pressure wave
travels is directly proportional to blood
pressure. An acute rise in blood pressure causes
vascular tone to increase and hence the arterial
wall becomes stiffer causing the PTT to
shorten. Conversely, when blood pressure falls,
vascular tone decreases and PTT increases.
Apart from the inverse relationship with BP
variation, there are certain human physiological
factors that affect PTT which involves age,
height and weight of a subject. This paper
focuses on deriving the systolic and diastolic
blood pressure equation from PTT along with
the age, height and weight. Statistical analysis
was performed on 29 male healthy subjects of
age group 21-35 years and results thus obtained
are compared with the standard
sphygmomanometry for accurate BP
measurement.
2. MATERIALS & METHODS
2.1 Hardware Setup
Traditionally, pulse transit time is measured by
recording the time interval between the passage
of the arterial pulse wave at two consecutive
sites. Here, the electrocardiographic R wave has
been used as the starting point as it corresponds
approximately to the opening of the aortic valve.
For the estimation of the arrival of the pulse
wave at a peripheral site, finger-photo-
plethysmography is used. Conventionally the
point on the photo-plethysmograph pulse
waveform which is either the foot or peak of the
PPG waveform is taken to indicate the arrival of
the pulse wave. With the help of conventional
ECG electrodes with single lead which is a Lead
II configuration and Nellcor Pulse Oximeter
probe, the ECG & PPG waveforms are acquired
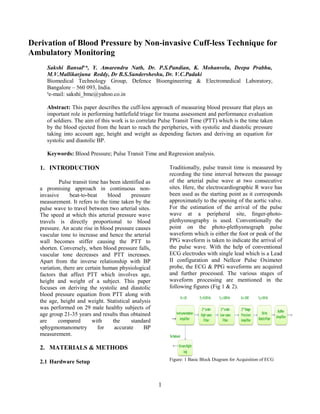
and further processed. The various stages of
waveform processing are mentioned in the
following figures (Fig 1 & 2).
Figure: 1 Basic Block Diagram for Acquisition of ECG
1
2. Figure 3 shows the developed PCB which
has ECG as well as PPG signal conditioning
circuits integrated in it.
Figure: 2 Basic Block Diagram for Acquisition of PPG
Figure: 3 PCB Design for Pulse Transit Time Acquisition
The PCB is designed to work at 5V single
supply. Figure 4 shows the waveforms
captured from custom designed PCB.
Figure: 4 ECG & PPG waveforms acquired from custom
designed PCB
2.2 Software Setup
Pulse transit time is determined by calculating
the number of sample points occurring between
the peak time of ECG and simultaneous peak
time of PPG and dividing that value with the
sampling frequency. Mathematically,
The PTT calculation is performed through the
logic code written in MATLAB where the ECG
and PPG peaks are first detected and stored in an
array and then performing PTT calculation from
Equation 1. The PTT values thus obtained are
averaged for each subject.
2.3 Statistical Analysis
A separate database is created in MS Excel
where PTT values are inserted along with the
physiological factors such as age, height, weight
and heart rate. With the help of MedCalc tool
which is dedicated software for statistical
analysis, a multiple regression equation is
obtained.
3. RESULTS
A database of 29 male healthy subjects falling
within the age group of 21-35 years is prepared.
Since, blood pressure highly depends upon sex,
we have restricted our study to male volunteers
in order to reduce the dispersion of values from
the mean. Each volunteer was made to sit on a
chair with hands resting over the hand rest of the
2
PTT =
No. of samples between ECG &
PPG peaks
Sampling Frequency
Figure: 5 Detection of ECG & PPG peaks through
MATLAB operations
Eq. 1
3. chair and was made to talk casually. ECG
electrodes were placed over the forearm near the
wrist in supine position and PPG probe was
fixed over the index finger of the same arm.
Both the waveforms were acquired
simultaneously from the PCB shown above and
the analog data is sent to PC through a DAQ
card (Measurement Computing). At the same
time, an arm cuff is also placed on the other arm
of the subject to record the SBP and DBP
manually by applying conventional
sphygmomanometry. All the data were recorded
under resting condition. The MATLAB code is
used to perform PTT calculation and the
averaged PTT value was entered into the
database along with the subject’s age, height,
weight and HR. With the help of MedCalc
statistical tool, a multiple regression analysis
was performed.
Table 1 shows the derived coefficients of
multiple regression equation. Thus, an equation
can be formed from these coefficients as:
Systolic BP Diastolic BP
AGE 0.4846 0.03502
HEIGHT 0.04797 -0.6305
WEIGHT 0.2841 0.2949
PTT -84.5813 31.3109
HR - 0.3915
CONSTANT 108.5502 125.0160
P Value 0.199 0.009
Coeff. Of
determination
, R2
0.2137 0.4674
R2
-adjusted 0.08265 0.3516
SBP = 0.4846*age+0.04797*ht+0.2841*wt-
84.5813*PTT+108.5502
DBP = 0.035*age
-0.6305*ht+0.295*wt+31.311*PTT+125.02
The dependence of systolic & diastolic BP
on pulse transit time can be assessed by
comparing the p-value, which in this case
shows that pulse transit time is a
significantly dependent factor for DBP as
compared to SBP.
The following figure (Fig.7) shows the Bland
Altmann plot for derived systolic & diastolic BP
from PTT. It shows that the values are falling
within the confidence interval.
Figure: 7 Bland Altmann plot of estimated BP and standard
BP values
3
Figure: 6 Bar Chart showing comparison of calculated
SBP & DBP values with the standards
4. 5. CONCLUSION
The pulse transit time can be taken as the
determining factor for blood pressure as the
average error estimated is found to be within
the AAMI standards (75 % values for SBP
& DBP should be less than or equal to 5
mmHg). Thus, the method can be used for
continuous beat to beat monitoring of blood
pressure. However, to further improve the p-
value, a large amount of data collection is
required. To increase the accuracy of
measurement, arm length should also be
added in the regression analysis.
ACKNOWLEDGEMENT
We are grateful to Dr. V.C. Padaki, Director,
DEBEL, Bangalore for encouraging and
permitting us to publish and present this work.
We also thank Dr. B.S. Sundersheshu, Joint
Director, Biomedical Technology Group,
DEBEL, Bangalore for his support on this
project.
REFERENCES
a) Cuff-less and Noninvasive Measurements of
Arterial Blood Pressure by Pulse Transit Time,
C.C.Y. Poon and Y.T. Zhang; Proceedings of the
2005 IEEE Engineering in Medicine and Biology
27th Annual Conference Shanghai, China,
September 1-4, 2005
b) Continuous Blood Pressure Monitoring using
Pulse Wave Transit Time, Gu-Young Jeong,
Kee-Ho Yu and Nam-Gyun Kim; ICCAS2005,
June 2-5, KINTEX Gyeonggi-Do, Korea
c) The Effects of Exercises on the Relationship
between Pulse Transit Time and Arterial Blood
Pressure, Y. M. Wong and Y. T. Zhang;
Proceedings of the 2005 IEEE Engineering in
Medicine and Biology 27th Annual Conference
Shanghai, China, September 1-4, 2005
d) Adaptive hydrostatic blood pressure calibration:
Development of a wearable, autonomous pulse
wave velocity blood pressure monitor, Devin B.
McCombie, Phillip A. Shaltis, Andrew T.
Reisner, and H. Harry Asada; Proceedings of the
29th Annual International Conference of the
IEEE EMBS Cité Internationale, Lyon, France
August 23-26, 2007.
e) Pulse Transit Time and Arterial Blood Pressure
at Different Vertical Wrist Positions, Yinbo Liu
and Y.T. Zhang;
4