Downloaded 59 times


![28
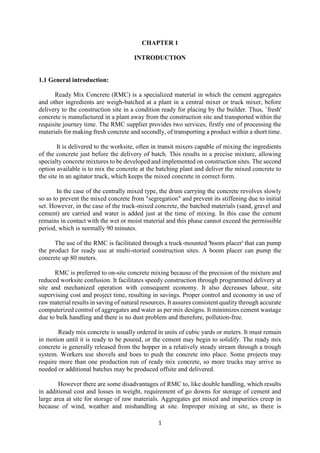
AFTER ABSORPTION TEST:
This test helps to determine the water absorption of coarse aggregates as per IS: 2386
(Part III) – 1963. For this test a sample not less than 2000g should be used. The apparatus used
for this test are:
Wire basket, perforated, electroplated or plastic coated with wire hangers for
suspending it from the balance.
Water-tight container for suspending the basket.
Dry soft absorbent cloth – 75cm x 45cm (2 nos.).
Shallow tray of minimum 650 sq.cm area.
Air-tight container of a capacity similar to the basket and Oven.
Procedure to determine water absorption of Aggregates:
i) The sample should be thoroughly washed to remove finer particles and dust, drained and
then placed in the wire basket and immersed in distilled water at a temperature between 22 and
32C.
ii) After immersion, the entrapped air should be removed by lifting the basket and allowing it
to drop 25 times in 25 seconds. The basket and sample should remain immersed for a period
of 24 + ½ hrs afterwards.
iii) The basket and aggregates should then be removed from the water, allowed to drain for a
few minutes, after which the aggregates should be gently emptied from the basket on to one of
the dry clothes and gently surface-dried with the cloth, transferring it to a second dry cloth
when the first would remove no further moisture. The aggregates should be spread on the
second cloth and exposed to the atmosphere away from direct sunlight till it appears to be
completely surface-dry. The aggregates should be weighed (Weight ‘A’).
iv) The aggregates should then be placed in an oven at a temperature of 100 to 110oC for 24hrs.
It should then be removed from the oven, cooled and weighed (Weight ‘B’).
Formula used is Water absorption = [(A - B)/B] x 100%.
Two such tests should be done and the individual and mean results should be reported.
EXPERIMENT RESULT:
Weight of Saturated Surface Dry (SSD) sample (A) =725.00 gm.
Weight of Oven dry Sample (B) =705.00 gm.
Weight Absorption =725-705/705 X 100
= 0.02837 X 100
= 2.83 %](https://image.slidesharecdn.com/5adbf42e-2514-4ad1-a316-1f1241466c86-150525130801-lva1-app6891/85/report-work-28-320.jpg)


![32
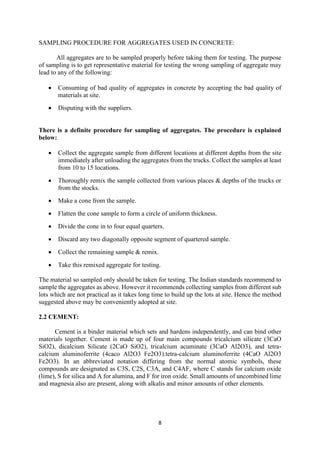
aggregates, the saturated-surface-dry condition is reached when there is an absence of free
moisture.
Test Procedure
Weigh the saturated-surface-dry sample to the nearest 0.5-gram. For ease in
calculations, the fine aggregate sample may be brought to exactly 1000 grams weight,
and the coarse aggregate sample may be brought to exactly 2000 grams weight.
Place the sample in the appropriate pycnometer containing approximately two inches
of water.
Nearly fill the pycnometer jar with water at the same temperature plus or minus 3°F
(1.7°C) as used in the calibration.
Screw the cap down into the proper position by lining up the mark on the pycnometer
top and the jar.
Entirely fill the pycnometer by adding additional water through the hole in the
pycnometer top.
Hold one finger over the hole in the top and gently roll and shake the pycnometer to
remove any trapped air in the sample.
When further rolling and shaking brings no more air bubbles to the top, fill, dry and weigh.
EXPERIMENT RESULT:
Saturated surface dry (SSD) sample weight (A) = 500.00 gm.
Pycnometer + water + SSD sample (B) =1847.00 gm.
Pycnometer + water (C) =1539.00 gm.
Oven dry Sample (D) =498.00 gm.
Specific gravity = 498/ [500- (1847-1539)]
= 498/192
= 2.5937](https://image.slidesharecdn.com/5adbf42e-2514-4ad1-a316-1f1241466c86-150525130801-lva1-app6891/85/report-work-32-320.jpg)


![37
iii) The basket and aggregates should then be removed from the water, allowed to drain for a
few minutes, after which the aggregates should be gently emptied from the basket on to one of
the dry clothes and gently surface-dried with the cloth, transferring it to a second dry cloth
when the first would remove no further moisture. The aggregates should be spread on the
second cloth and exposed to the atmosphere away from direct sunlight till it appears to be
completely surface-dry. The aggregates should be weighed (Weight ‘A’).
iv) The aggregates should then be placed in an oven at a temperature of 100 to 110oC for 24hrs.
It should then be removed from the oven, cooled and weighed (Weight ‘B’).
Formula used is Water absorption = [(A - B)/B] x 100%.
Two such tests should be done and the individual and mean results should be reported.
EXPERIMENT RESULT:
Coarse aggregate – 20mm:
Weight of Saturated Surface Dry (SSD) sample (A) =705.00 gm.
Weight of Oven dry Sample (B) =703.00 gm.
Weight Absorption = 705-703/703X 100
= 0.00284X 100
= 0.28 %
Coarse aggregate – 10mm:
Weight of Saturated Surface Dry (SSD) sample (A) = 653.50 gm.
Weight of Oven dry Sample (B) = 650.00 gm.
Weight Absorption = 653.5-650/650X 100
= 0.00538X 100
= 0.54 %](https://image.slidesharecdn.com/5adbf42e-2514-4ad1-a316-1f1241466c86-150525130801-lva1-app6891/85/report-work-37-320.jpg)


![50
DETERMINATION OF COARSE AND FINE AGGREGATE CONTENT:
V= [W + C/SC + 1/P*Fagg/SFine] x 1/1000
V= [W + C/SC + 1/ (1-P)*Cagg/SCoarse] x 1/1000
V = absolute volume of fresh concrete
Sc =specific gravity of cement.
W= mass of water (kg) per m3 of concrete
C= mass of cement (kg) per cu.m. Of concrete.
p = ratio of fine aggregate to total aggregate by absolute volume.
Fa, Ca= total masses of fine and coarse aggregates by absolute volume.
Sfa, Sca= specific gravities of fine and coarse aggregates (saturated surface dry condition).
For the Specified Max. Size of aggregate of 20 mm, the amount of entrapped air in the
wet concrete is 2%.
Amount of Fine aggregate, Fa required
1 m3 = [185.4 + 412/3.15 + 1/0.315* Fagg/2.59] x 1/1000
Fa =630 kg/m3.
Amount of Coarse aggregate, Ca required
1 m3 = [185.4 + 412/3.15 + 1/ (1-0.315)* Cagg/2.60] x 1/1000
Ca = 1377 kg/m3.
The Mix Proportion then becomes
Water = 185.4 kg/m3
Cement = 412 Kg/m3
Fine Aggregate = 630 Kg/m3
Coarse Aggregate = 1377 Kg/m3
Mix proportions for making 1 cu.m of concrete:
Table 6. material contents in M 50:
Water Cement Fine Aggregate Coarse Aggregate
185.4 kg/m3 412 Kg/m3 630 Kg/m3 1377 Kg/m3](https://image.slidesharecdn.com/5adbf42e-2514-4ad1-a316-1f1241466c86-150525130801-lva1-app6891/85/report-work-50-320.jpg)


Ready Mix Concrete (RMC) is concrete that is manufactured in a batch plant, then delivered to a work site by truck mounted transit mixers. It offers several advantages over site-mixed concrete including better quality control, reduced labor costs, and less environmental impact. The document discusses the history and development of the RMC industry in various countries including India. It describes the materials used in RMC including aggregates, cement, and other ingredients. Aggregates make up 70-80% of concrete and are divided into coarse and fine aggregates. Proper sampling of aggregates is important for quality control. Cement is the binder that sets and hardens the concrete. The scope and growth potential of the RMC industry in India is


