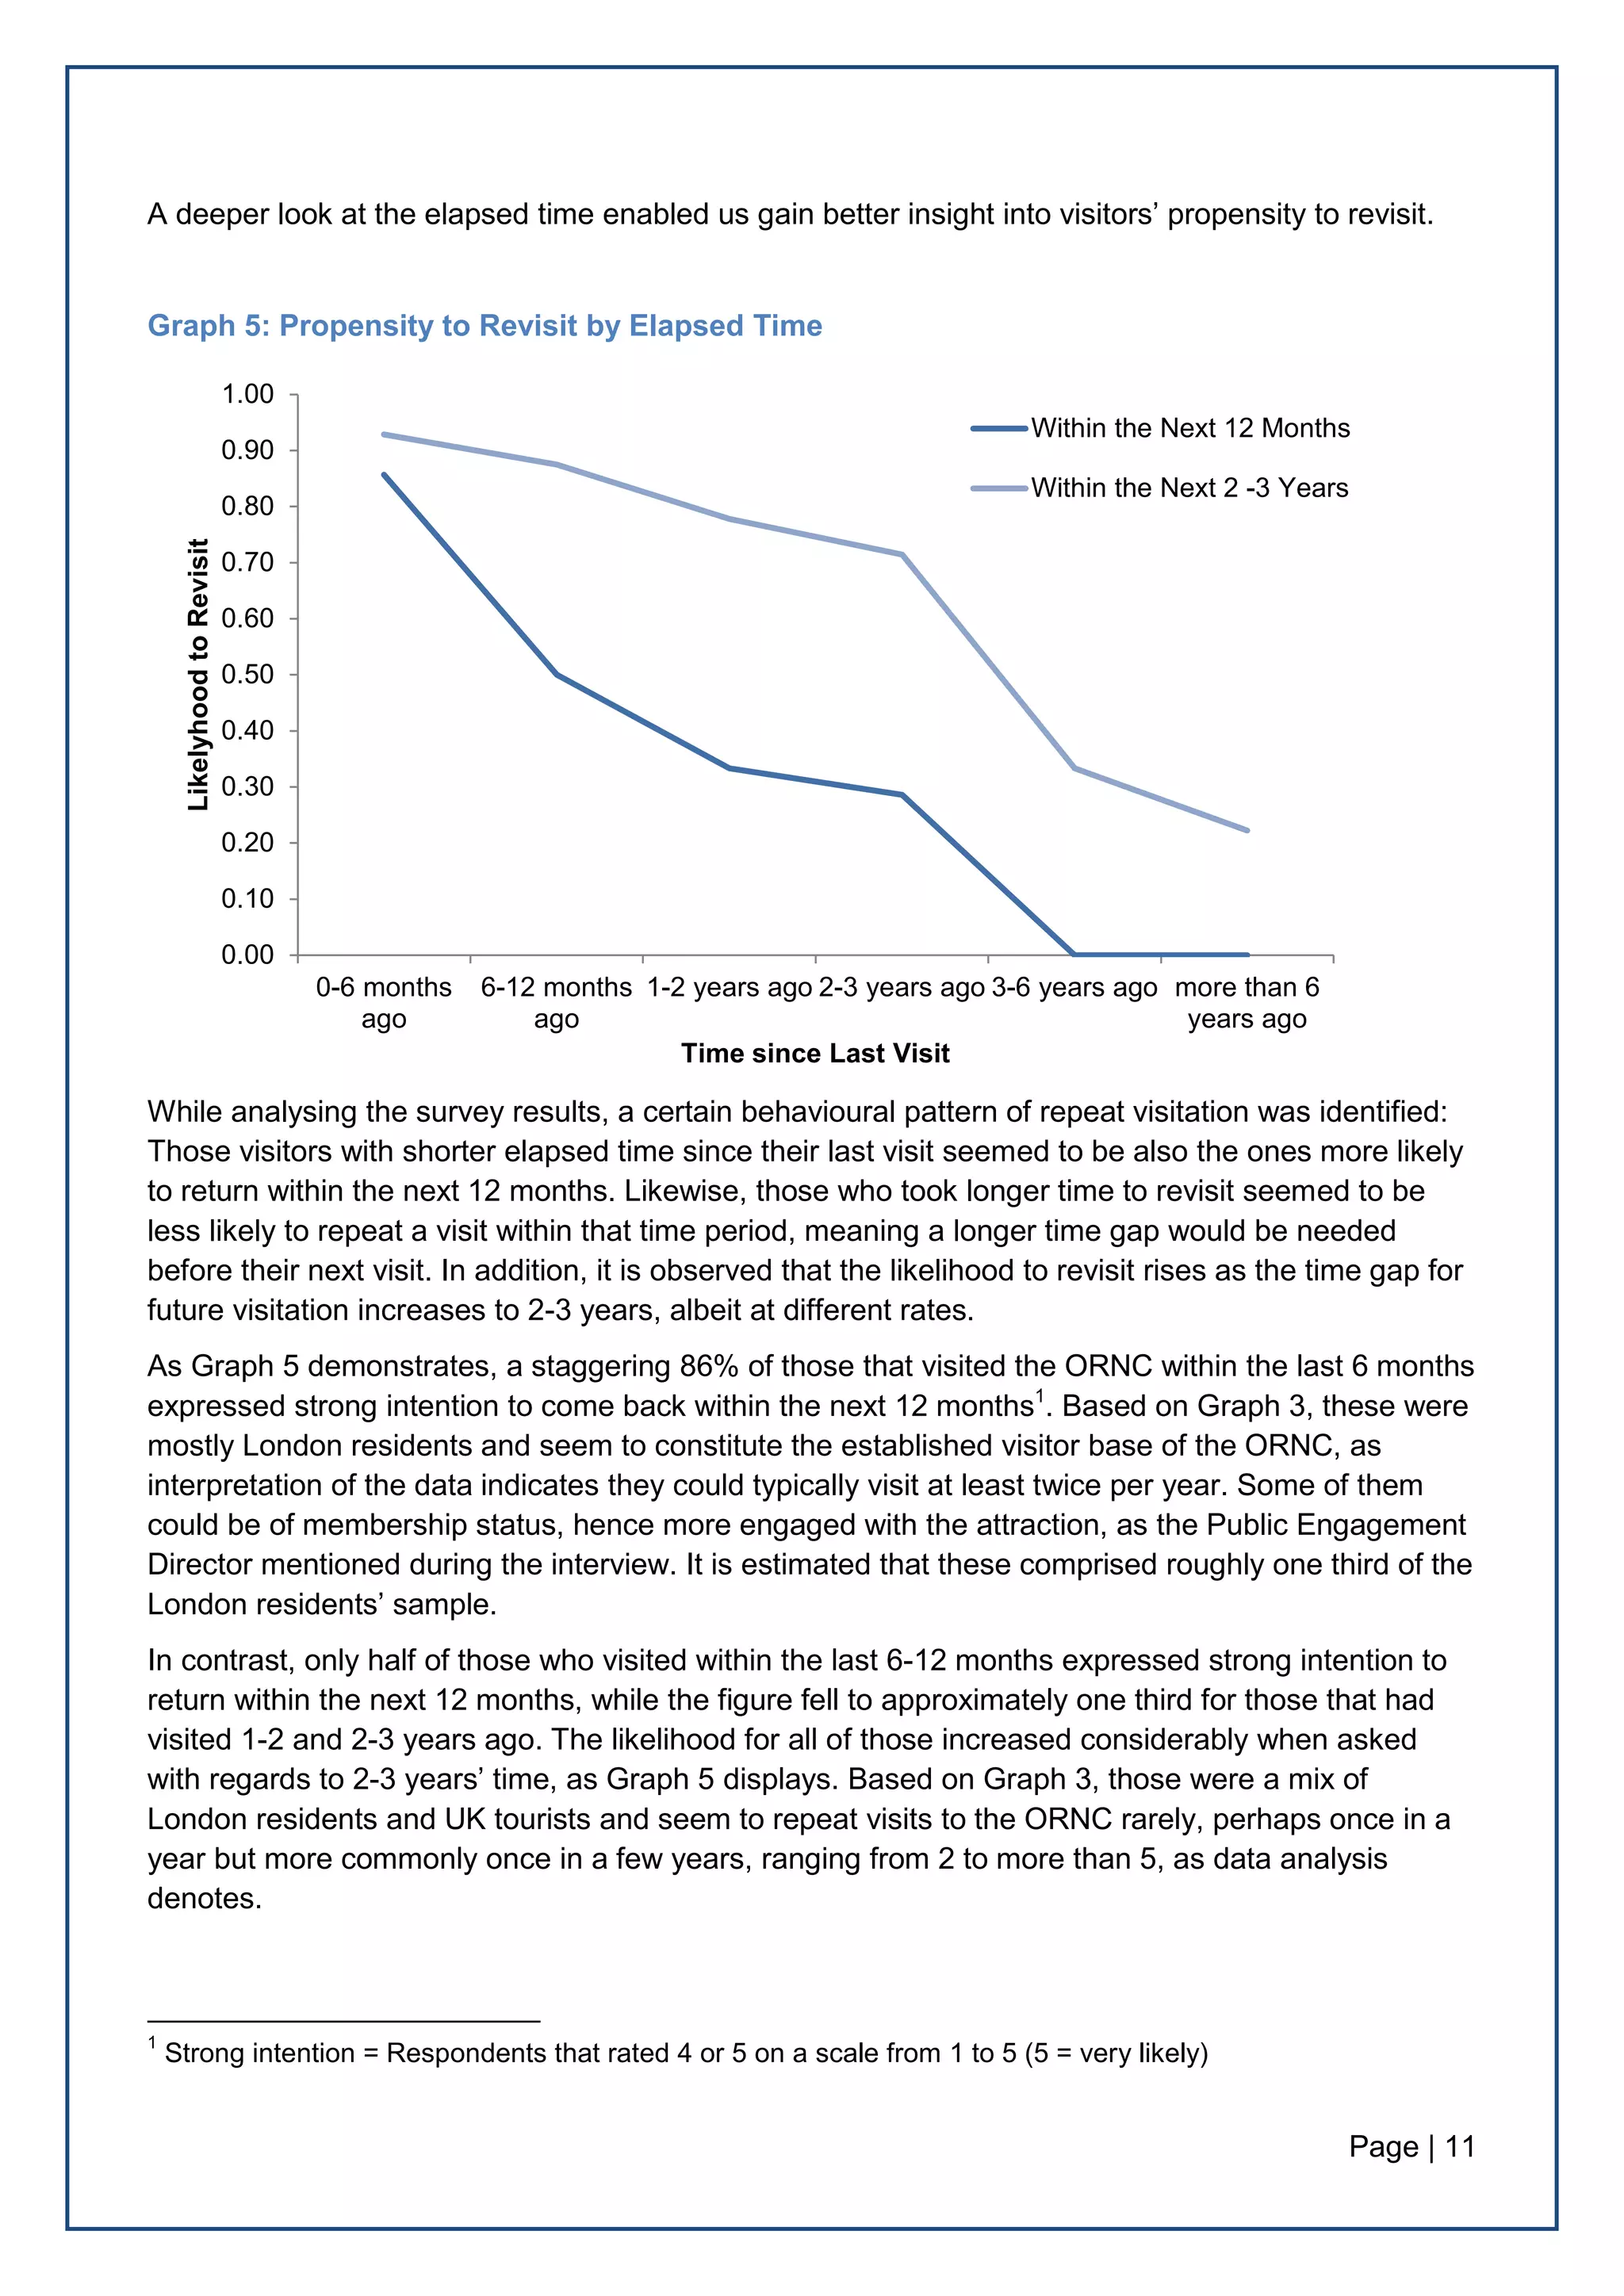
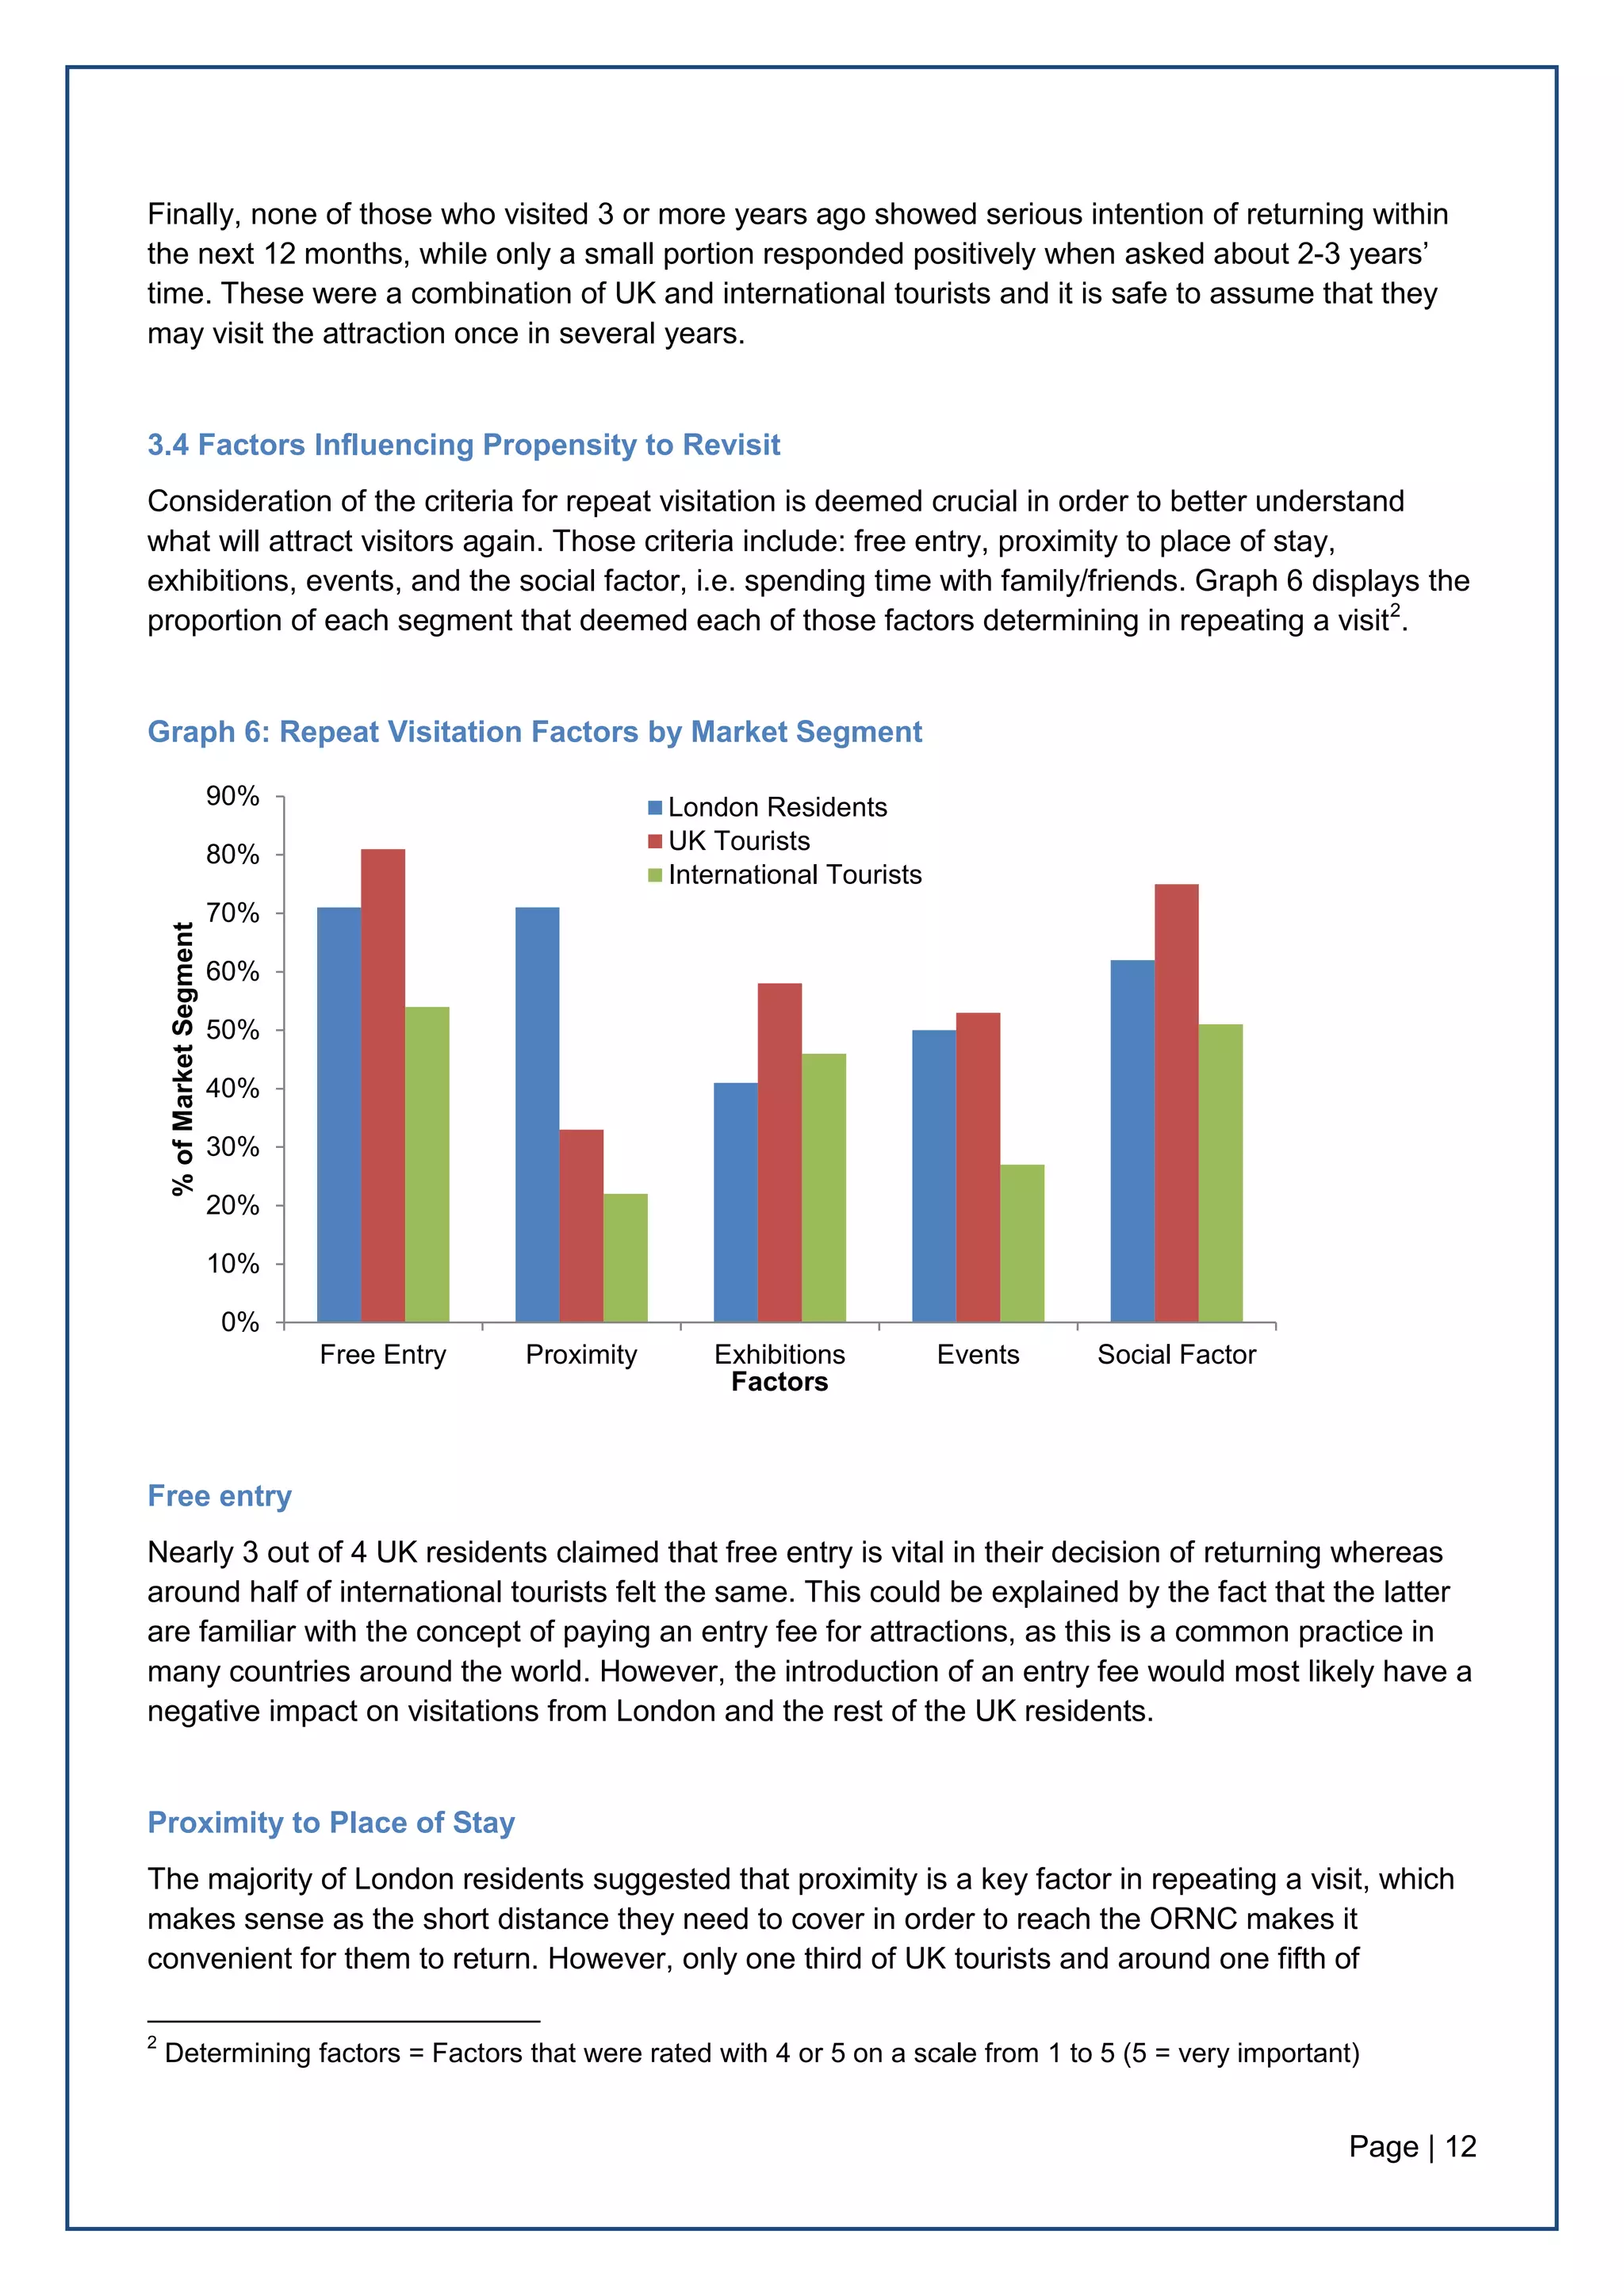
This document summarizes a research project assessing factors that influence repeat visits to visitor attractions. It conducted a survey of 111 visitors to the Old Royal Naval College in London, identifying three main visitor segments: local residents, UK tourists, and international tourists. Key findings include that 45% of visitors had visited before, with most repeat visits from residents within the last 6-24 months. 32% expressed strong intent to revisit within a year. Proximity, free entry, and spending time with others were most influential in propensity to revisit. The report recommends adapting surveys to better capture repeat visit data, developing a repeat visitation forecasting model, and stimulating repeats through technology, retail, events, and marketing.
![Page | 6
1.3 Objectives
Acknowledging the significance of repeat visitation for visitor attractions, this project will aim to:
1) To provide a better understanding of the relationship between repeat visitation and visitor
performance.
2) To show how a person’s propensity to visit changes once they have visited an attraction, i.e.
all other things being equal, how much time has to pass before that person may once again
be realistically considered a ‘potential’ visitor and thus a part of the attraction’s effective
market.
3) Based on this understanding, to suggest practical improvements in the way that visitor
projections for new attractions are constructed.
4) To provide recommendations for driving up repeat visits to established attractions.
2. Research Method
In order to meet the project objectives, we needed information from 1) an attraction and 2) visitors.
Table 1 outlines the information:
Table 1: Information Needs
Attraction Visitors
Actual visitor performance over time Profile
Capital and other changes over time Past behaviour
Future plans Future intention
Existing repeat visit rates Motivations for visiting an attraction
In order to obtain information about visitors, we deemed appropriate to carry out primary
quantitative research in the form of a face-to-face survey at an attraction. This allowed us to gather
real data from real visitors. As the identity of respondents would not be disclosed, we were counting
on unbiased answers.
In addition, we thought wise to conduct primary qualitative research in the form of an interview with
the management team of the attraction, as this would give us insight into the attraction’s
background.
Finally, secondary quantitative and qualitative research was used to compare our findings and
support our recommendations.
2.1 Survey
Design
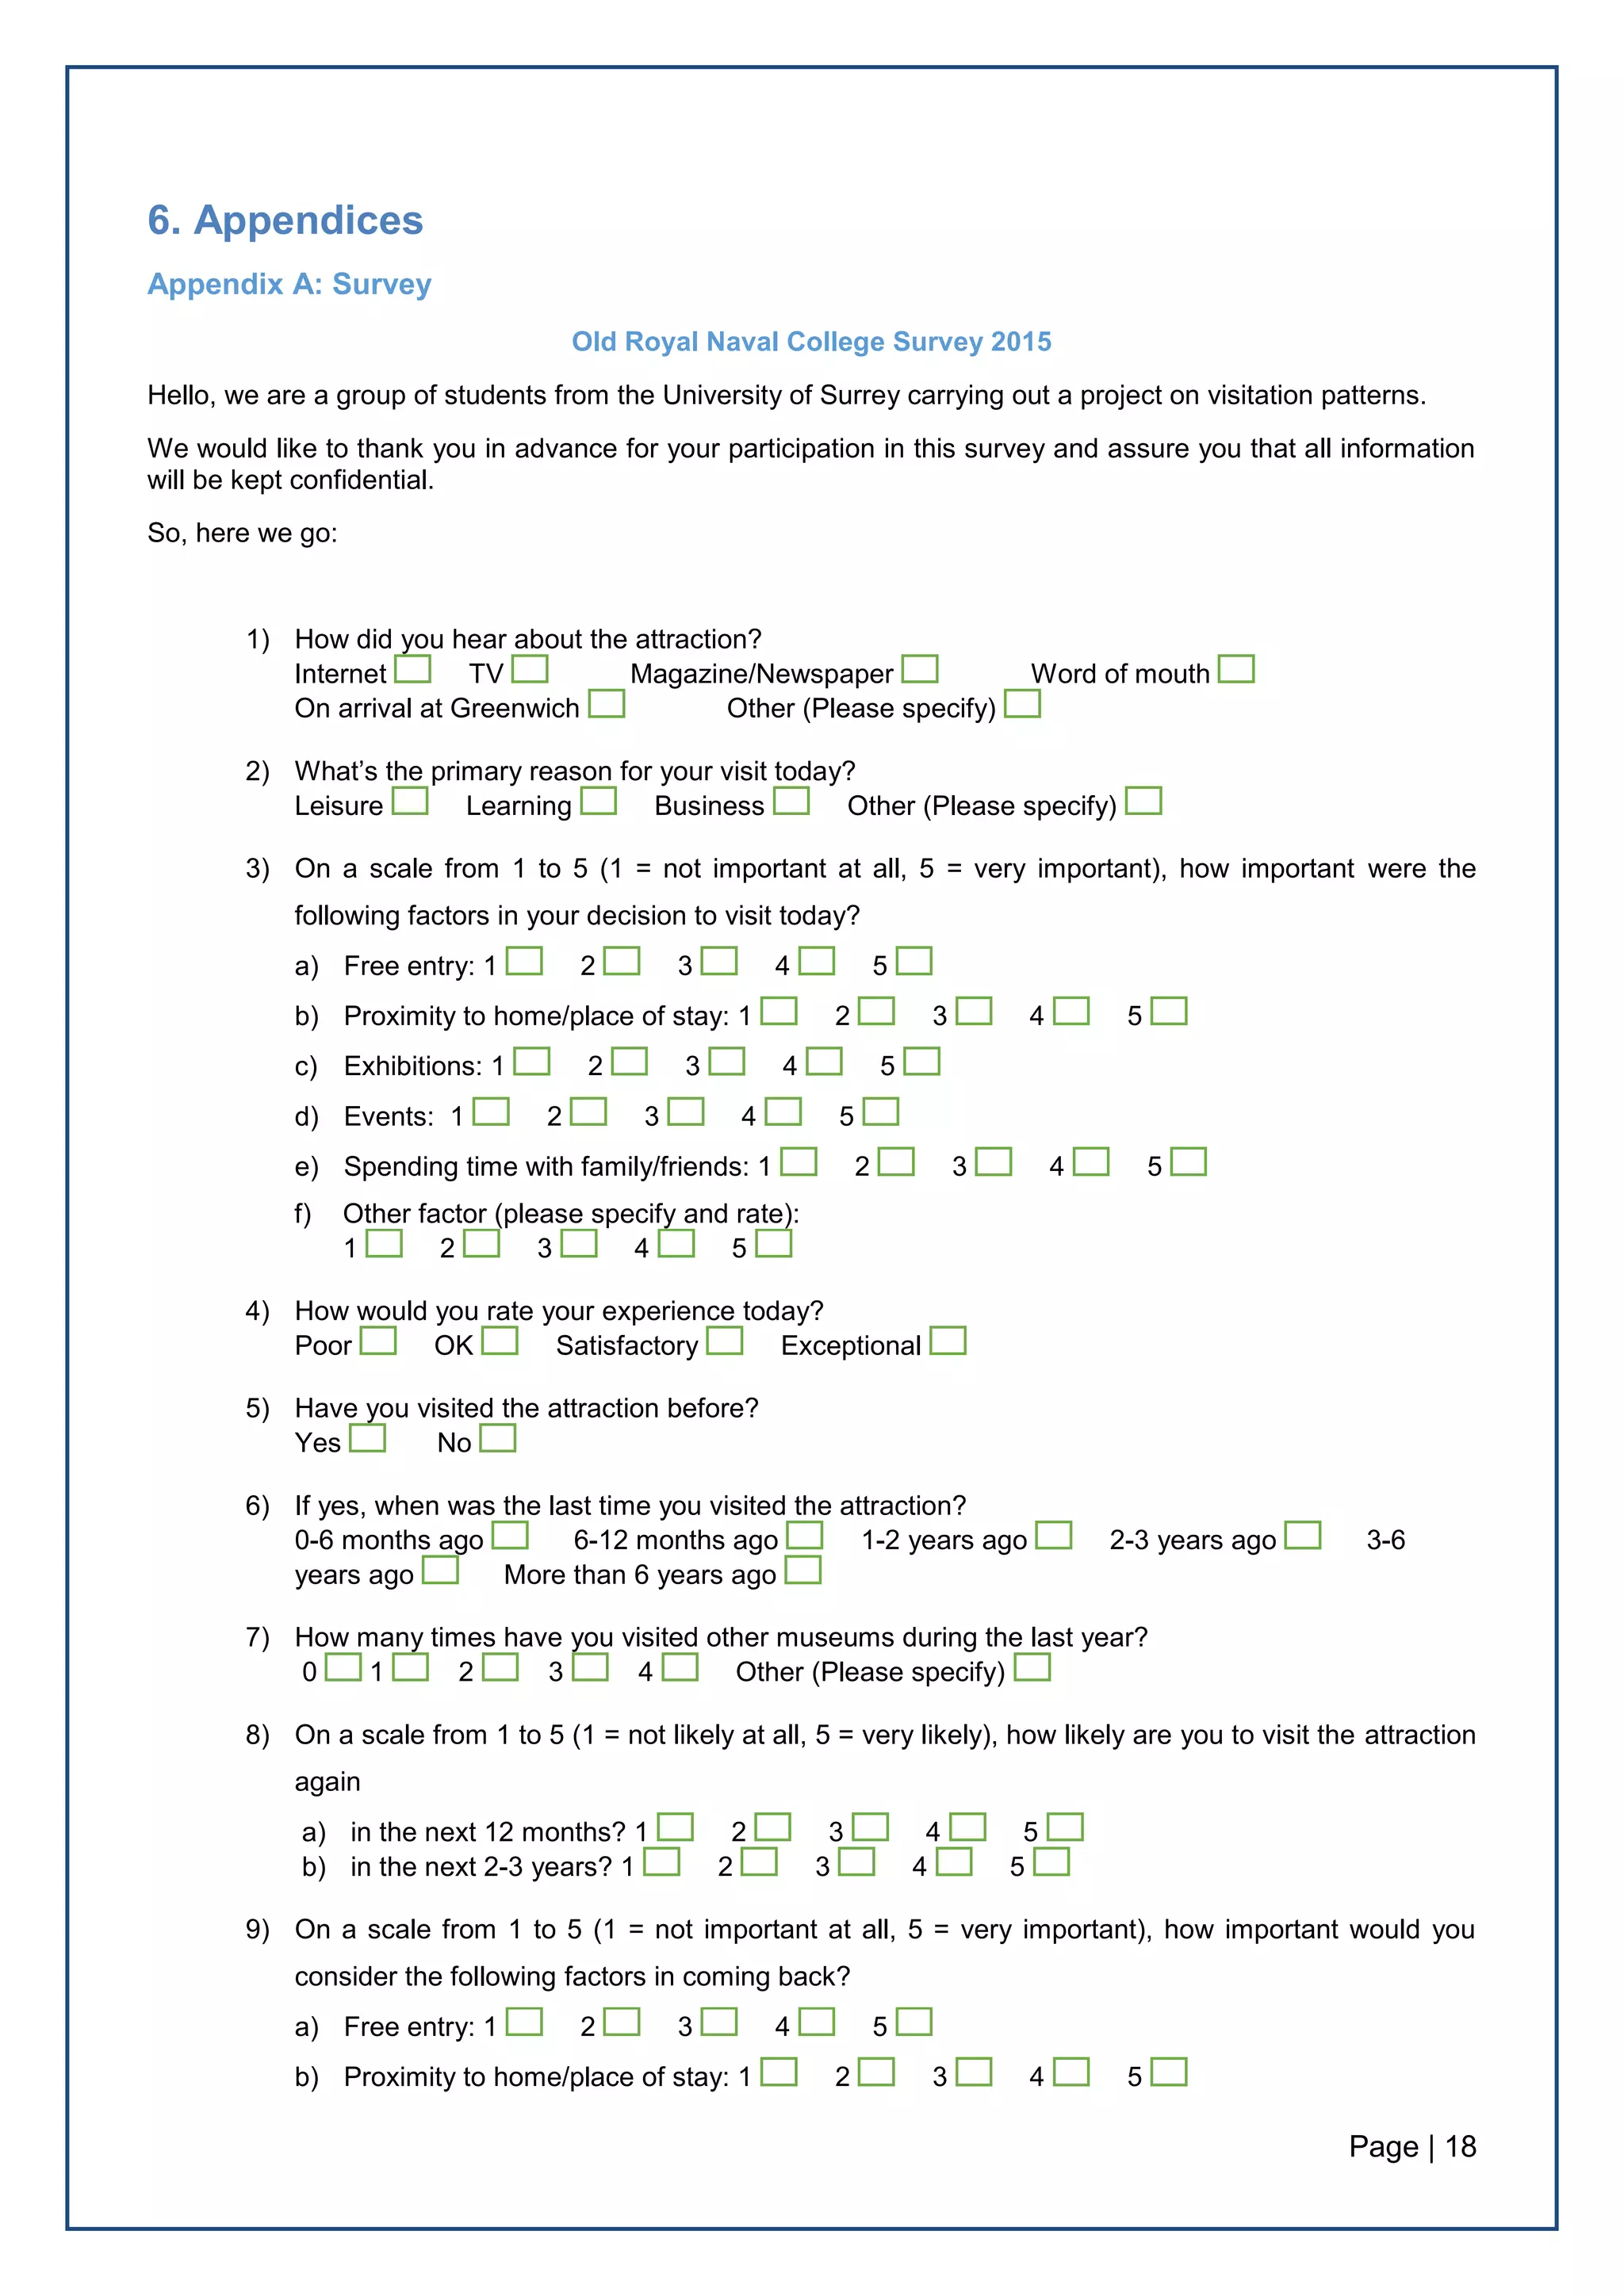
A survey questionnaire was prepared by the team consisting of 15 questions [Appendix A]. We
aimed to keep the questionnaire short but to-the-point to enhance the response rate. The 1st part of
the questionnaire (Questions 1-4) focused on the present visit, aiming to identify the primary reason
for the visit, factors that influenced their decision to visit, and the quality of the visitors’ experience.](https://image.slidesharecdn.com/f243a4ff-b5b6-47a7-a1f6-06b92a1a5775-160320051914/75/Repeat-Visitation-to-Visitor-Attractions-Report-for-Fourth-Street-7-2048.jpg)
![Page | 7
The 2nd
part intended to distinguish 1st
time visitors from repeat visitors and specify the elapsed time
since the last visit of the repeat visitors (Questions 5-6). The 3rd
part looked at the intention of the
visitors to return to the attraction and the dynamics of the factors that could influence their
propensity (Questions 8-9). Finally, a number of questions were added to ascertain the
demographics (Questions 10-15).
The questions were short and simple and were followed by multiple choice answers, with the
exception of the last one. For a number of questions, we used nominal scales (Questions 3, 7, 8, 9).
Feedback was taken into consideration by the lecturer of this module, Fourth Street, as well as the
management of the attraction where the survey was conducted to make sure the survey meet the
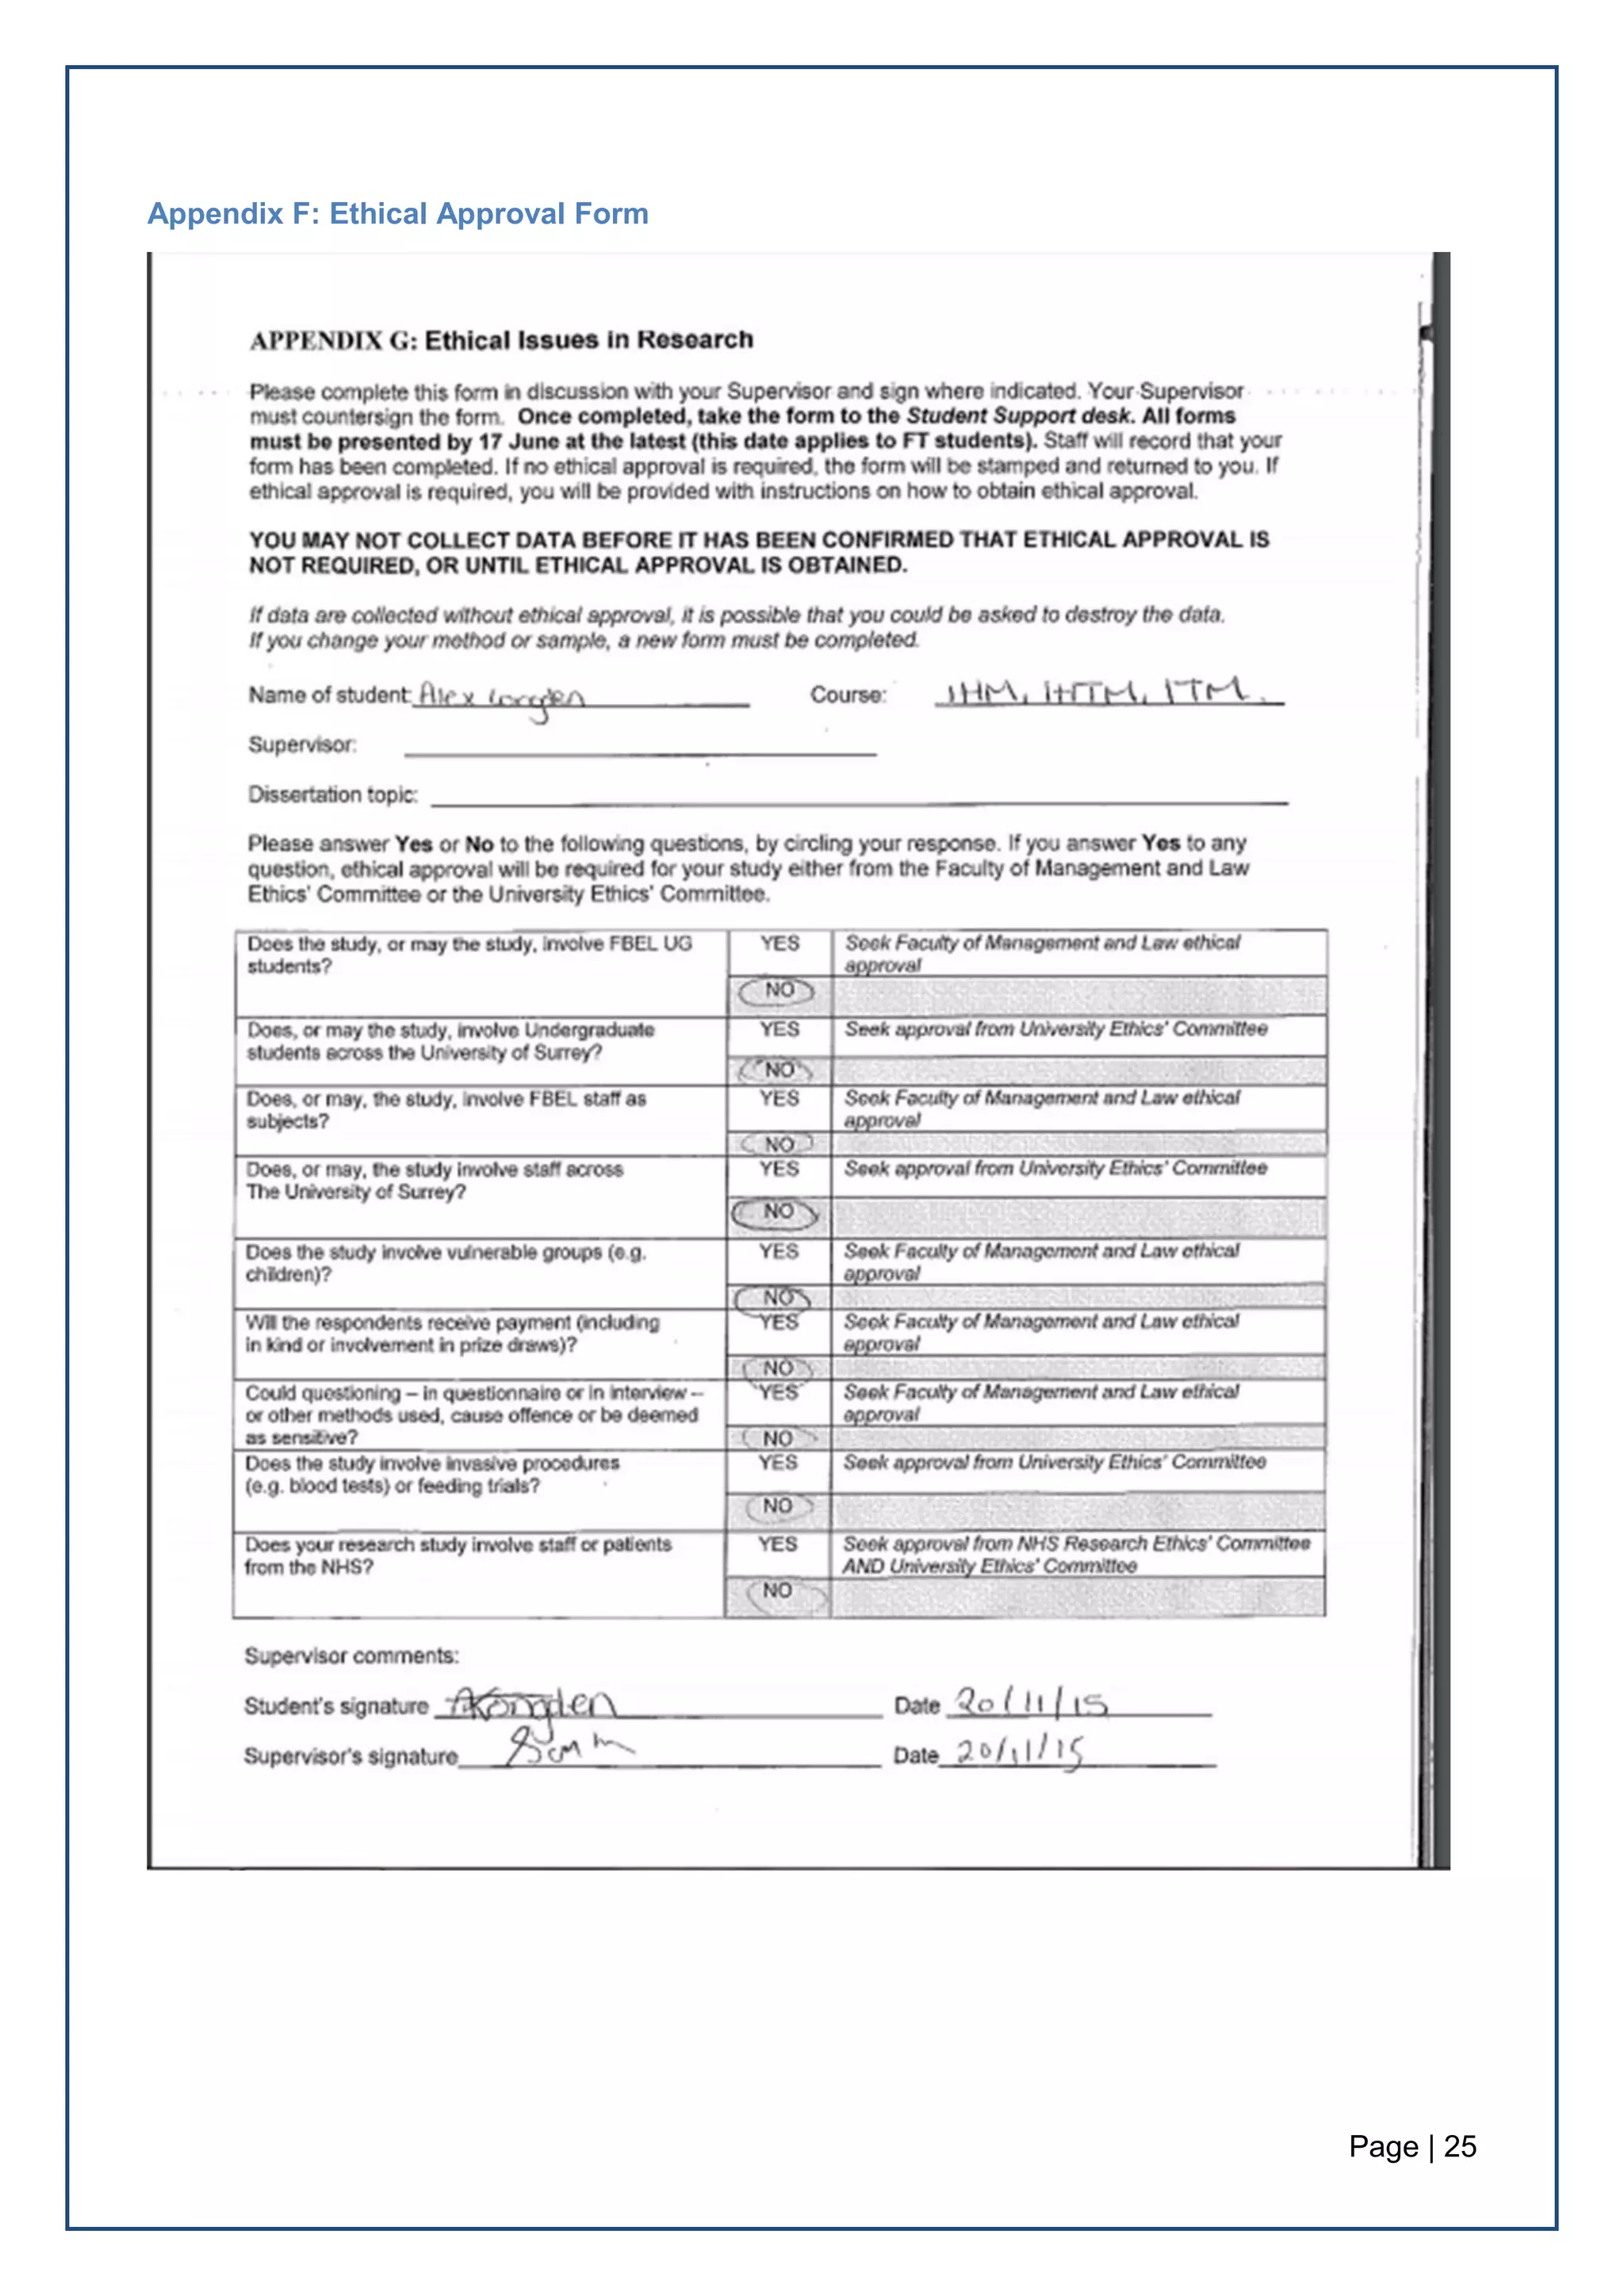
needs of the project. Once the survey was finalised, a risk assessment was carried out and an
ethical approval form was signed-off by the lecturer [Appendices E & F].
Conduct & Sampling Method
For the conduct of the survey, we followed a non-probability judgement sampling method. Our aim
was to carry out the survey at an established attraction with relatively static product (as opposed to
programming based attractions like theatres or opera houses). The Old Royal Naval College
(ORNC) in Greenwich, London was proposed by Fourth Street, who acted as the intermediate and
granted us permission into their grounds.
The survey was held in front of the two most popular attractions on site (the Painted Hall and
Chapel) so that we could capture visitors of the attraction itself and not of the site in general and
place on 2 days: Saturday and Tuesday. This was a request from the ORNC because they wanted
to identify possible different trends of visitation. For this reason, our team split into 2 groups: 3 of us
went on Saturday, 28/11/2015, and the other 3 on Tuesday, 01/12/205. On both days, the groups
stayed on site for around 3 hours, from 10am to 1pm.
A quota sampling technique was adopted to ensure various visitors are represented. We aimed for
a minimum of 100 replies in total (both days included) so that we can draw safe assumptions. In the
end, we gathered 111 replies. The sample varied significantly in size on the 2 days: 78 replies on
Saturday versus 33 on Tuesday. This is due to the fact that during the weekend the ORNC
experienced considerably bigger traffic than on the weekday, thus collecting answers on Saturday
proved quite easier.
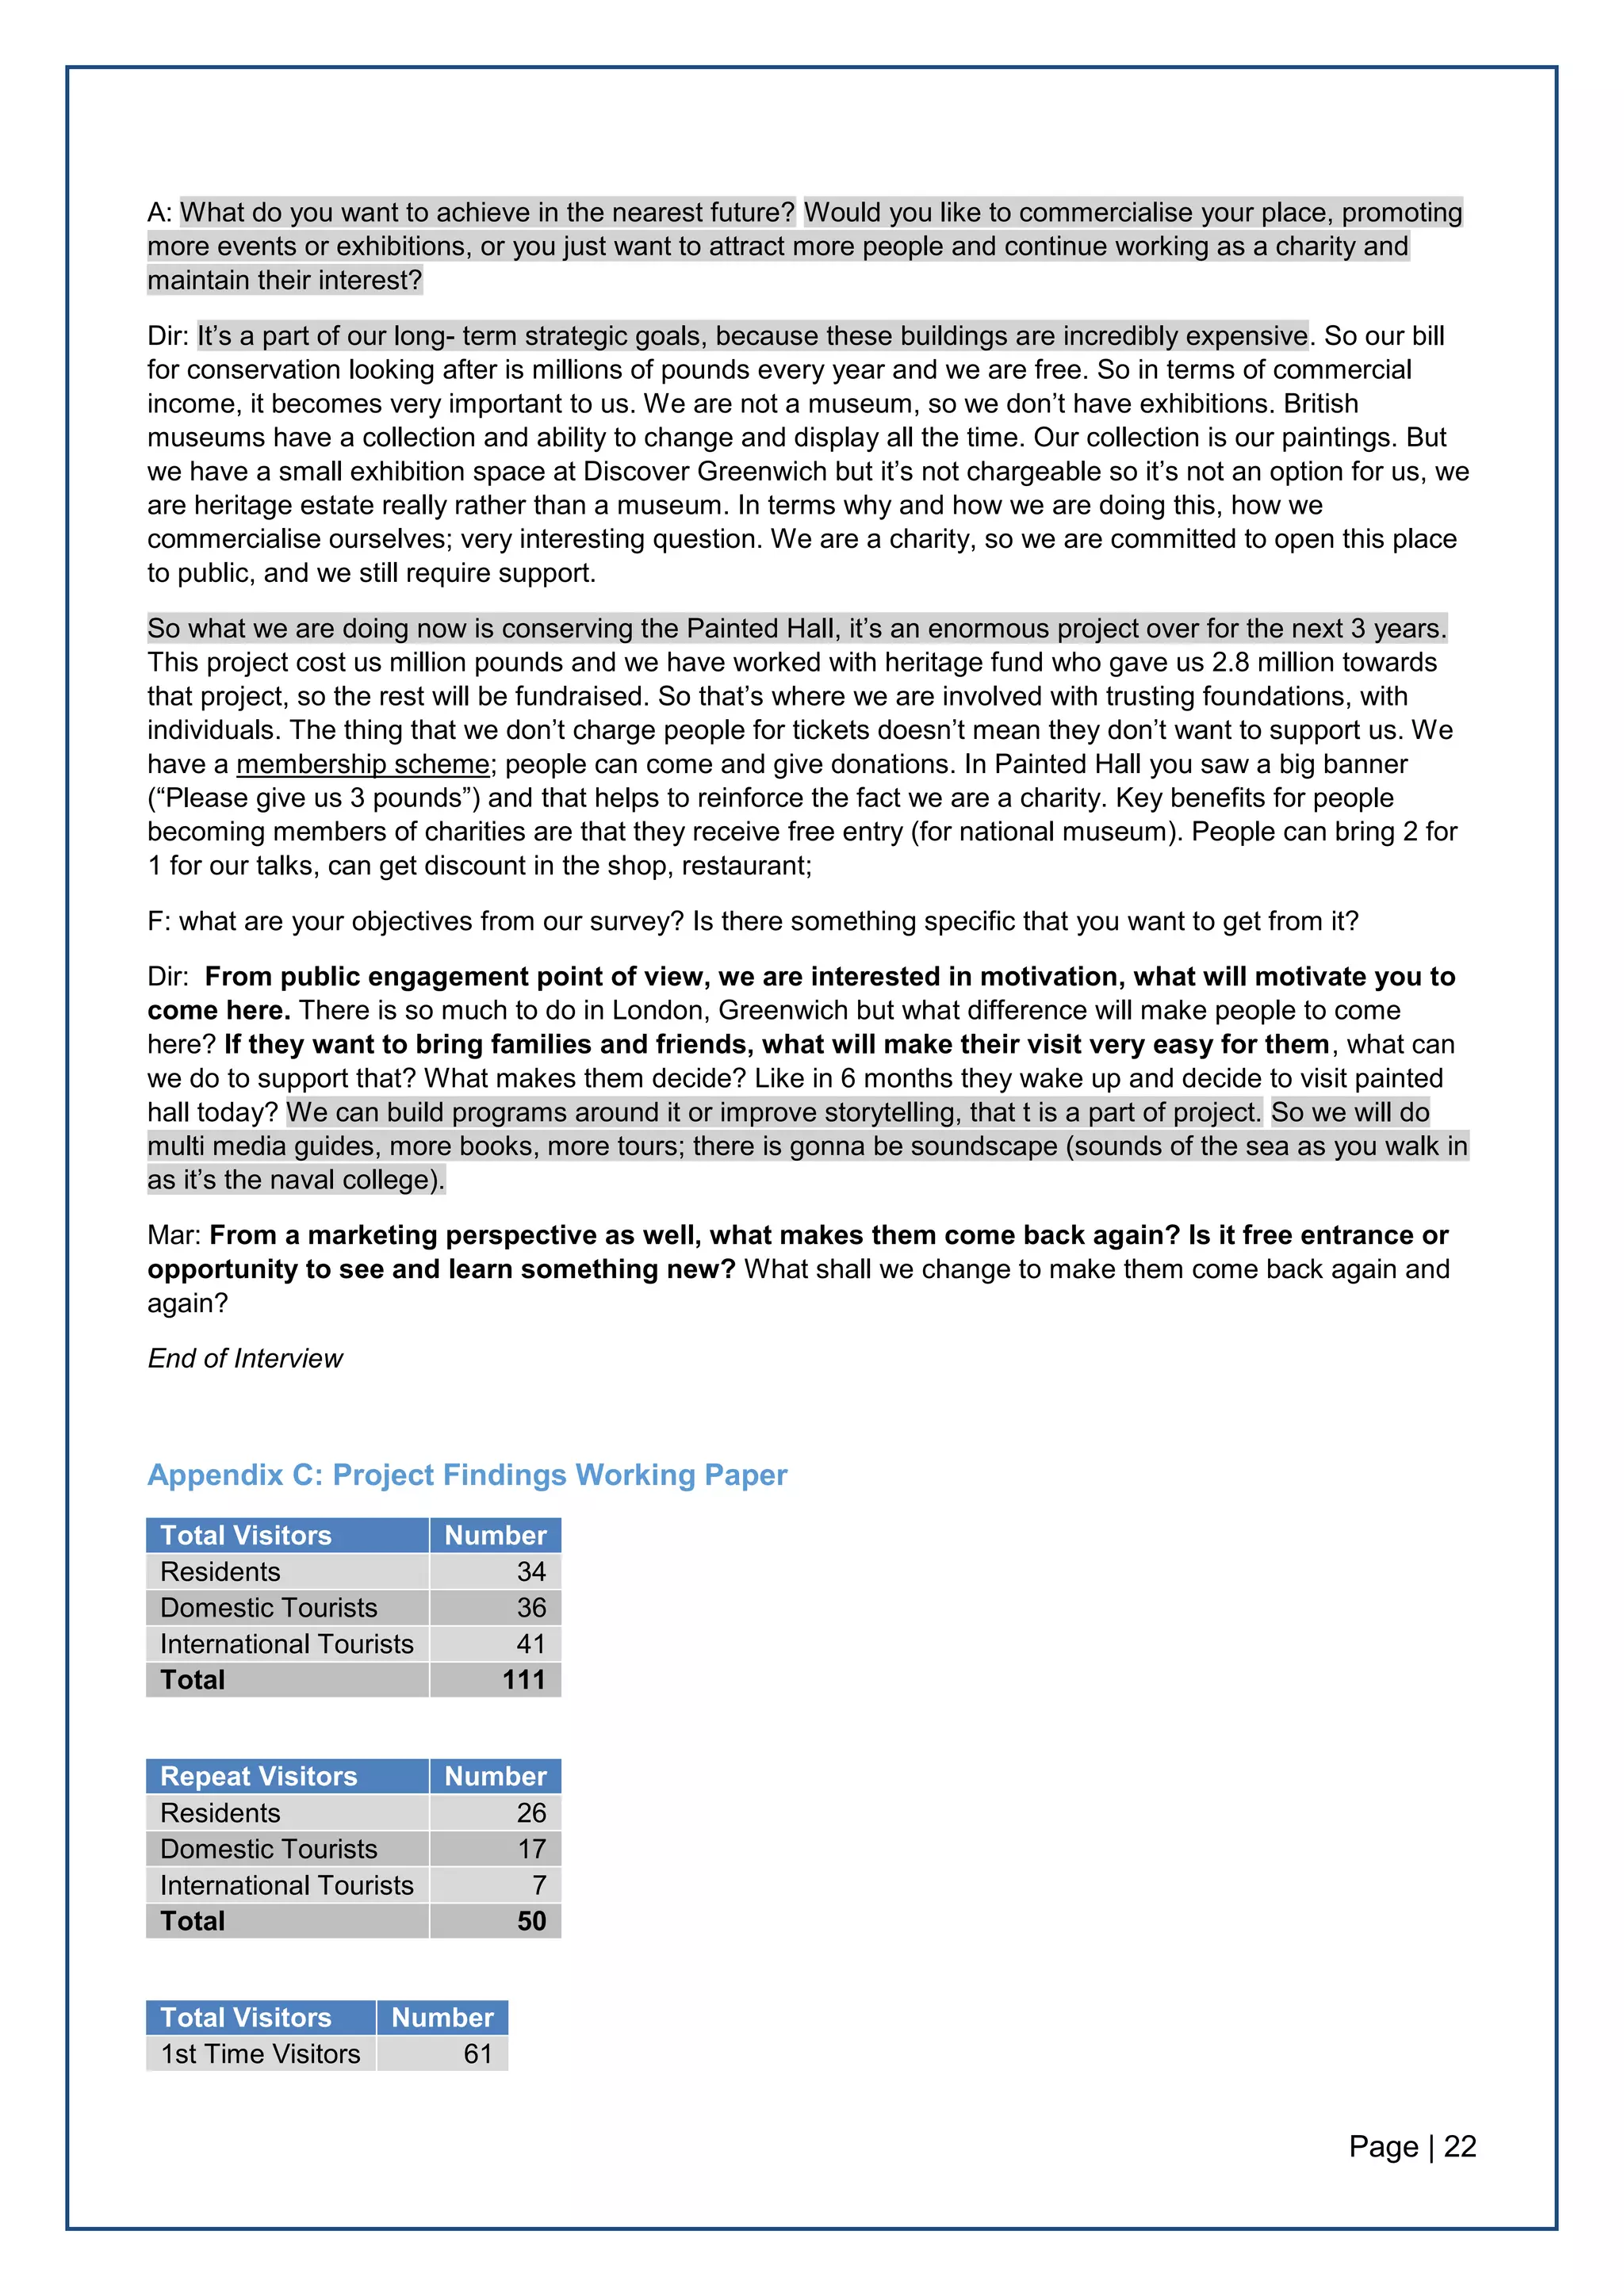
Analysis
For the analysis of the results, we entered the data from the hard copies into QuestionPro, a
website that summarises survey answers using pivot tables, segmentation tools, etc. Then, we
stored the results in an Excel file that we used as a working paper for our findings [Appendix C].
The analysis focused on the overall sample of 111, as it would enable us to draw safer conclusions.
However, separate data for the 2 days is also available upon request.
We assume that the data set is normally distributed, thus a standard +/-3 deviation can be applied
and a confidence level of 95%.](https://image.slidesharecdn.com/f243a4ff-b5b6-47a7-a1f6-06b92a1a5775-160320051914/75/Repeat-Visitation-to-Visitor-Attractions-Report-for-Fourth-Street-8-2048.jpg)
![Page | 8
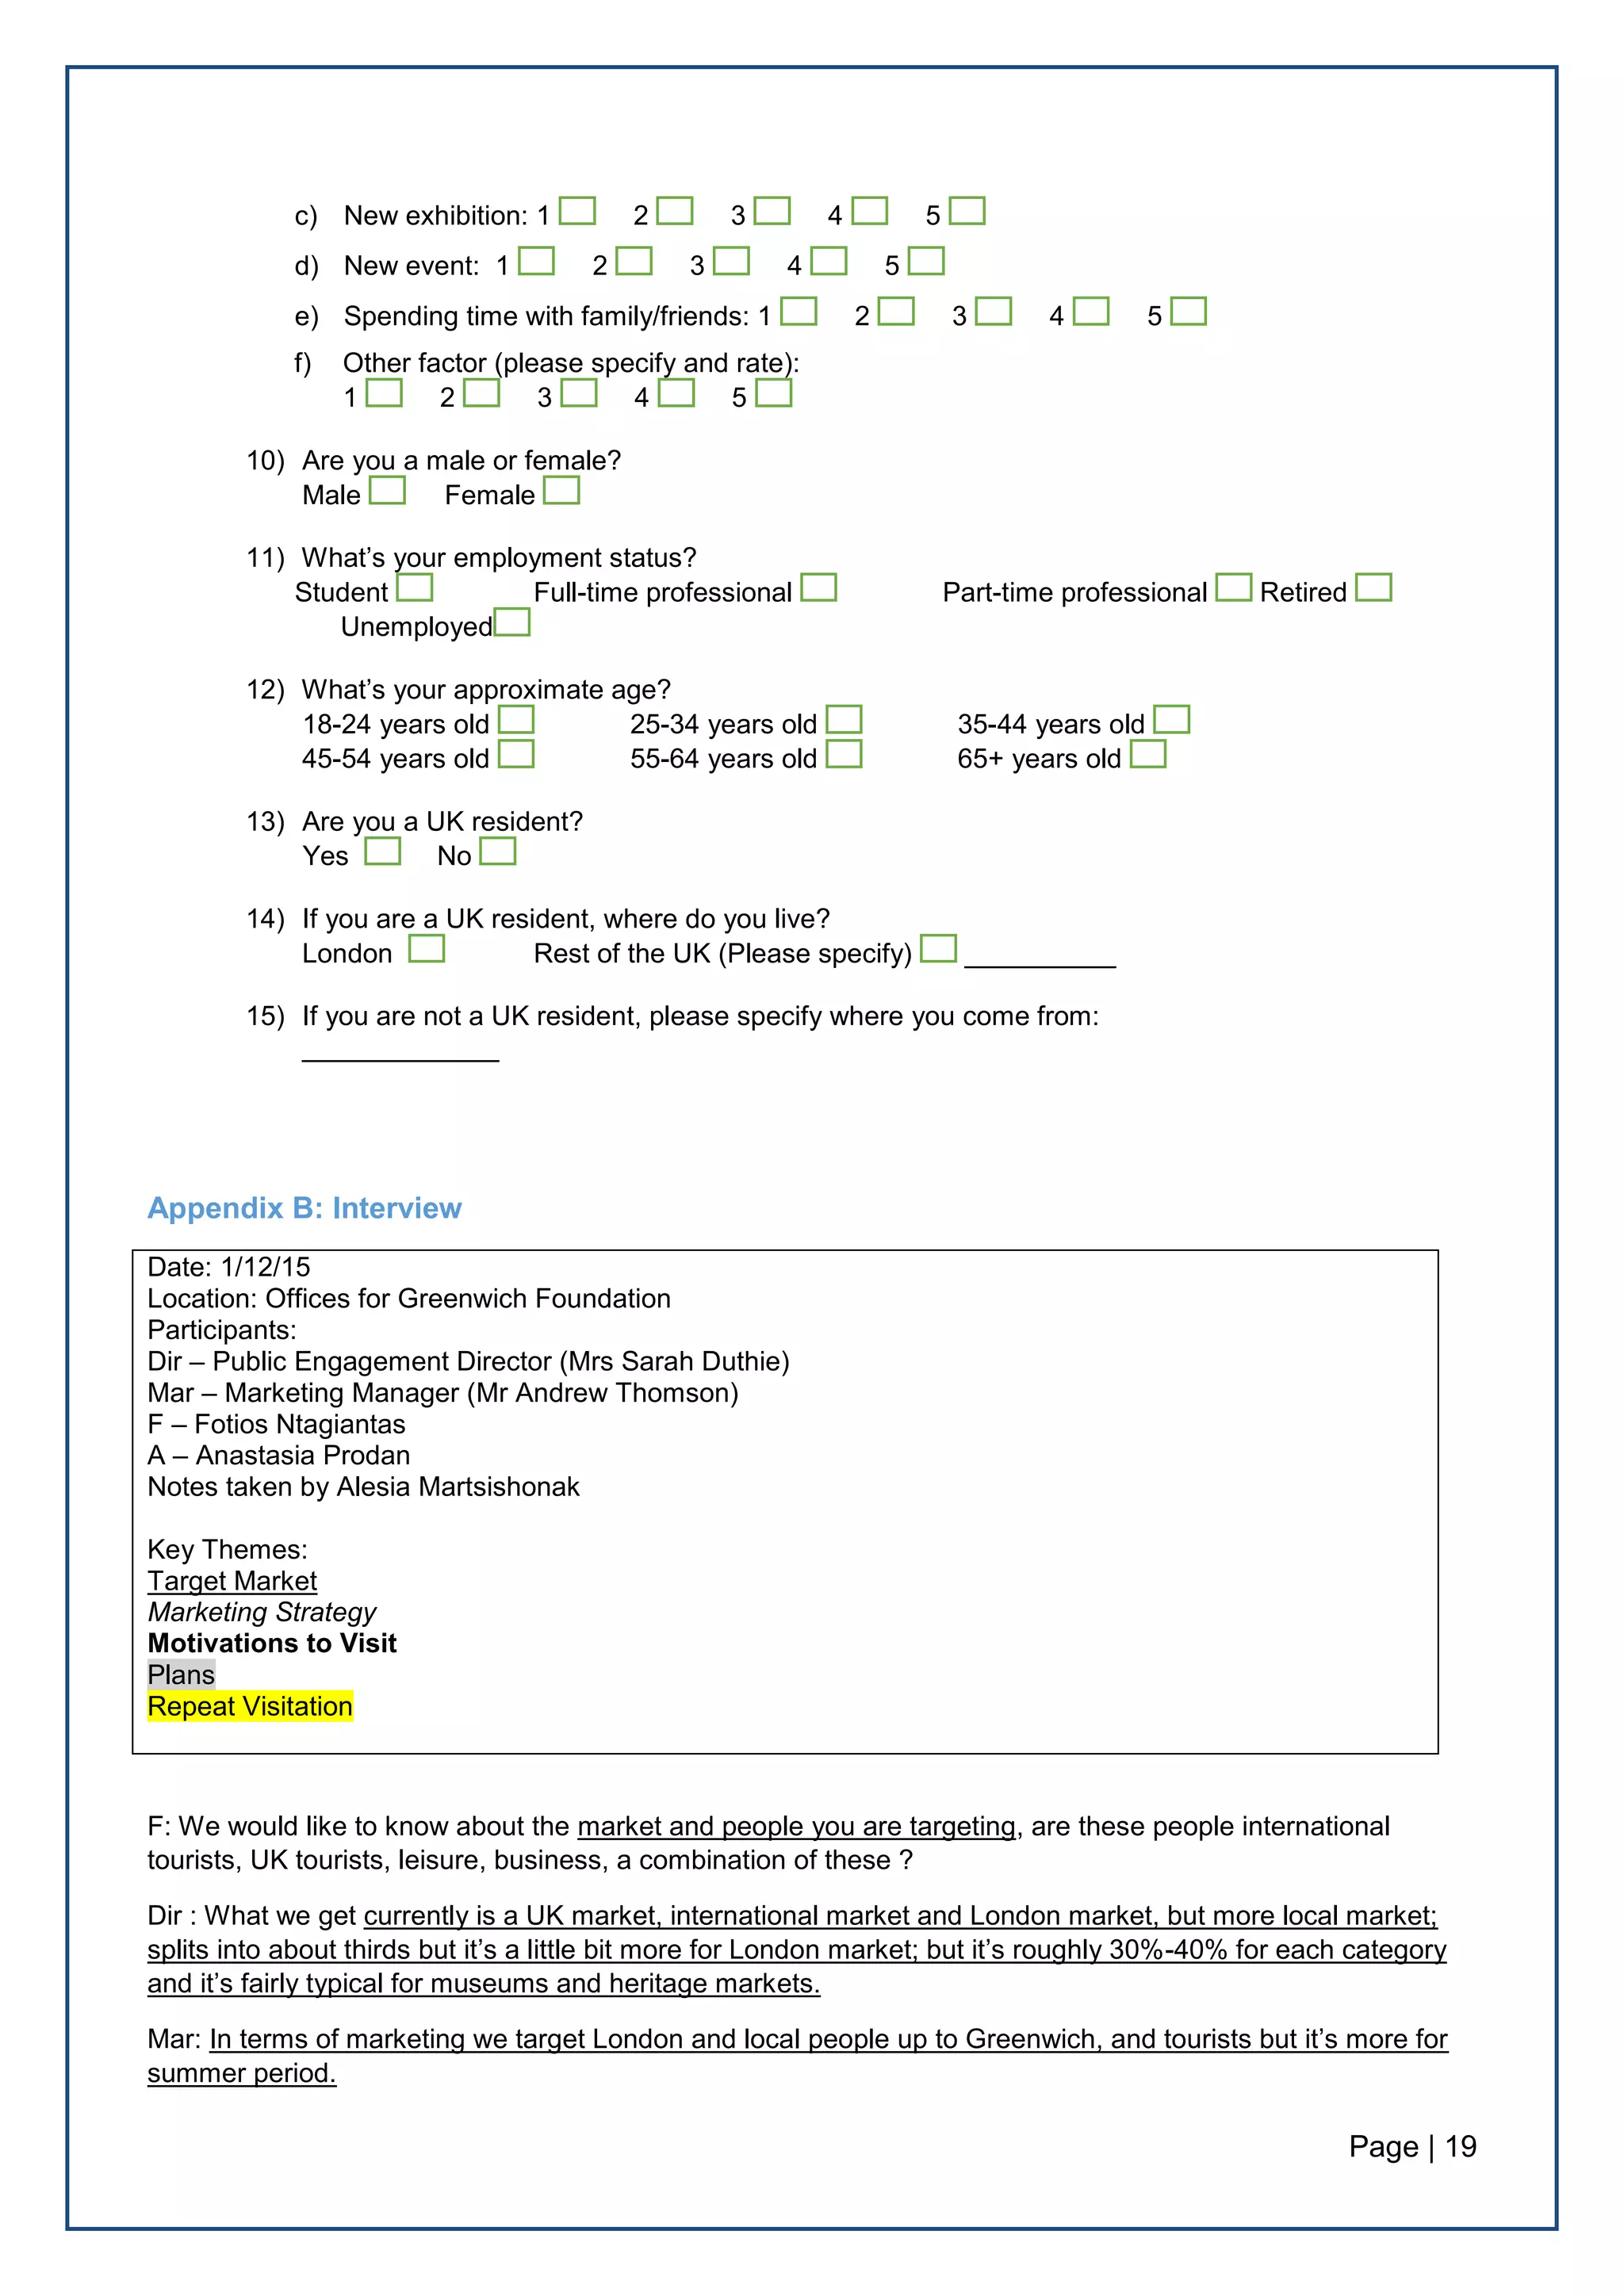
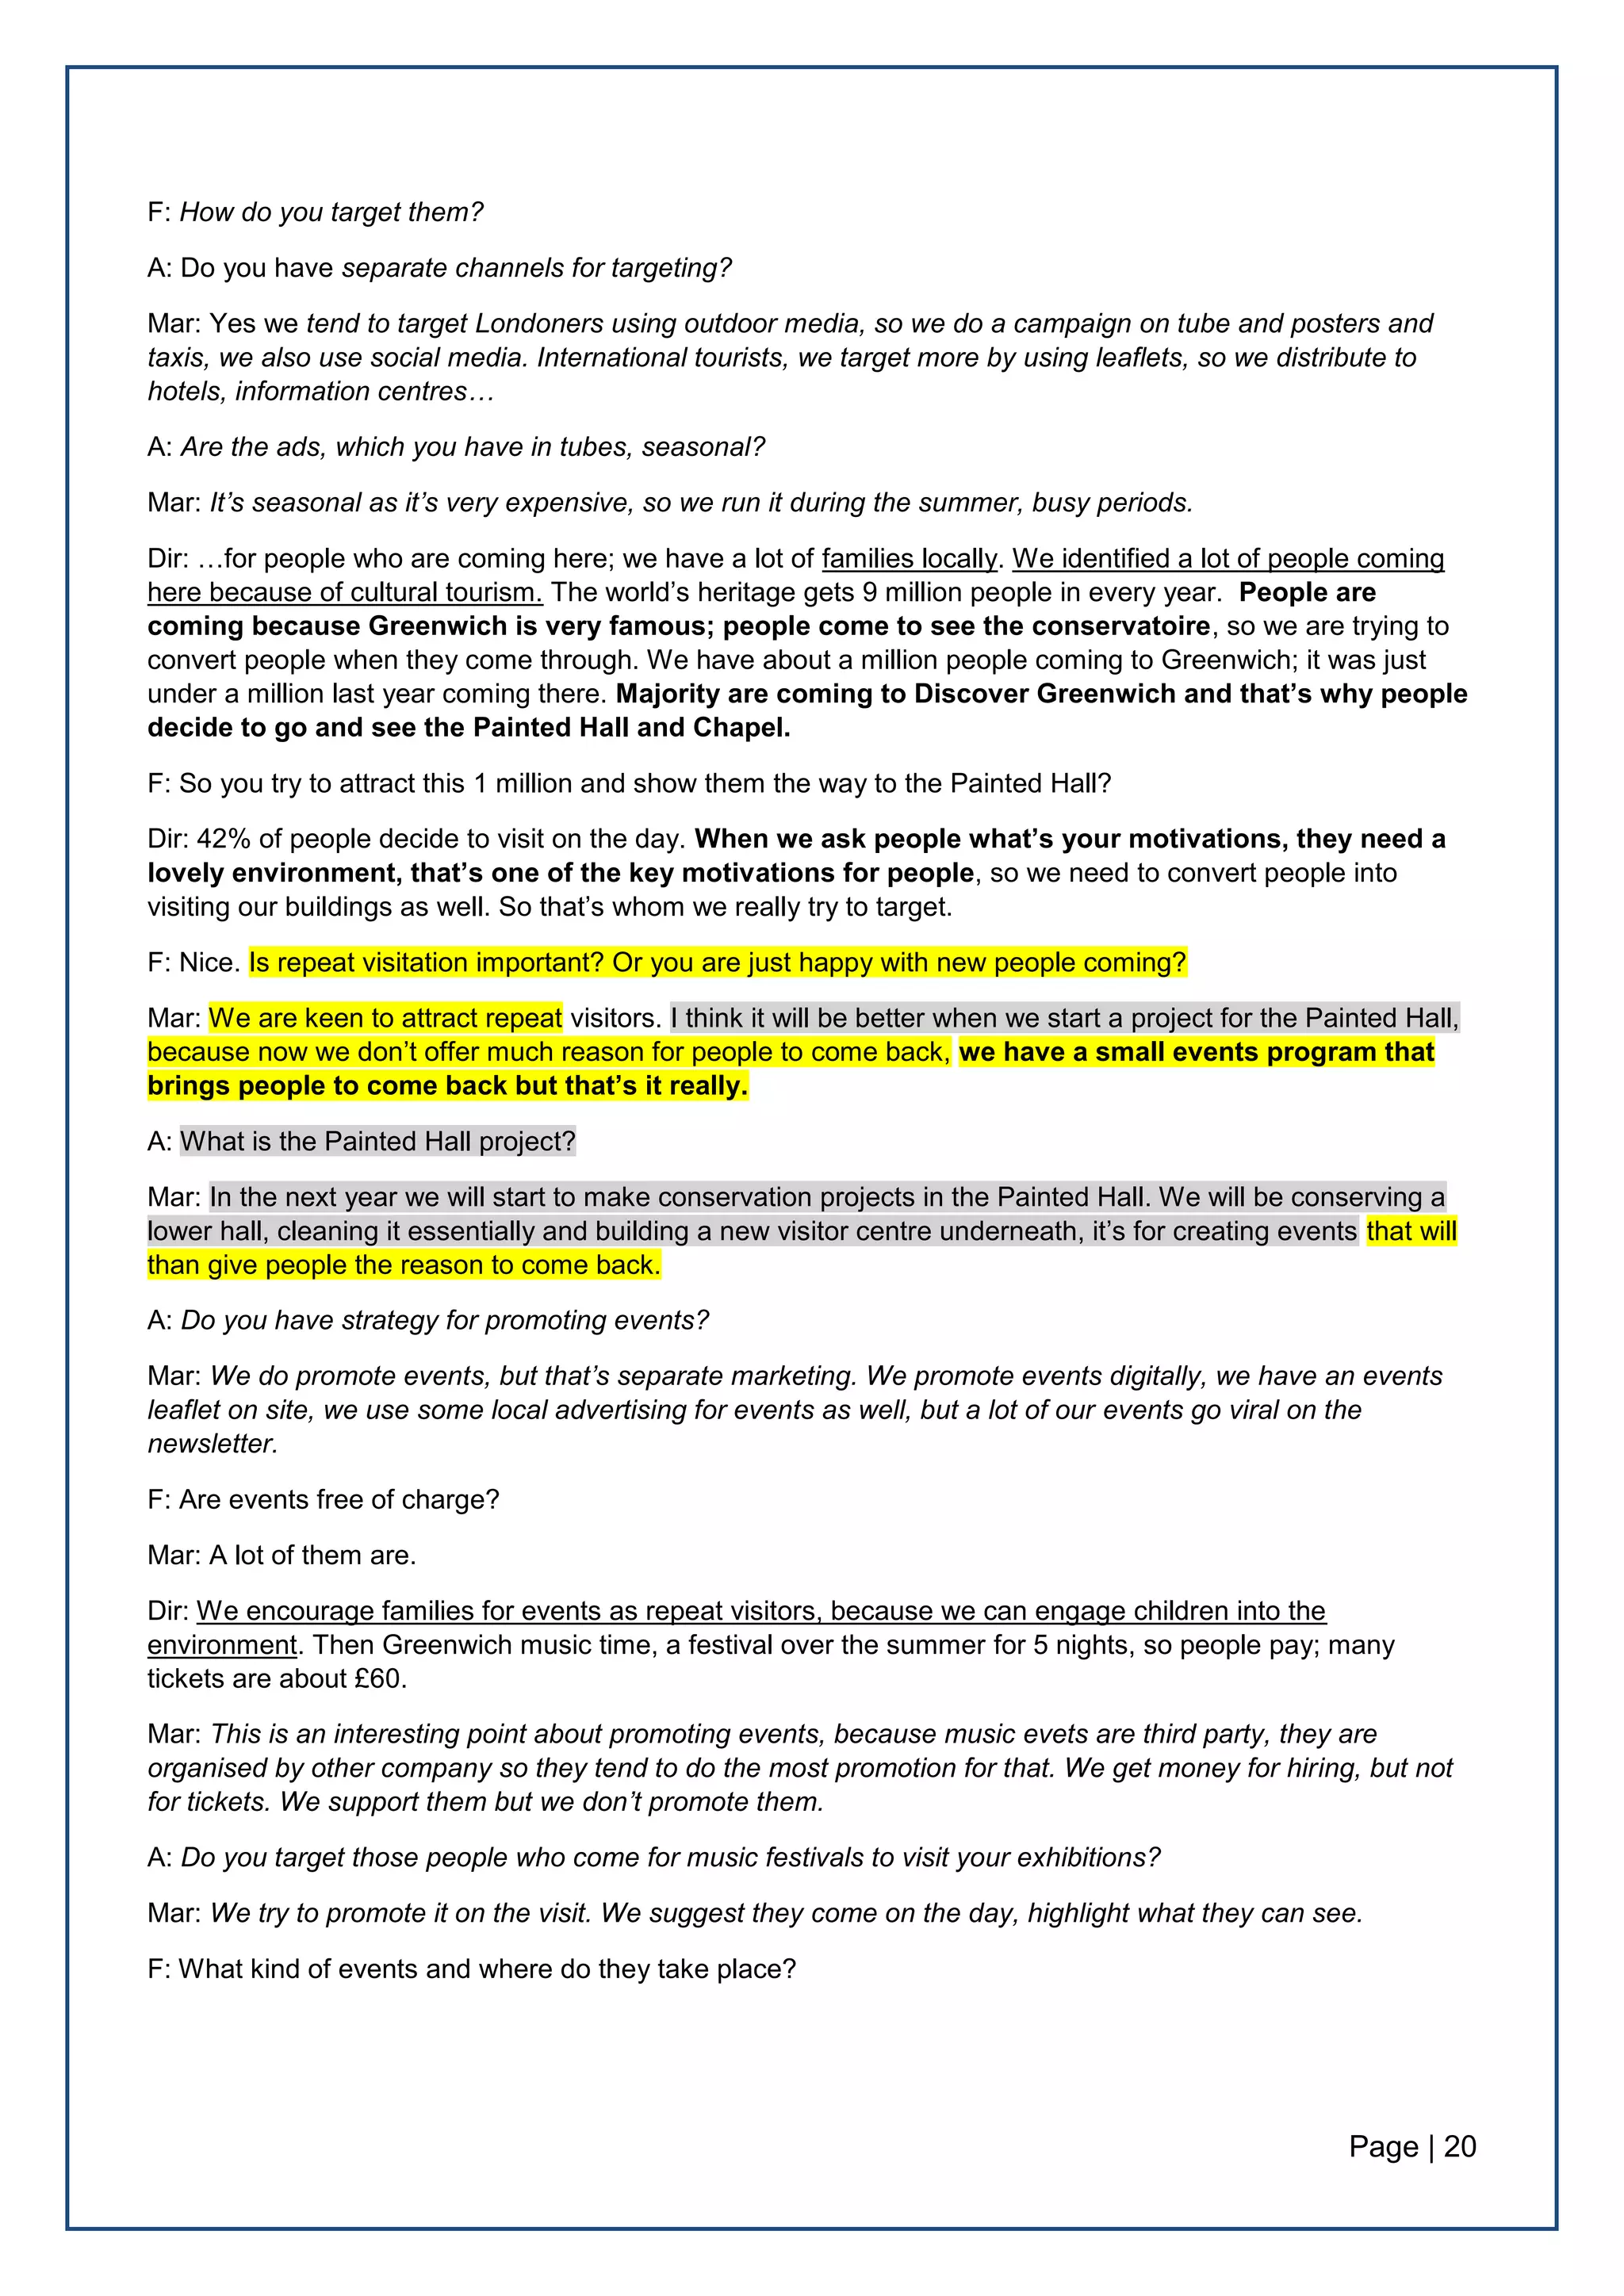
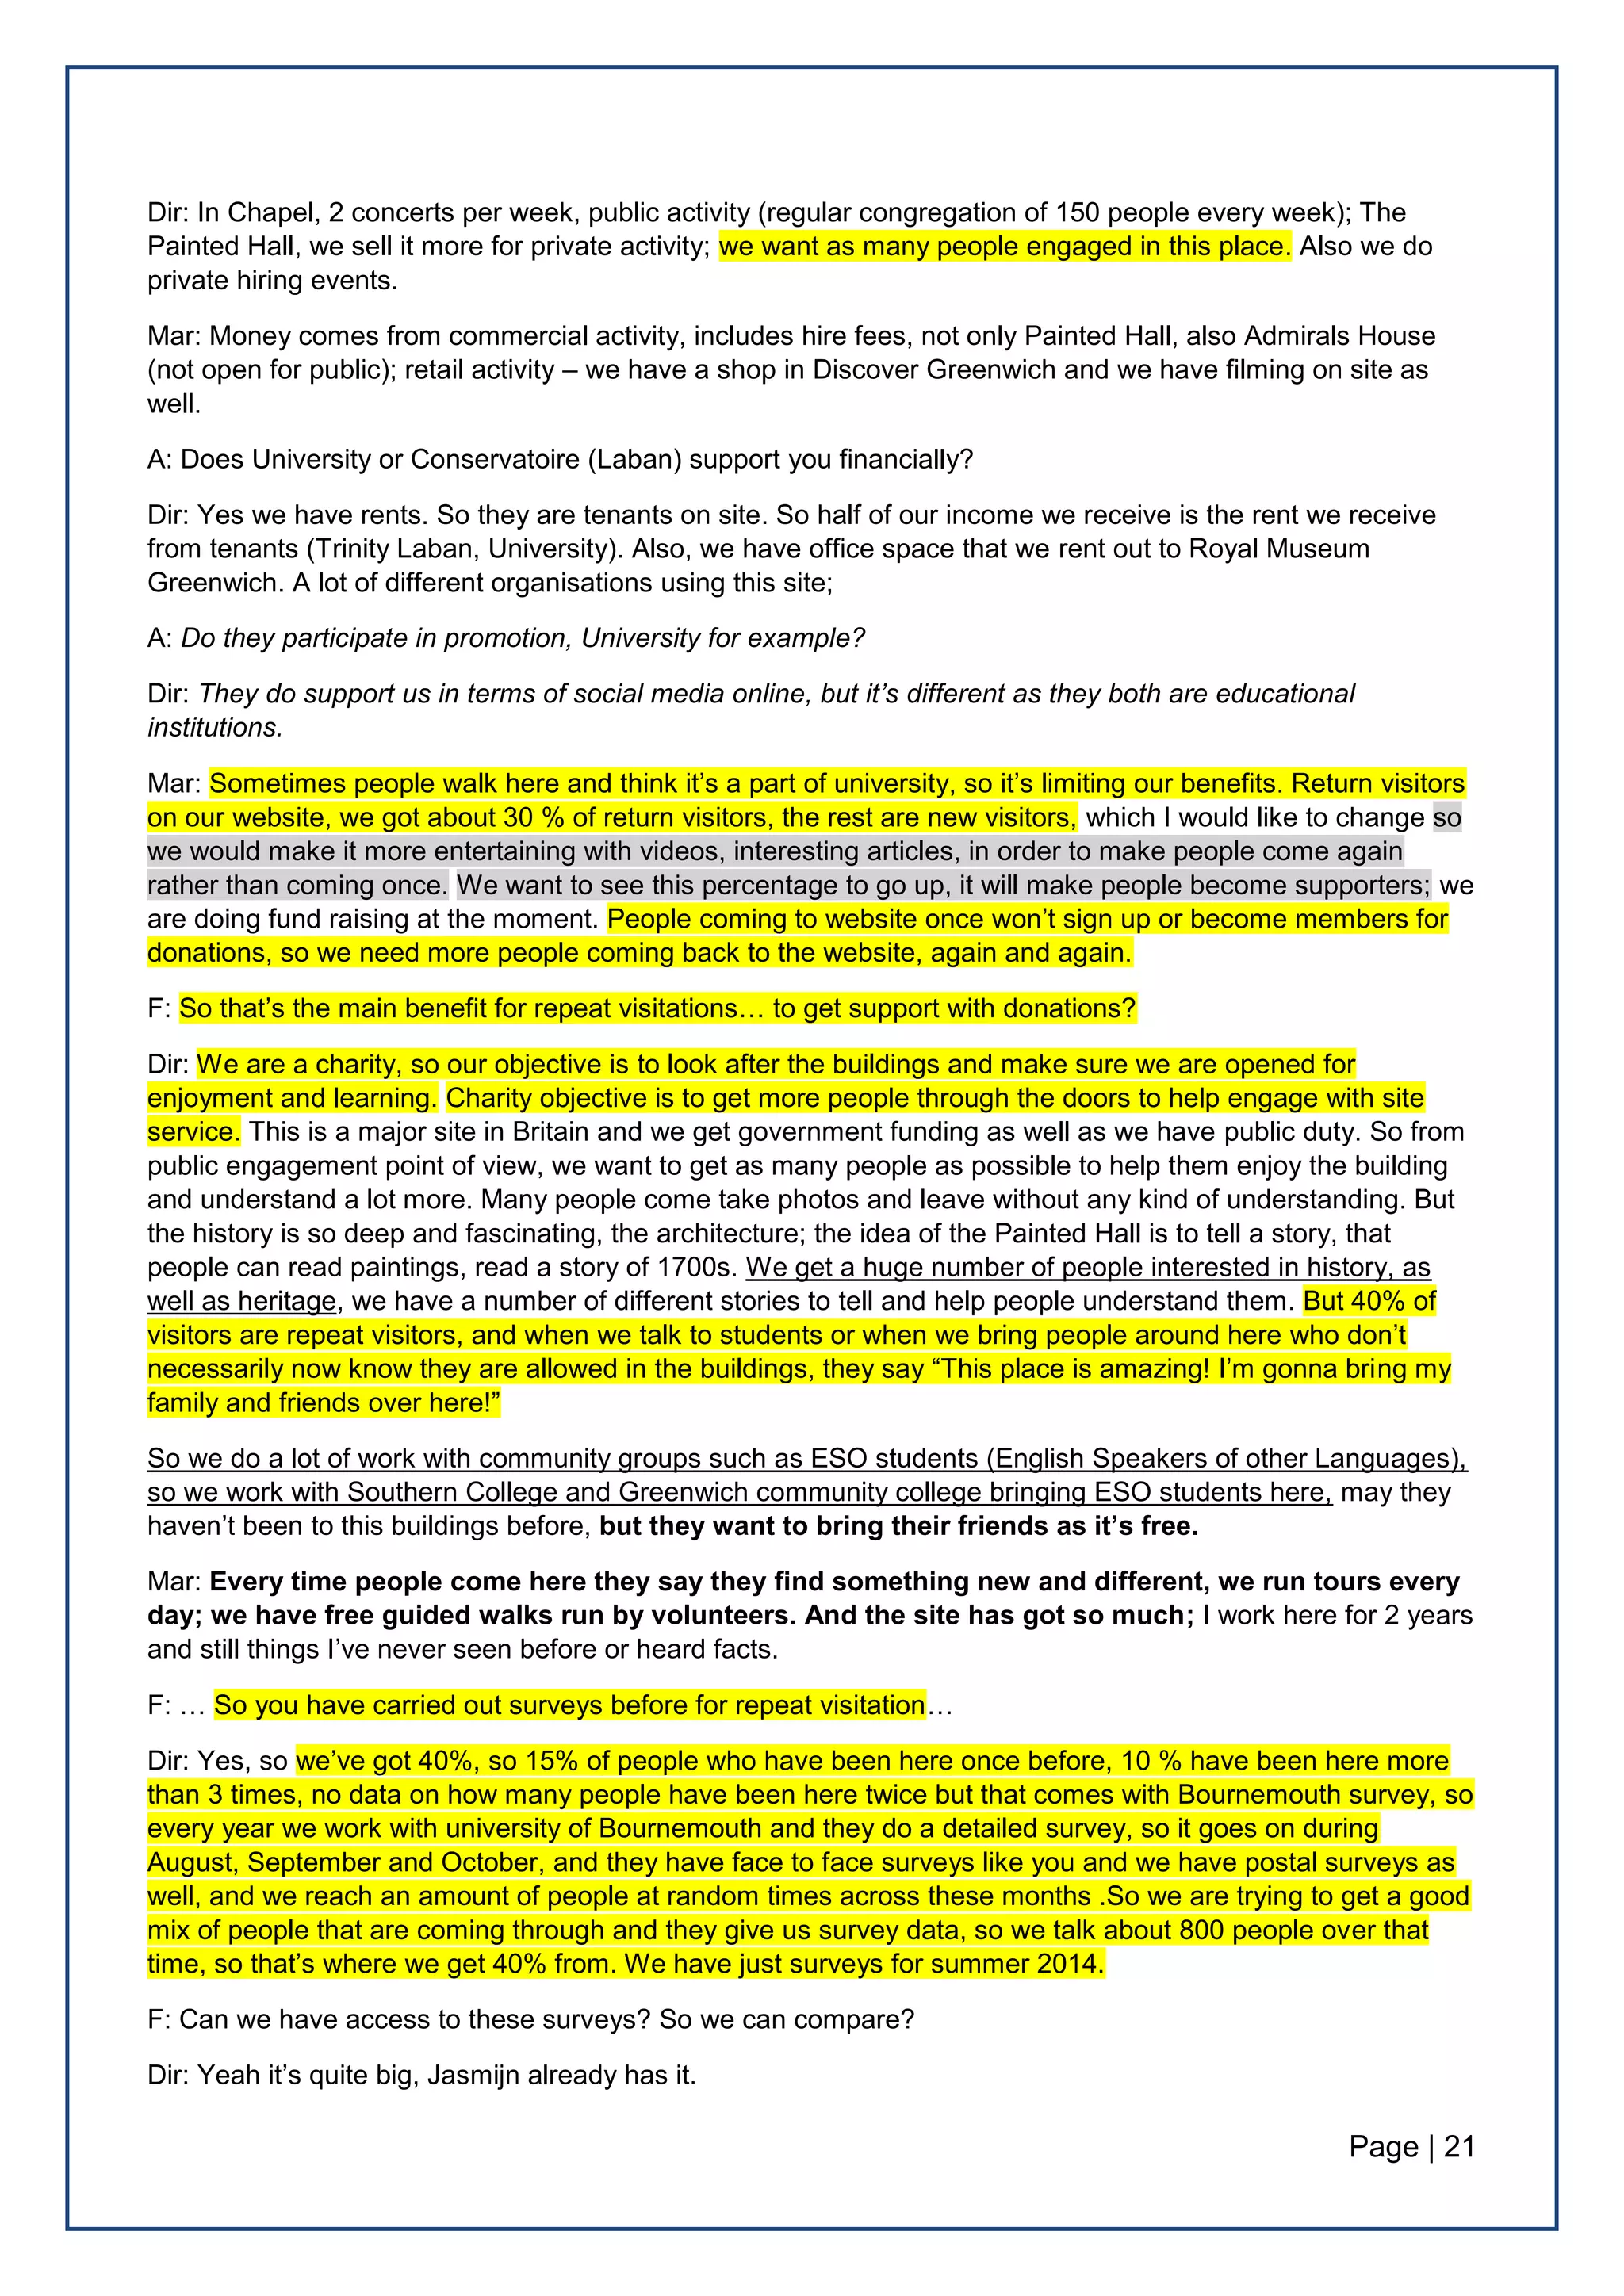
2.2 Interview
We decided to go for a semi-structured interview, as we had certain topics in mind that we wanted
to raise but we were also open to gain further information about the attraction. The main topics were
related to the attraction’s target market, marketing strategy, future plans, existing knowledge of
repeat visitation rates and idea of what motivates someone to visit.
Fourth Street acted again as the intermediary, arranging the details of the interview. 3 members of
our group and 2 employees from the ORNC in managerial positions were present: Mrs Sarah
Duthie, the Public Engagement Director, and Andrew Thomson, the Marketing Manager. The
interview took place at 1/12/2015 at the Offices for Greenwich Foundation and lasted approximately
40 minutes. It was
The interview was recorded upon mutual agreement and later transcribed. Thematic analysis was
used to highlight the key points [Appendix B].
3. Project Findings
3.1 Visitor Profile
The overall sample was generally well balanced in terms of demographics. An even split of male
and female visitors was captured, spreading across all age groups, with the “18-24 years old”
bracket taking the lead at 27%. With regards to employment status, the museum was most popular
with full-time professionals (45%), while students comprised one quarter of the sample.
Noticeably, the overwhelming majority of respondents cited “leisure” as their primary reason for their
visit (78%), while approximately half of them had visited a museum 4 or more times during the last
year.
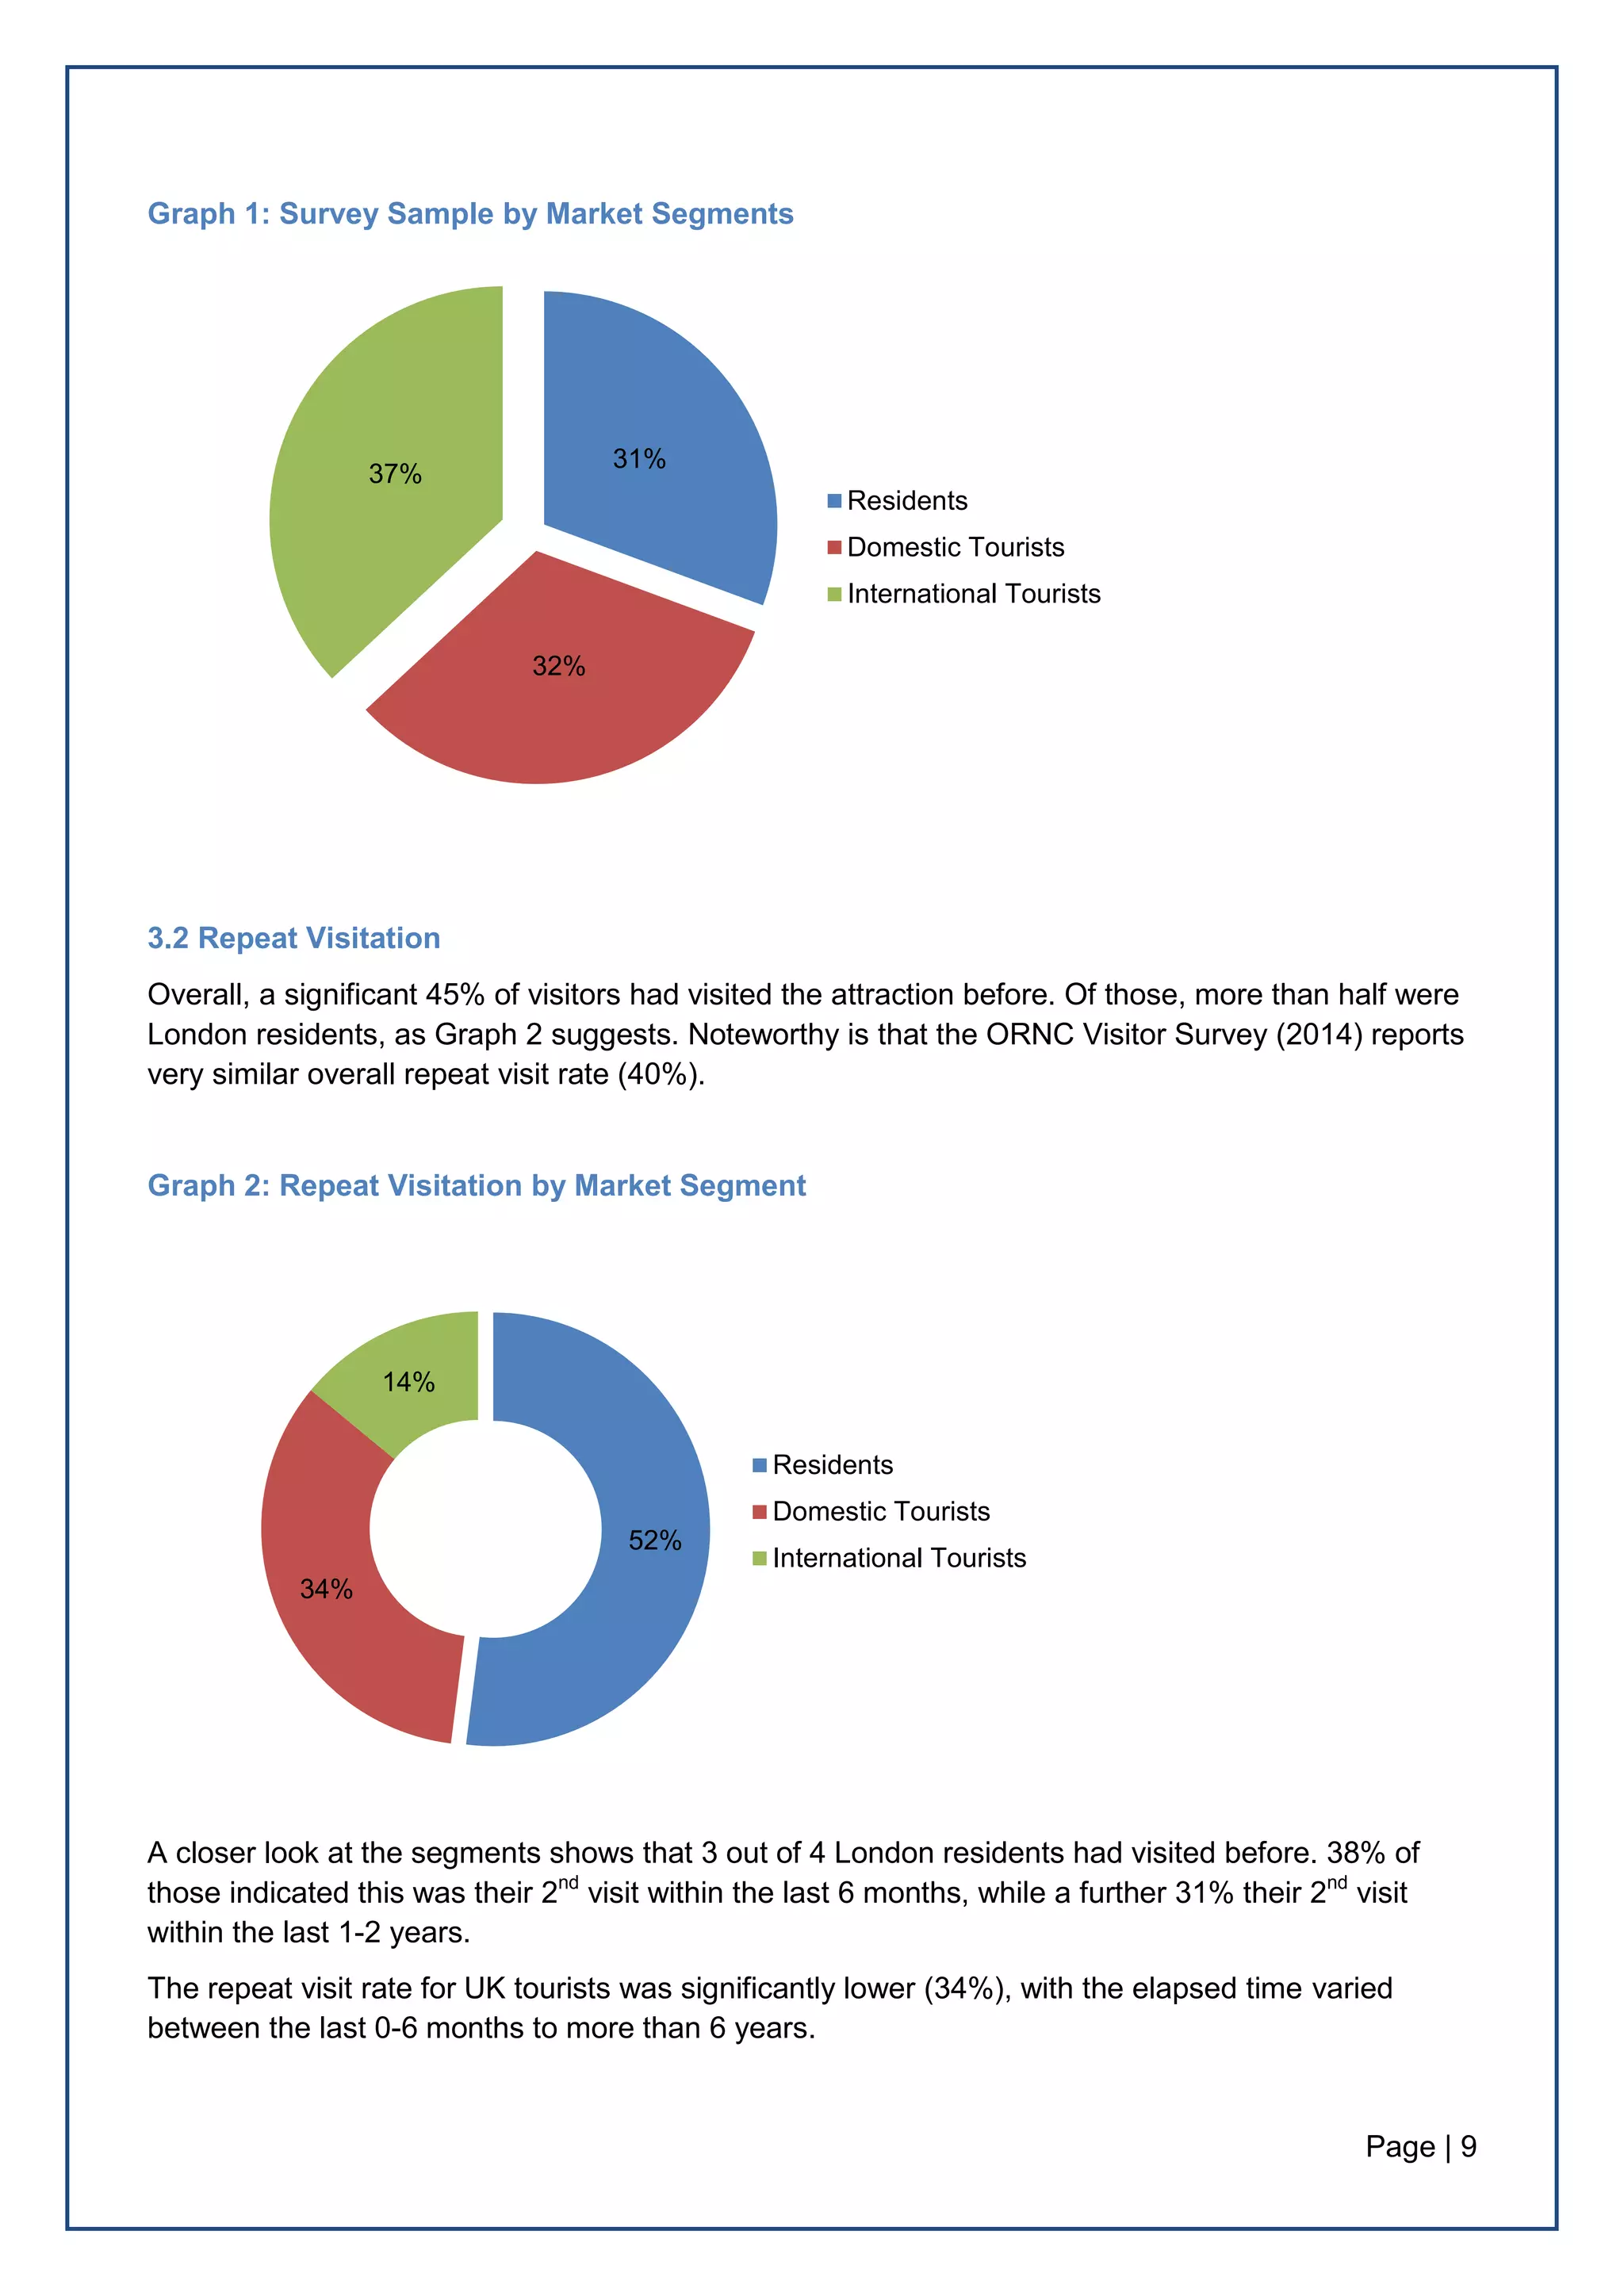
3 main market segments were identified while analysing the surveys, each with distinctive
behavioural patterns in terms of repeat visitation:
1) Day visitors: These are residents of Greenwich and the rest of London.
2) Domestic tourists: These are tourists from the UK that make a trip to London. The surveys
captured a good mix of UK visitors from places that are within close proximity to London,
such as Woking, Kent, and Brighton, but also far away, such as Wales, Scotland, and
Ireland.
3) International tourists: These are inbound tourists visiting London. USA, Germany, Italy, and
France are only some of the countries of residence included in the sample.
As Graph 1 illustrates, there was a balanced split between the 3 segments in the sample. This is
consistent with our interview findings, with the exception that residents are believed to comprise a
slightly bigger market share than the other 2.](https://image.slidesharecdn.com/f243a4ff-b5b6-47a7-a1f6-06b92a1a5775-160320051914/75/Repeat-Visitation-to-Visitor-Attractions-Report-for-Fourth-Street-9-2048.jpg)
![Page | 17
5. Reference List
Anderson, D. (2000). “Crystal ball gazing”. Locum Destination Review, 2(1), pp. 41-42.[Online]. Available at:
http://www.colliers.com/-/media/files/emea/uk/research/destination-consulting/crystal-ball-gazing.pdf
(Accessed: 08 December 2015).
Baloglu, S. and Uysal, M. (1996). “Market segments of push and pull motivations: a canonical correlation
approach”. International Journal of contemporary Hospitality Management, 3(8), pp. 32-38.
Birchall, D. and Ridge, M. (2014). “Post-web technology: what comes next for museums?” The Guardian. 03
October [Online] Available at: http://www.theguardian.com/culture-professionals-network/culture-
professionals-blog/2014/oct/03/post-web-technology-museums-virtual-reality (Accessed 13 December 2015).
Black, G. (2005). The Engaging Museum. London: Routledge.
Cyr, D., Head, M., Larios, H. and Pan, B. (2009). “Exploring Human Images in Website Design: A Multi-
Method Approach”. MIS Quaterly 33(3). pp. 542-543. [Online]. Available at:
http://www.jstor.org/stable/20650308?seq=5#page_scan_tab_contents (Accessed 13 December 2015).
Fakeye, P. and Crompton, J.L. (1992). “Importance of socialisation to repeat visitation”. Annals of Tourism
Research, 19 (2), pp. 364-367.
Kruger, M.,Saayman, M. and Ellis, M. S. (2010) ”Does loyalty pay? First-time versus repeat visitors at a
national arts festival”. Southern African Business Review, 14(1), pp. 79-104.
Old Royal Naval College (2014) “Visitor Survey Report”. London.
Old Royal Naval College (2015) Visitor Numbers. London.
Oppermann, M. (1998). “Tourismus journal”. Tourism Management, 19(4), pp. 395-396.
Oppermann, M. (2000). “Tourism Destination Loyalty”. Journal of Travel Research, 39(1), pp. 78-84.
Ryan, C. (1995). Researching Tourist Satisfaction: Issues, Concepts, Problems. London: Routledge.
Uysal, M. and Hagan, L.A.R. (1993). “Motivation of pleasure travel and tourism”. Encyclopedia of Hospitality
and Tourism, pp. 798-810.
The British Museum (2015) Support us. Available at:
http://www.britishmuseum.org/support_us/your_support/success_stories/samsung.aspx (Accessed: 13
December 2015).
Woodside, A. and Lysonski, S. (1989). A general model of traveler destination choice.
Yuan, S. and McDonald, C. (1990). “Motivational determinants of international pleasure time”. Journal of
Travel Research, 24(1), pp. 42-44.](https://image.slidesharecdn.com/f243a4ff-b5b6-47a7-a1f6-06b92a1a5775-160320051914/75/Repeat-Visitation-to-Visitor-Attractions-Report-for-Fourth-Street-18-2048.jpg)