Download to read offline


![RESEARCH32 33
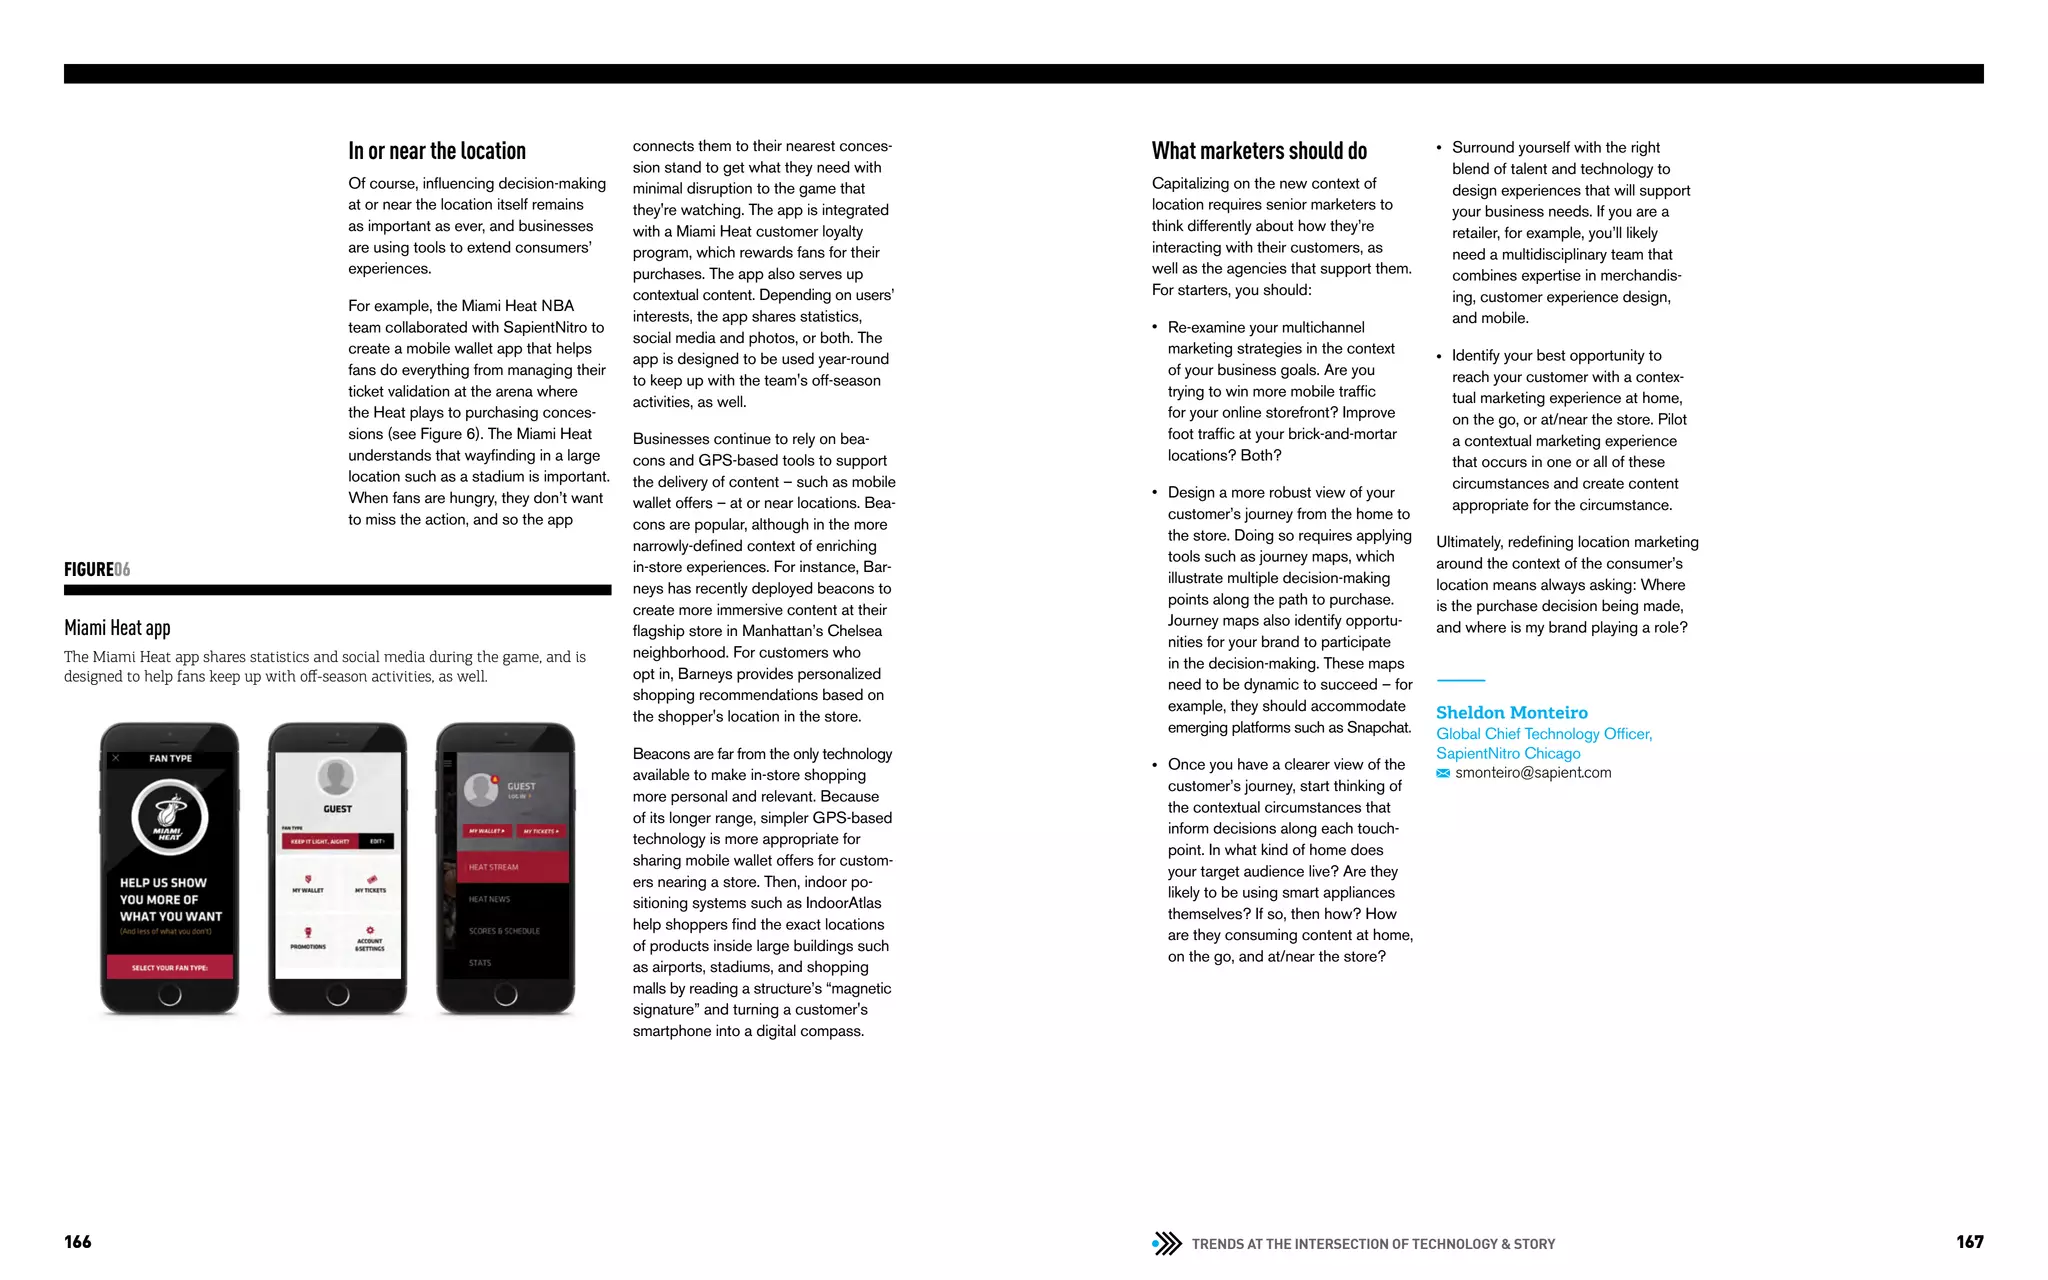
Rules for creating retail experiences
How do you go about defining the best combination of physical and
digital for your brand? Our research uncovered five overarching rules
to keep in mind when designing the future of your retail experience.
1Retailers must become
more flexible, immersive,
and fit for purpose
Digital extensions — a great interactive
kiosk, mobile app, or sales associate
tool — are no longer enough. Retail
brands must reimagine their business
in the age of the customer.
Digital transformation is on the agenda
of retailers and their boardrooms.
According to a 2015 International
Data Corporation (IDC) study, nearly
two-thirds (64 percent) of Western
European retailers are currently under-
taking a formal digital transformation
5
IDC. “64% of Western European Retailers Currently Undergoing Formal Digital Transformation Effort, While Further 21% About to Start by End of the Year, Says IDC.”
https://www.idc.com/getdoc.jsp?containerId=prUK25829515.
program, while a further 21 percent
were expected to have started one by
the end of 2015. They note that a “race
to digitize [is] taking place among the
largest retailers in Europe.”5
Our research shows that more trans-
formation is sorely needed. If there is
one overarching finding from our study
it is this: The examples that we saw in
market do not go far enough toward
rethinking the retail business for the
digital age.
Based on our research, we see the top
reimagining priorities to be centered
around three main questions:
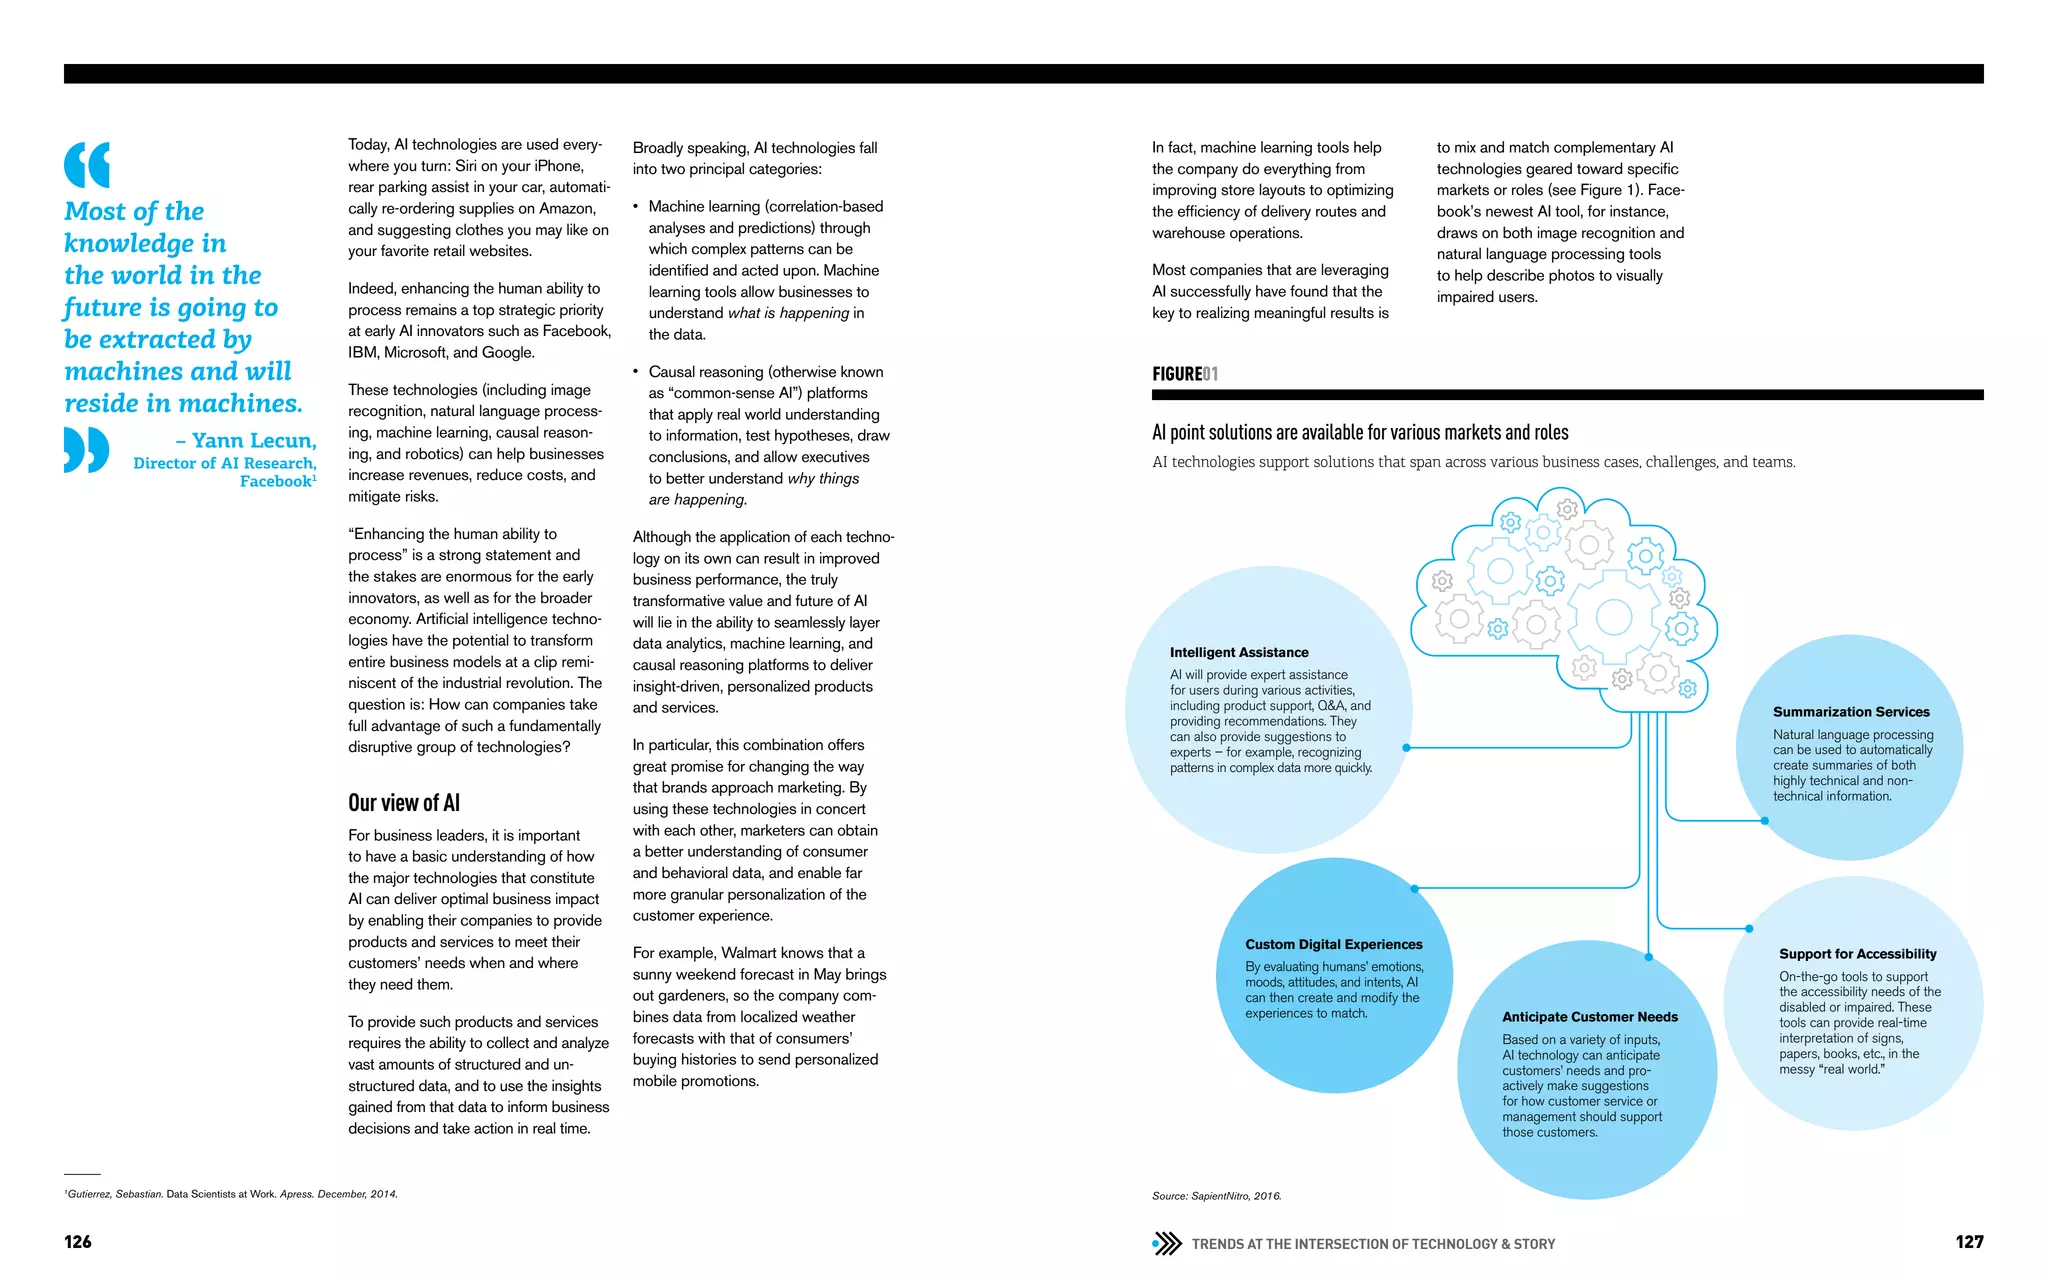
You’ve been matched:
the output of the ColorIQ process
Sephora’s ColorIQ measures skin color, sets up follow-up purchases of
various foundations, and also offers a hands-on experience in the store.
FIGURE03
1HOW CAN YOU IMPROVE
FLEXIBILITY?
Retailing in the digital age should be
more flexible than in the past. This
means omnichannel and visibility; click
and collect; mobile ordering; ship-to-
home; and all the permutations. Our
leaders — Apple, Argos, and Sephora
— have all made significant progress in
this area (see Figure 3). In the UK, spe-
cifically in the cities, click and collect/
reserve has been credited with stalling
the decline in footfall. In fact, at one
leading UK retailer, it accounts for the
majority of orders via online platforms.
2HOW CAN YOU MAKE
THE EXPERIENCE MORE
IMMERSIVE?
On the less frequent occasions that
customers do go to the store, they
need to be greeted by great experiences.
Museum quality if you’re selling tech
hardware. Dynamic changing rooms
and great customer service if you’re in
apparel. Smaller spaces. Better tools.
Faster service.
3HOW CAN YOU MAKE
YOUR RETAILING PROPER-
TIES FIT FOR PURPOSE?
Retailing properties (mobile, e-com-
merce, and physical) should be fit for
purpose. Retailers in the digital age
need inventory, but they don’t need as
much inventory. Endless aisle tools,
smartphones, visibility of inventory, and
sales associates (You do have visibility,
right?) all mean more flexibility. Reduce
square footage, invest in community
events, and make the store and brand
be more connected to humans. Look
to recent trends in bookstores and
banks — fewer, smaller, and more
beautiful examples with higher sales
per square foot.](https://image.slidesharecdn.com/reimaginingbusinessintheagefinal-191209221024/75/Reimagining-Business-in-the-Age-of-the-Customer-18-2048.jpg)


![65OUR PERSPECTIVES
Customer experience (CX) has finally reached prime time. It is being recognized
broadly as a key differentiator of the products and services that businesses offer,
no matter what the industry. Business leaders get it: The environments they create
and interactions they foster for their customers define their brands. As such, they
need to pay closer attention to experience design and related disciplines [in-
cluding user experience (UX), customer experience (CX), and human computer
interactions (HCI)].
Along with the aforementioned C-level epiphany, experience designers and product
managers are being inundated with (often contradictory) advice from bloggers,
analysts, and self-proclaimed experts on how to achieve breakthrough experiences.
And, among this rabble, those same product managers have also formed their own
opinions about experience design – opinions which are often heavily influenced by
idiosyncratic brand loyalties.
In a world where digital interactions pervade almost every experience that custom-
ers have with a brand, business leaders can’t afford to get UX wrong. But how can
they get it right when design opinions are endless, design patterns are seemingly
infinite, and consumer interactions and expectations are ever-evolving?
We recommend starting by taking a step back, understanding the foundations of
experience design, and debunking some of the contemporary, mainstream myths.
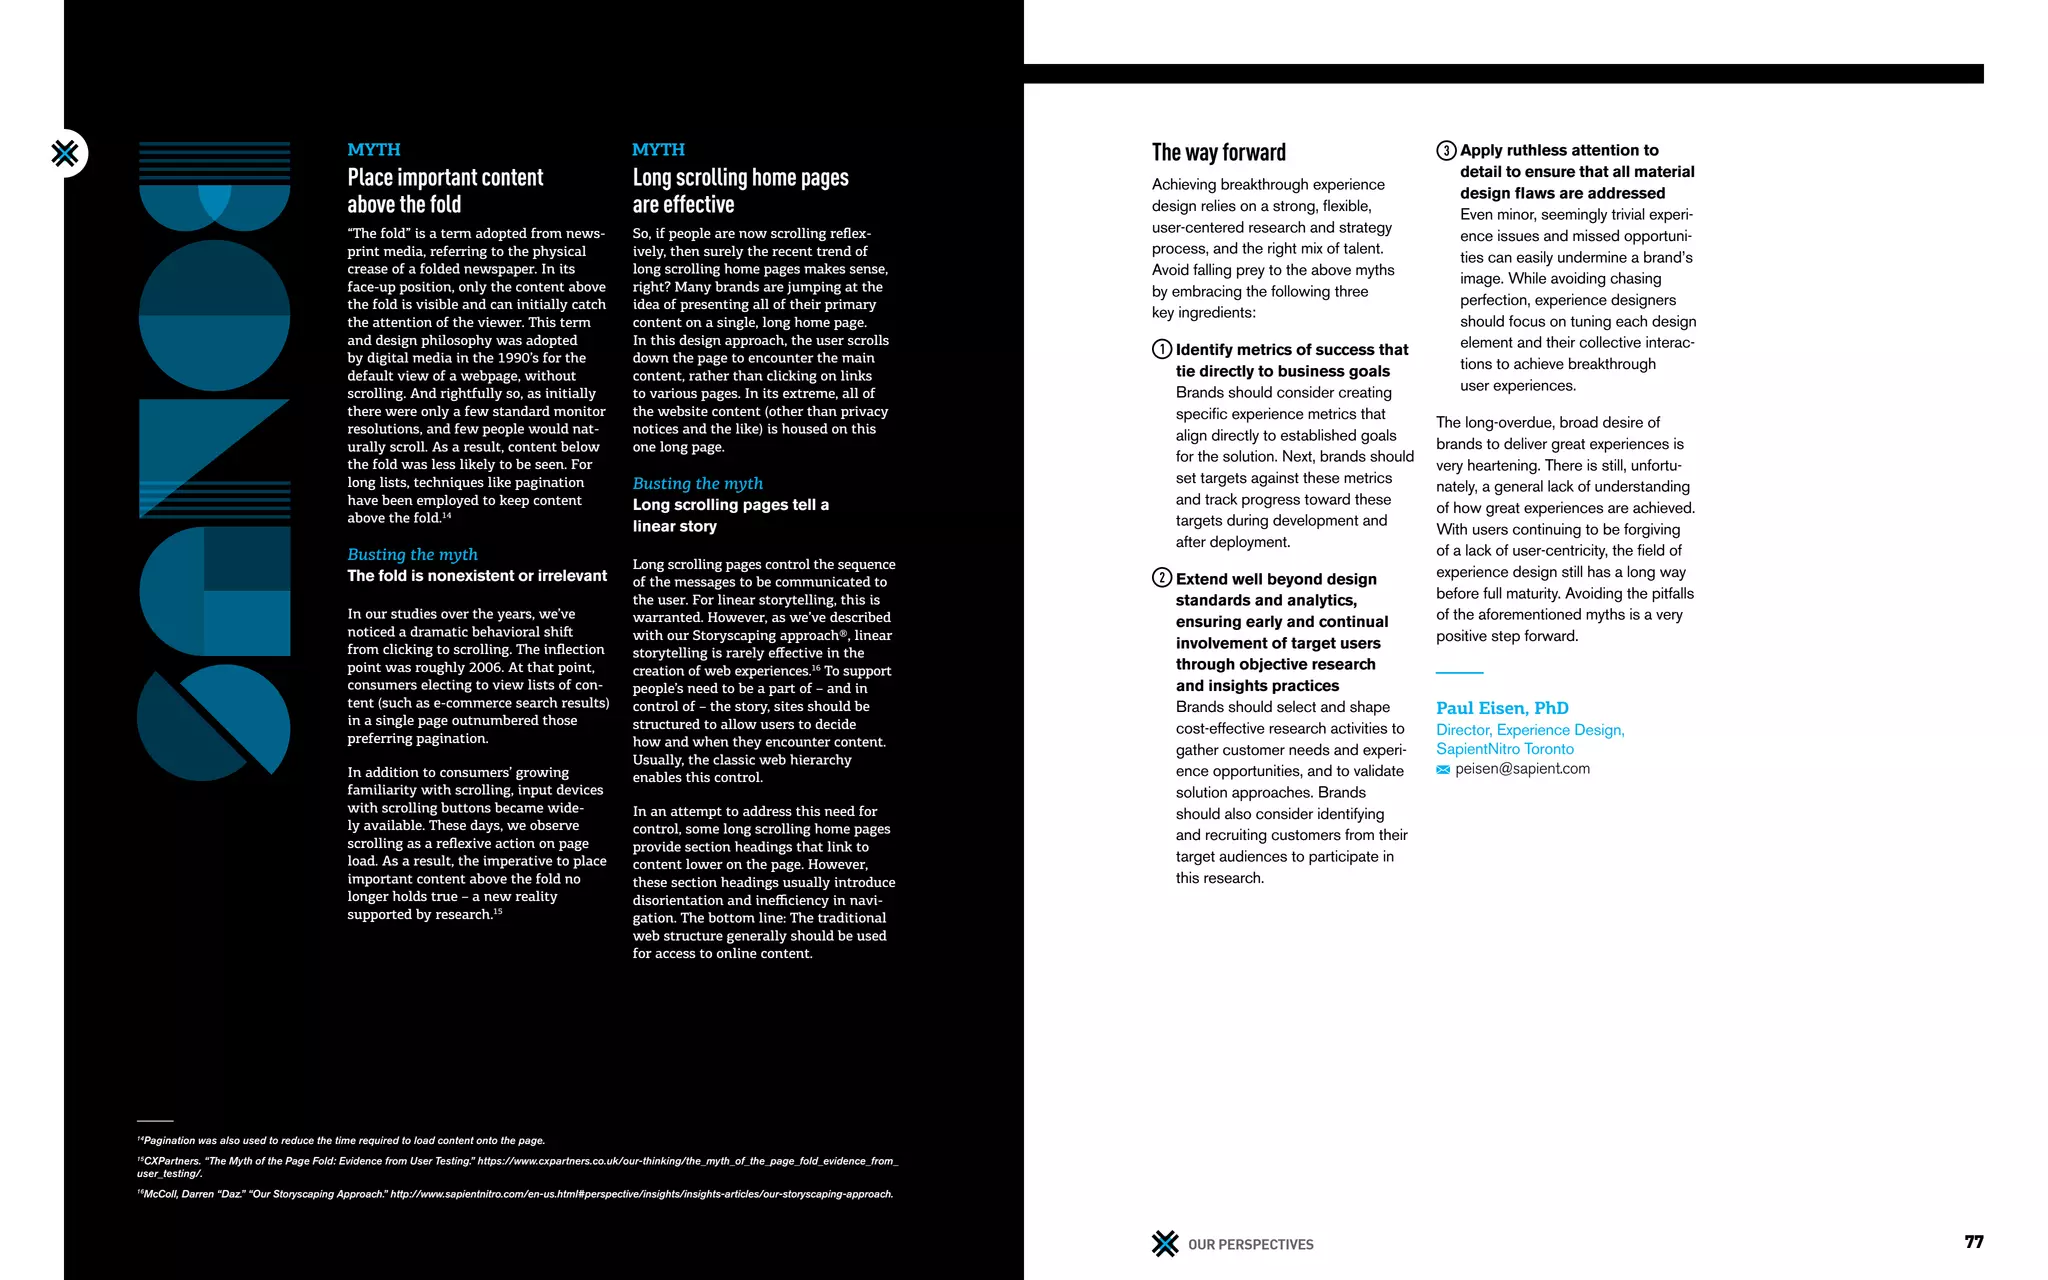
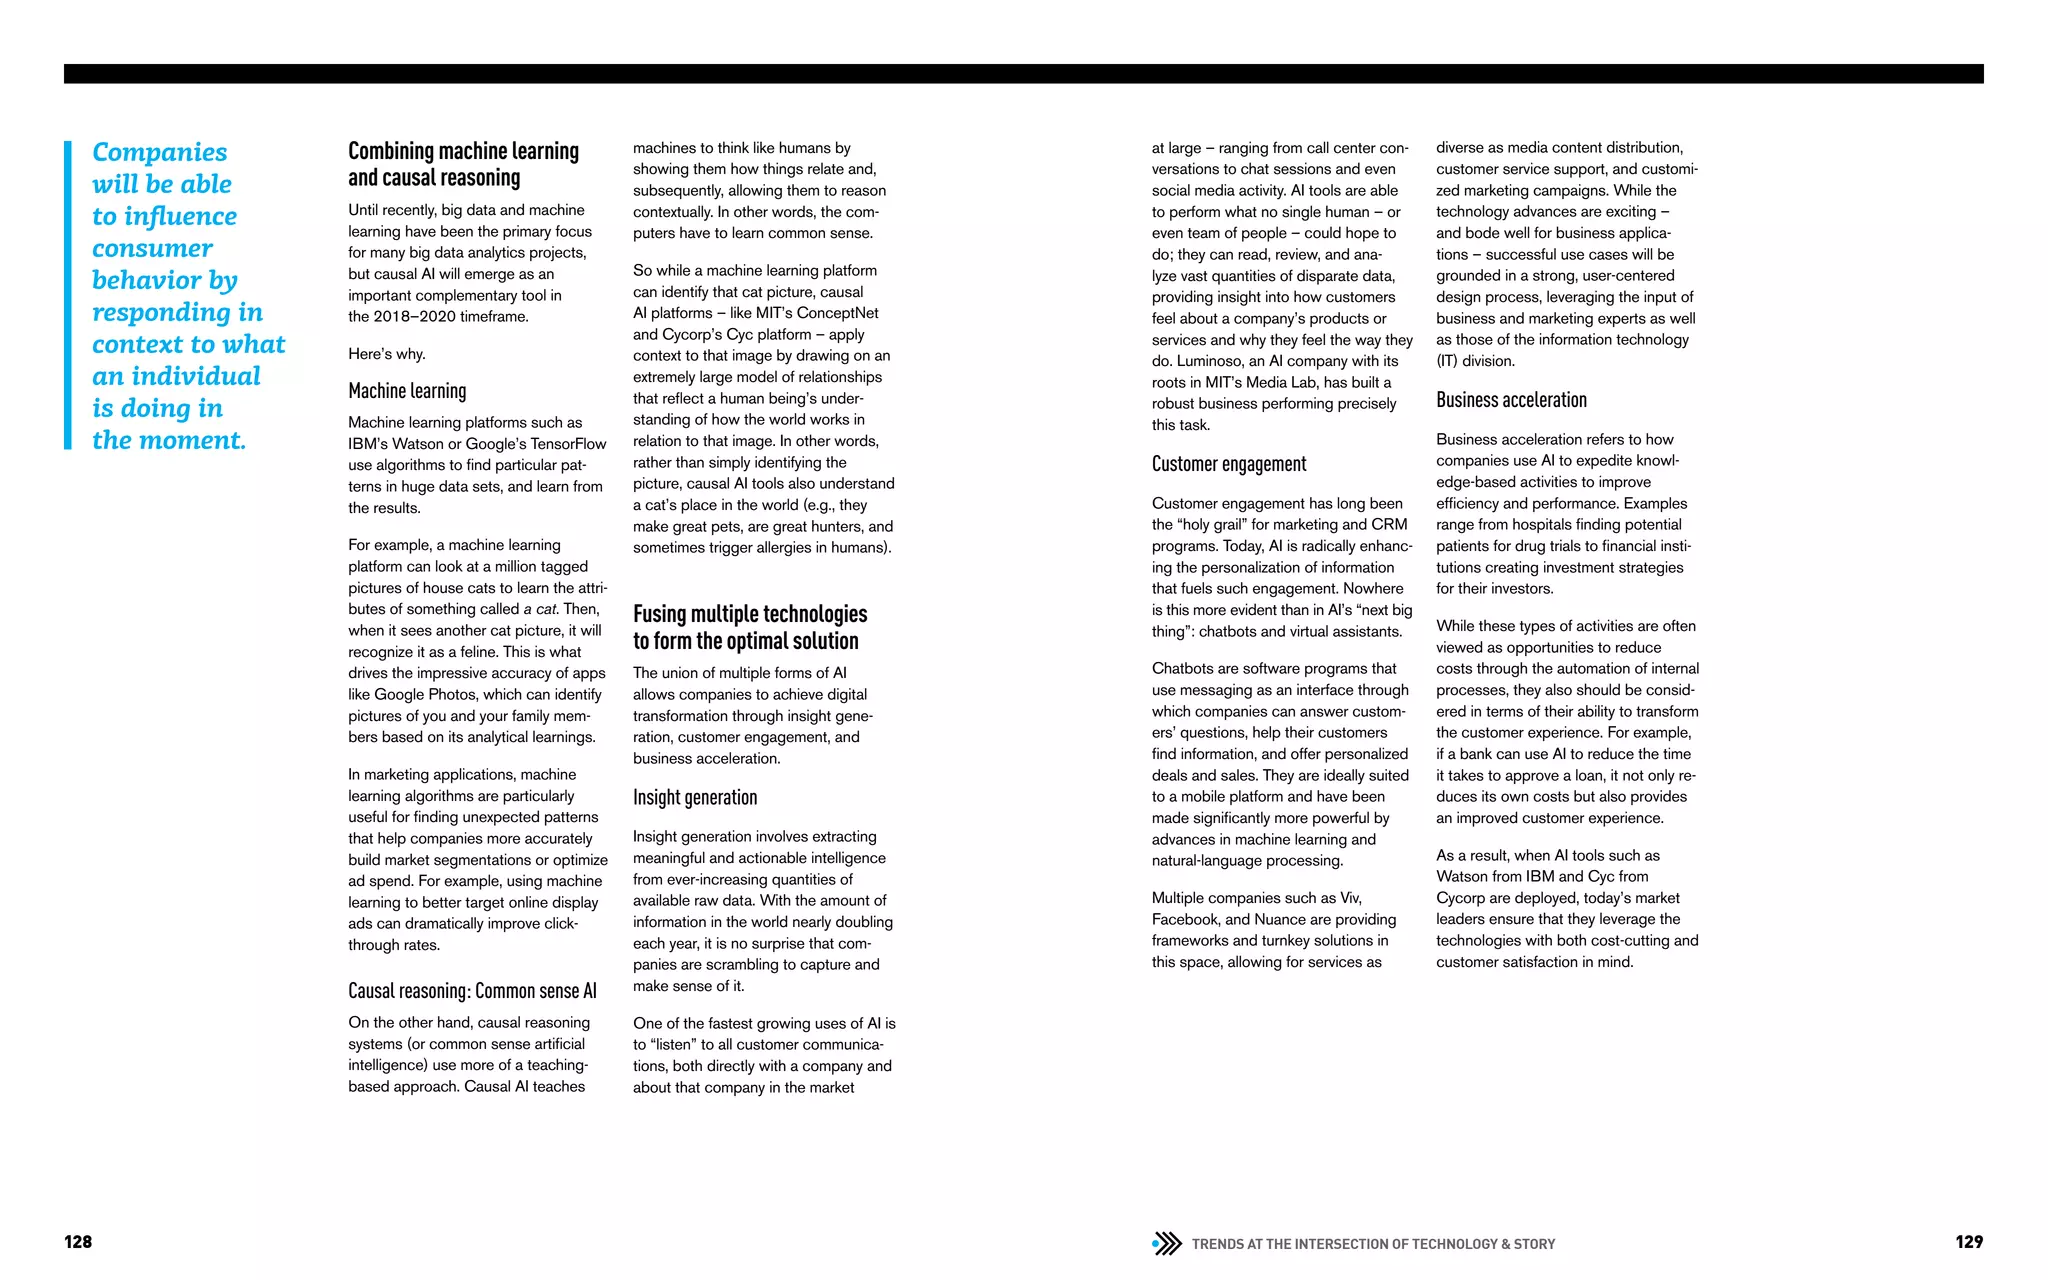
DISPELLING
5 MYTHS ABOUT
EXPERIENCEDESIGN
PAUL EISEN, PhD](https://image.slidesharecdn.com/reimaginingbusinessintheagefinal-191209221024/75/Reimagining-Business-in-the-Age-of-the-Customer-34-2048.jpg)


![96 97OUR PERSPECTIVES
In a separate question, the culture
and mindset change was the biggest
challenge. One expert noted, “[the
biggest challenge] is the people and
not the technology. Changing people’s
mindset, be it for agile, microservices or
experimentation-orientation, would take
considerable effort.”
In today’s always-on age, customers
are less patient and expect to interact
almost instantly. This requires software
delivery to be transformed into an
outside-in function that plans, builds,
and runs technology according to how
customers move within market spaces.
In this article, we explain how we’ve
helped clients embrace continuous
delivery, and respond to the challenge
of the always-on age. We’ll also share
our latest research into enterprise
IT practices and the current state of
enterprise IT.
A culture of experimentation
The single, greatest key to embracing
continuous delivery is culture, and
systematically building a culture of
rapid change. Both Amazon and
Google emphasize their “fail fast”
culture, with Jeff Bezos, for example,
noting that “[Amazon is] the best place
in the world to fail.” To put it simply,
these firms build and pilot hundreds of
ideas to find the successful ones.5
For
example, Google's 25,000 engineers
reportedly modify 15 million lines of
code across 250,000 files each week.6
The only constant is change.
This experimentation culture is particu-
larly important in retail (or any customer-
facing channel) where it is key to
truly realizing returns from the major
e-commerce, content, or digital market-
ing platform implementation projects
that are now largely complete.
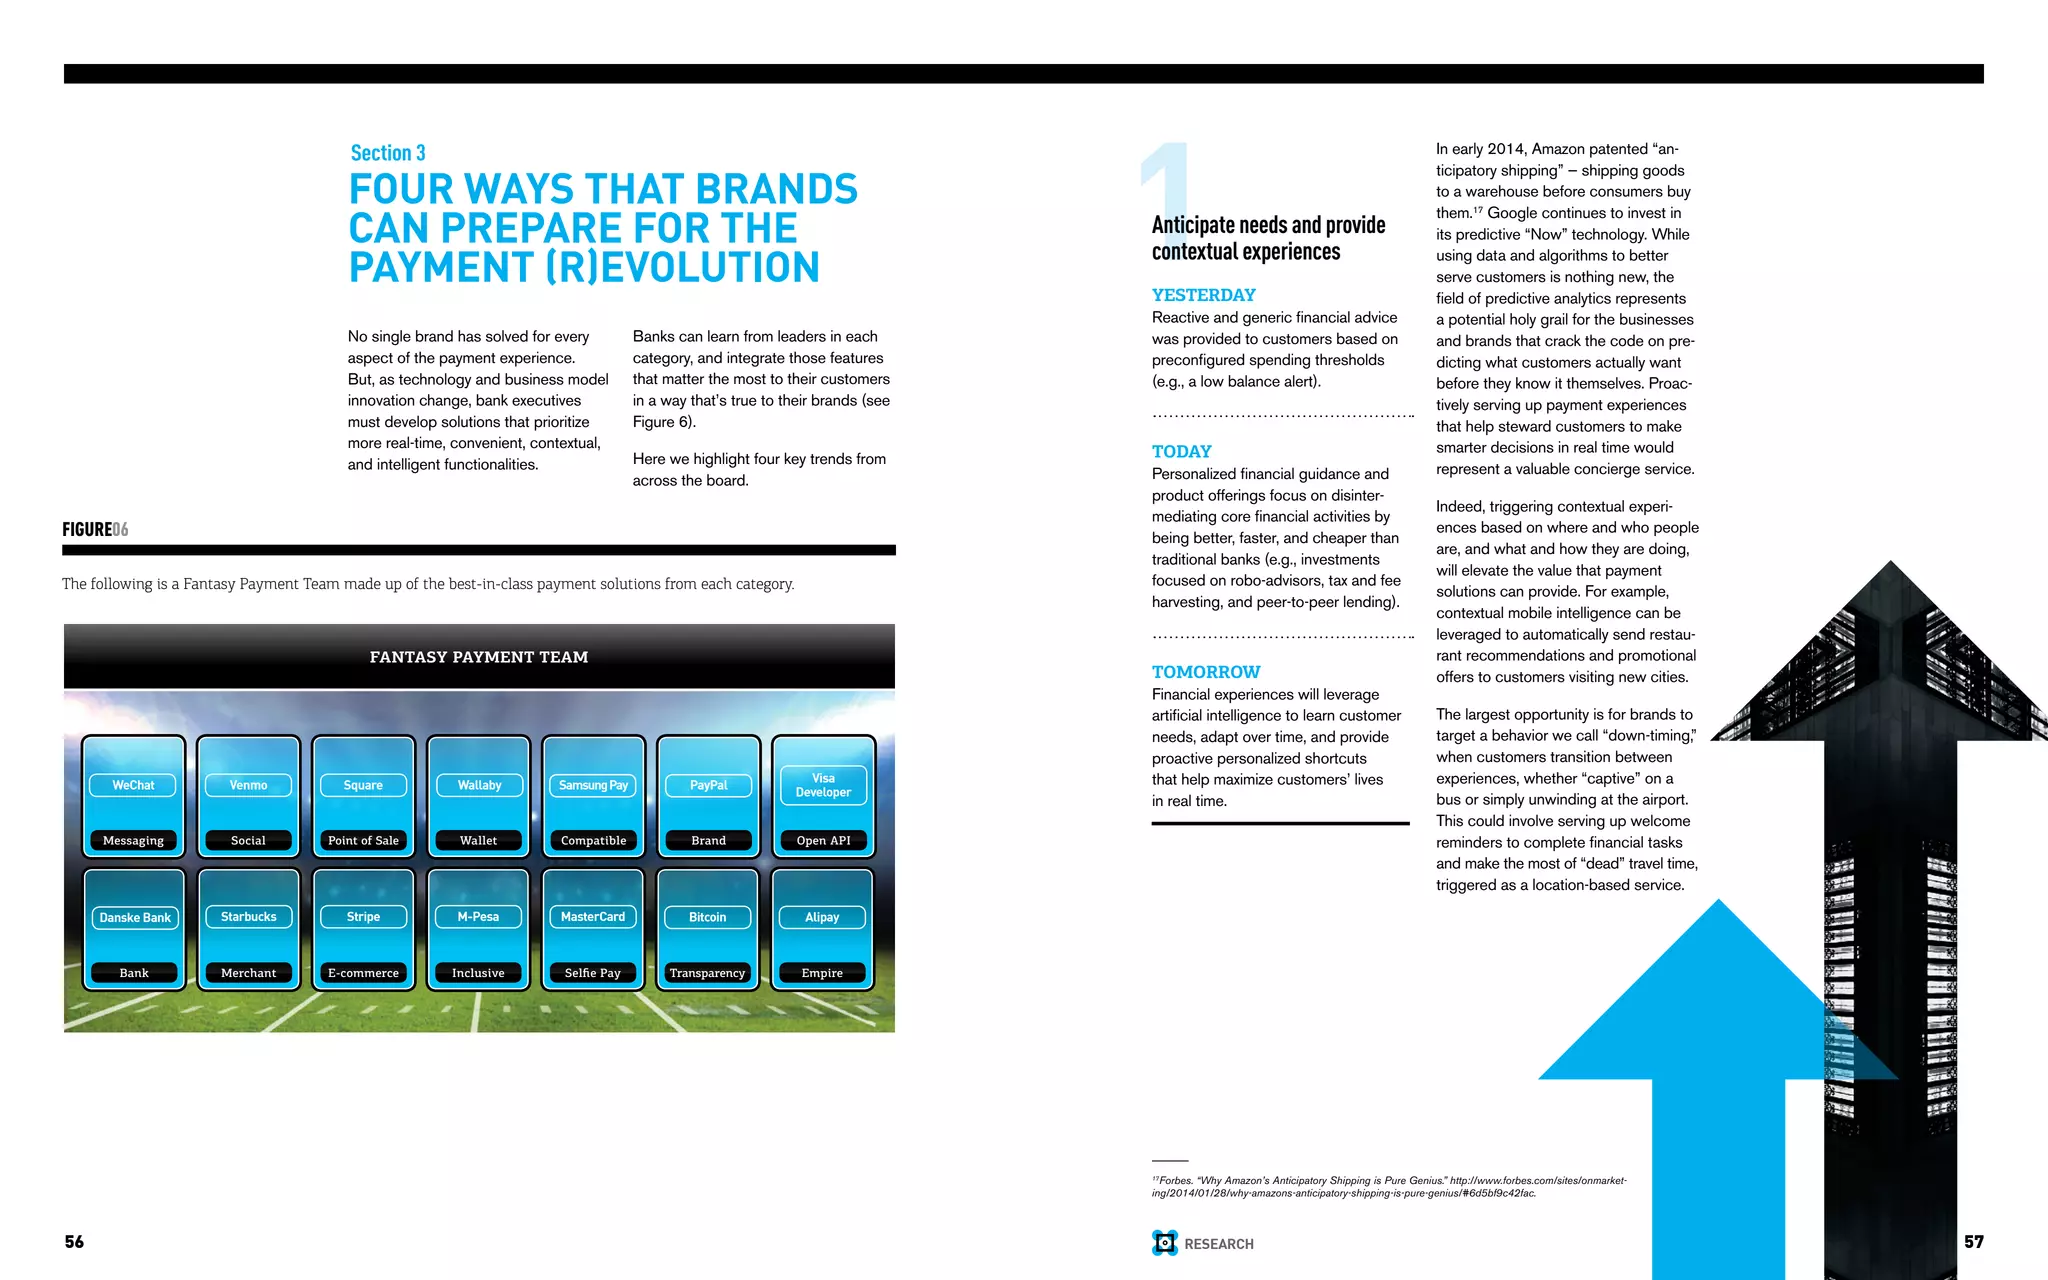
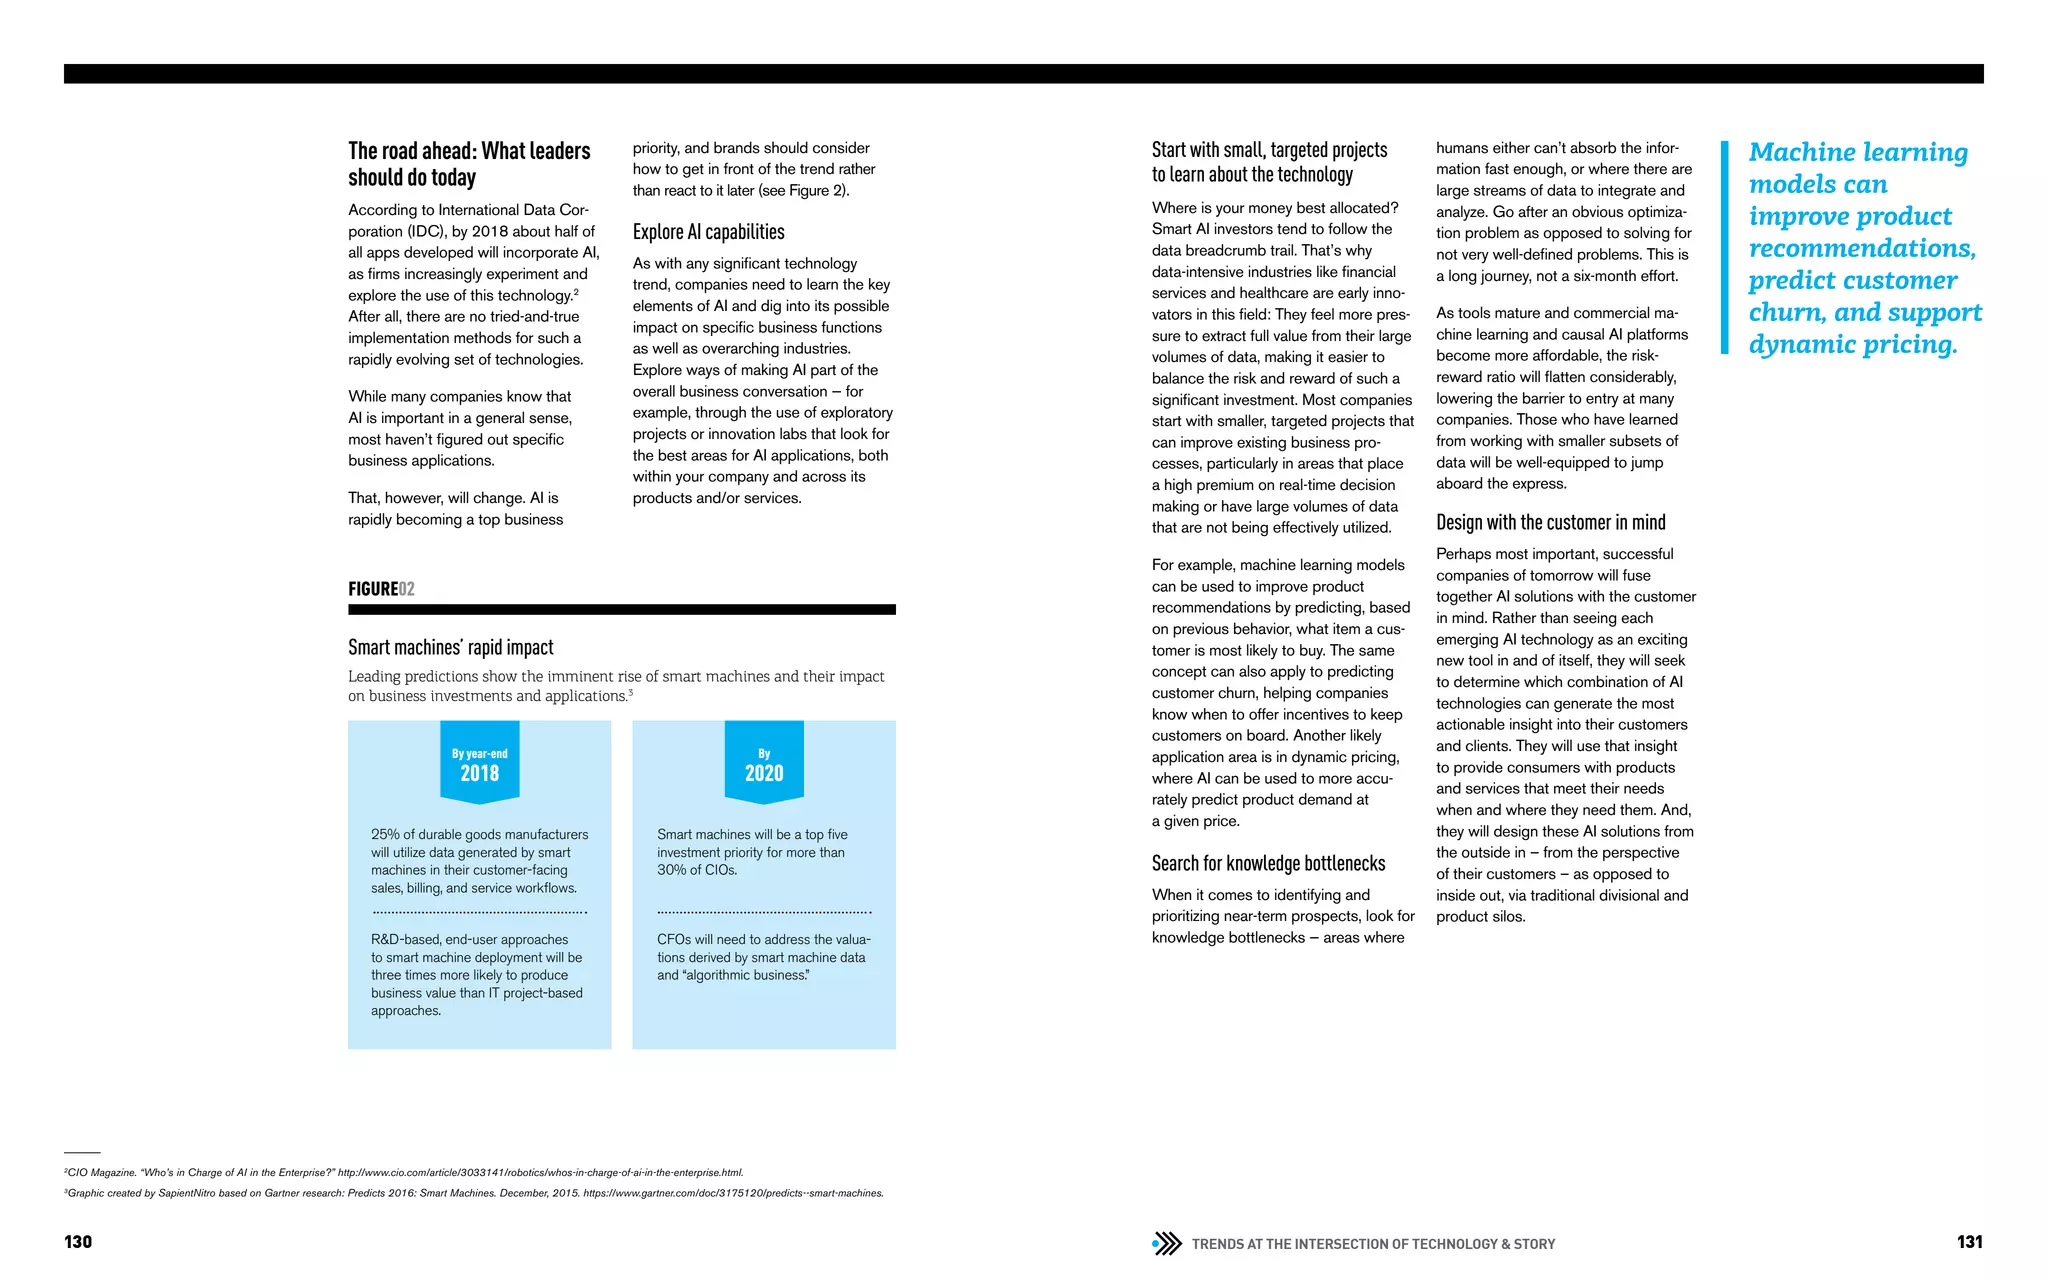
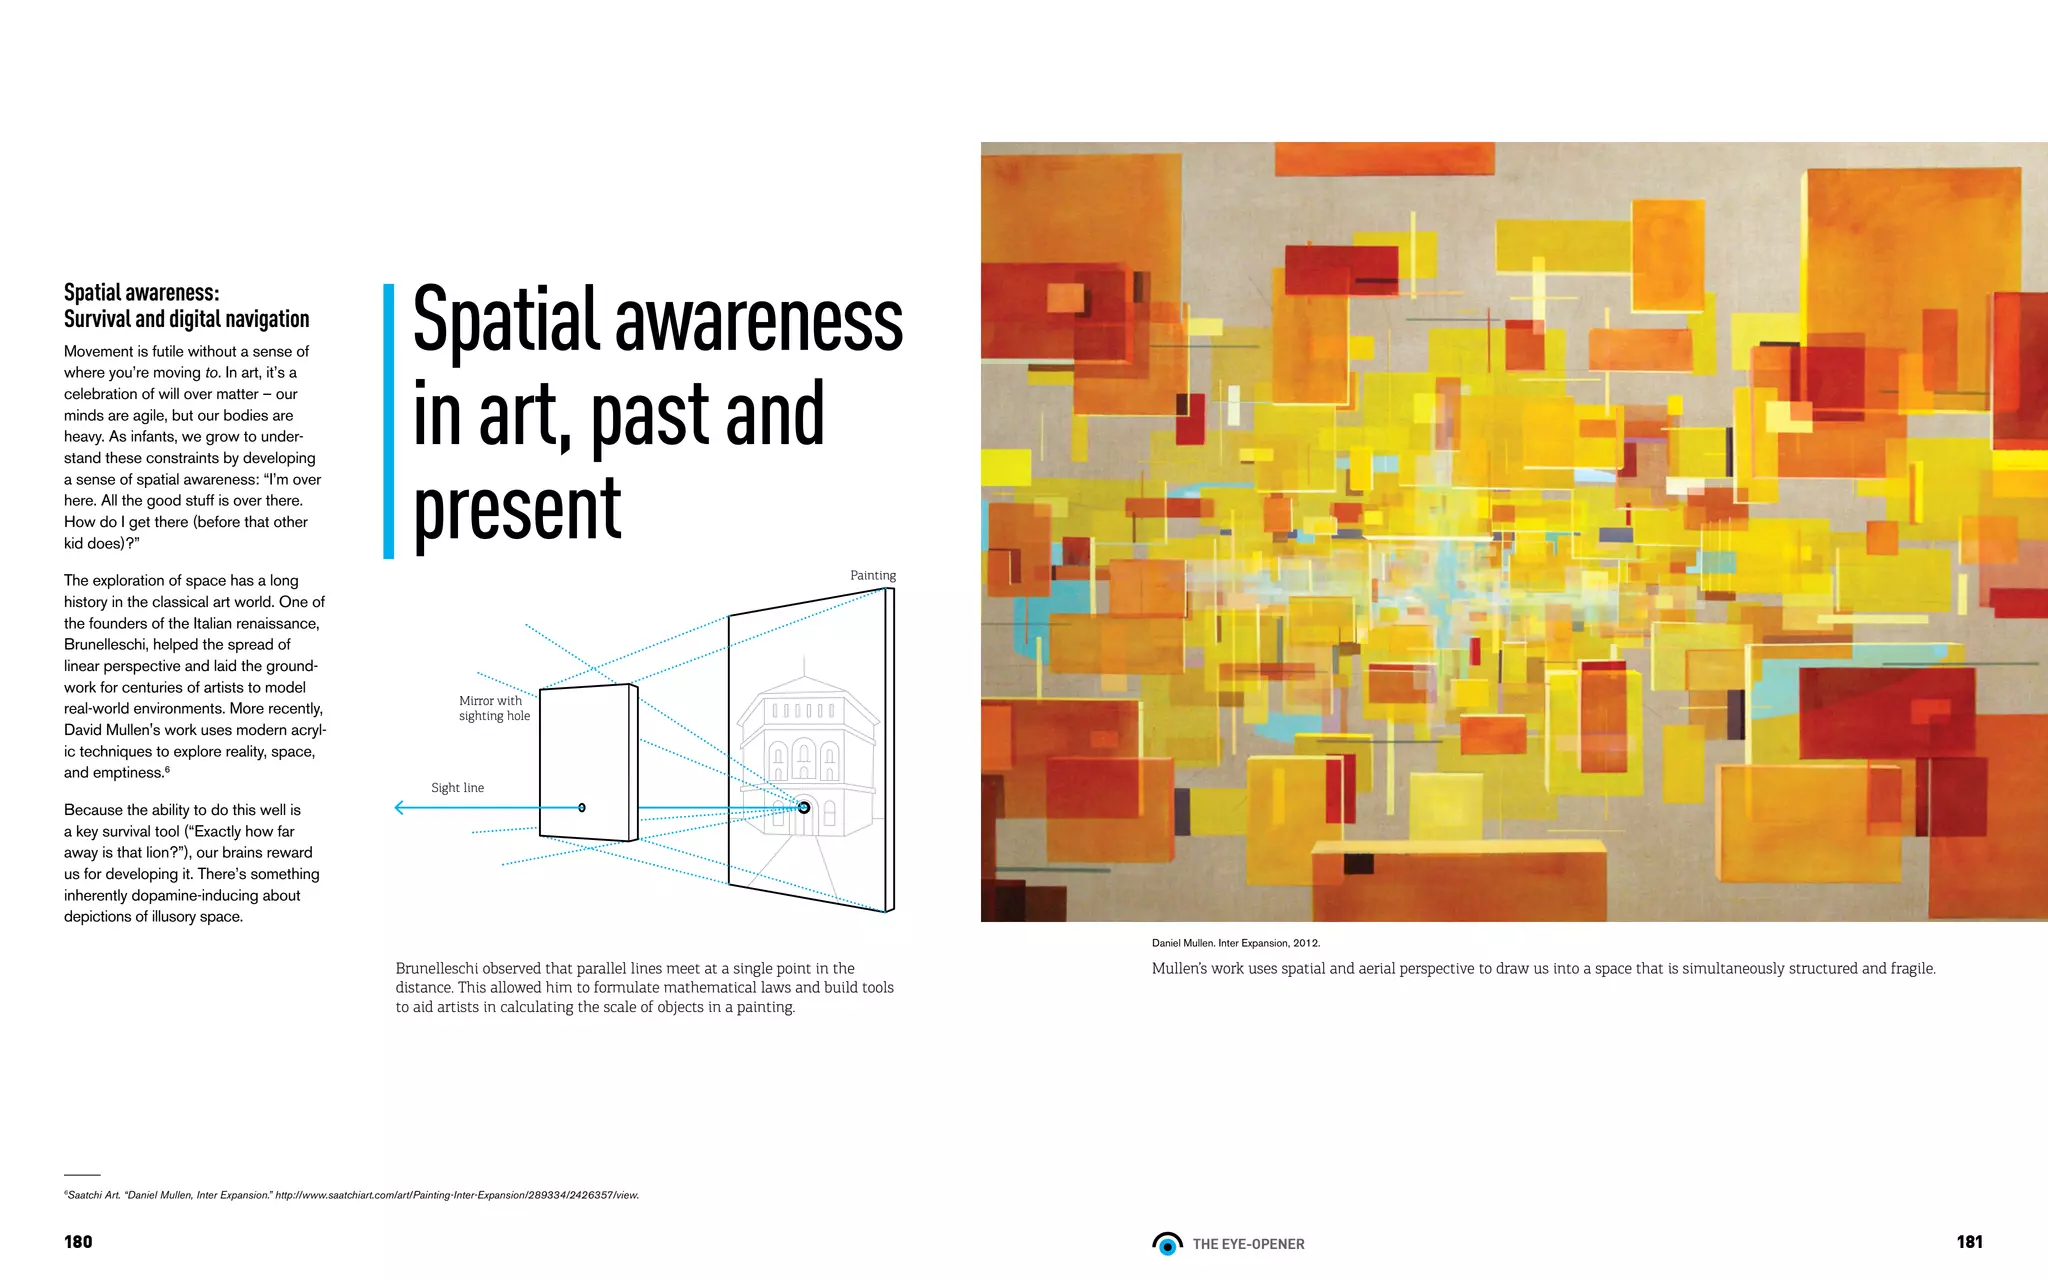
Yet our research shows that just 23
percent of companies support an
experimentation culture (see Figure 1).
Companies which adopt a culture of
experimentation emphasize test and
learn methods, rapid prototyping, and
immediate feedback from real cus-
tomers. The most important process
is sustaining a never-ending cycle of
measuring outcomes, changing quickly
based on feedback, and then putting
the next thing in front of your customers.
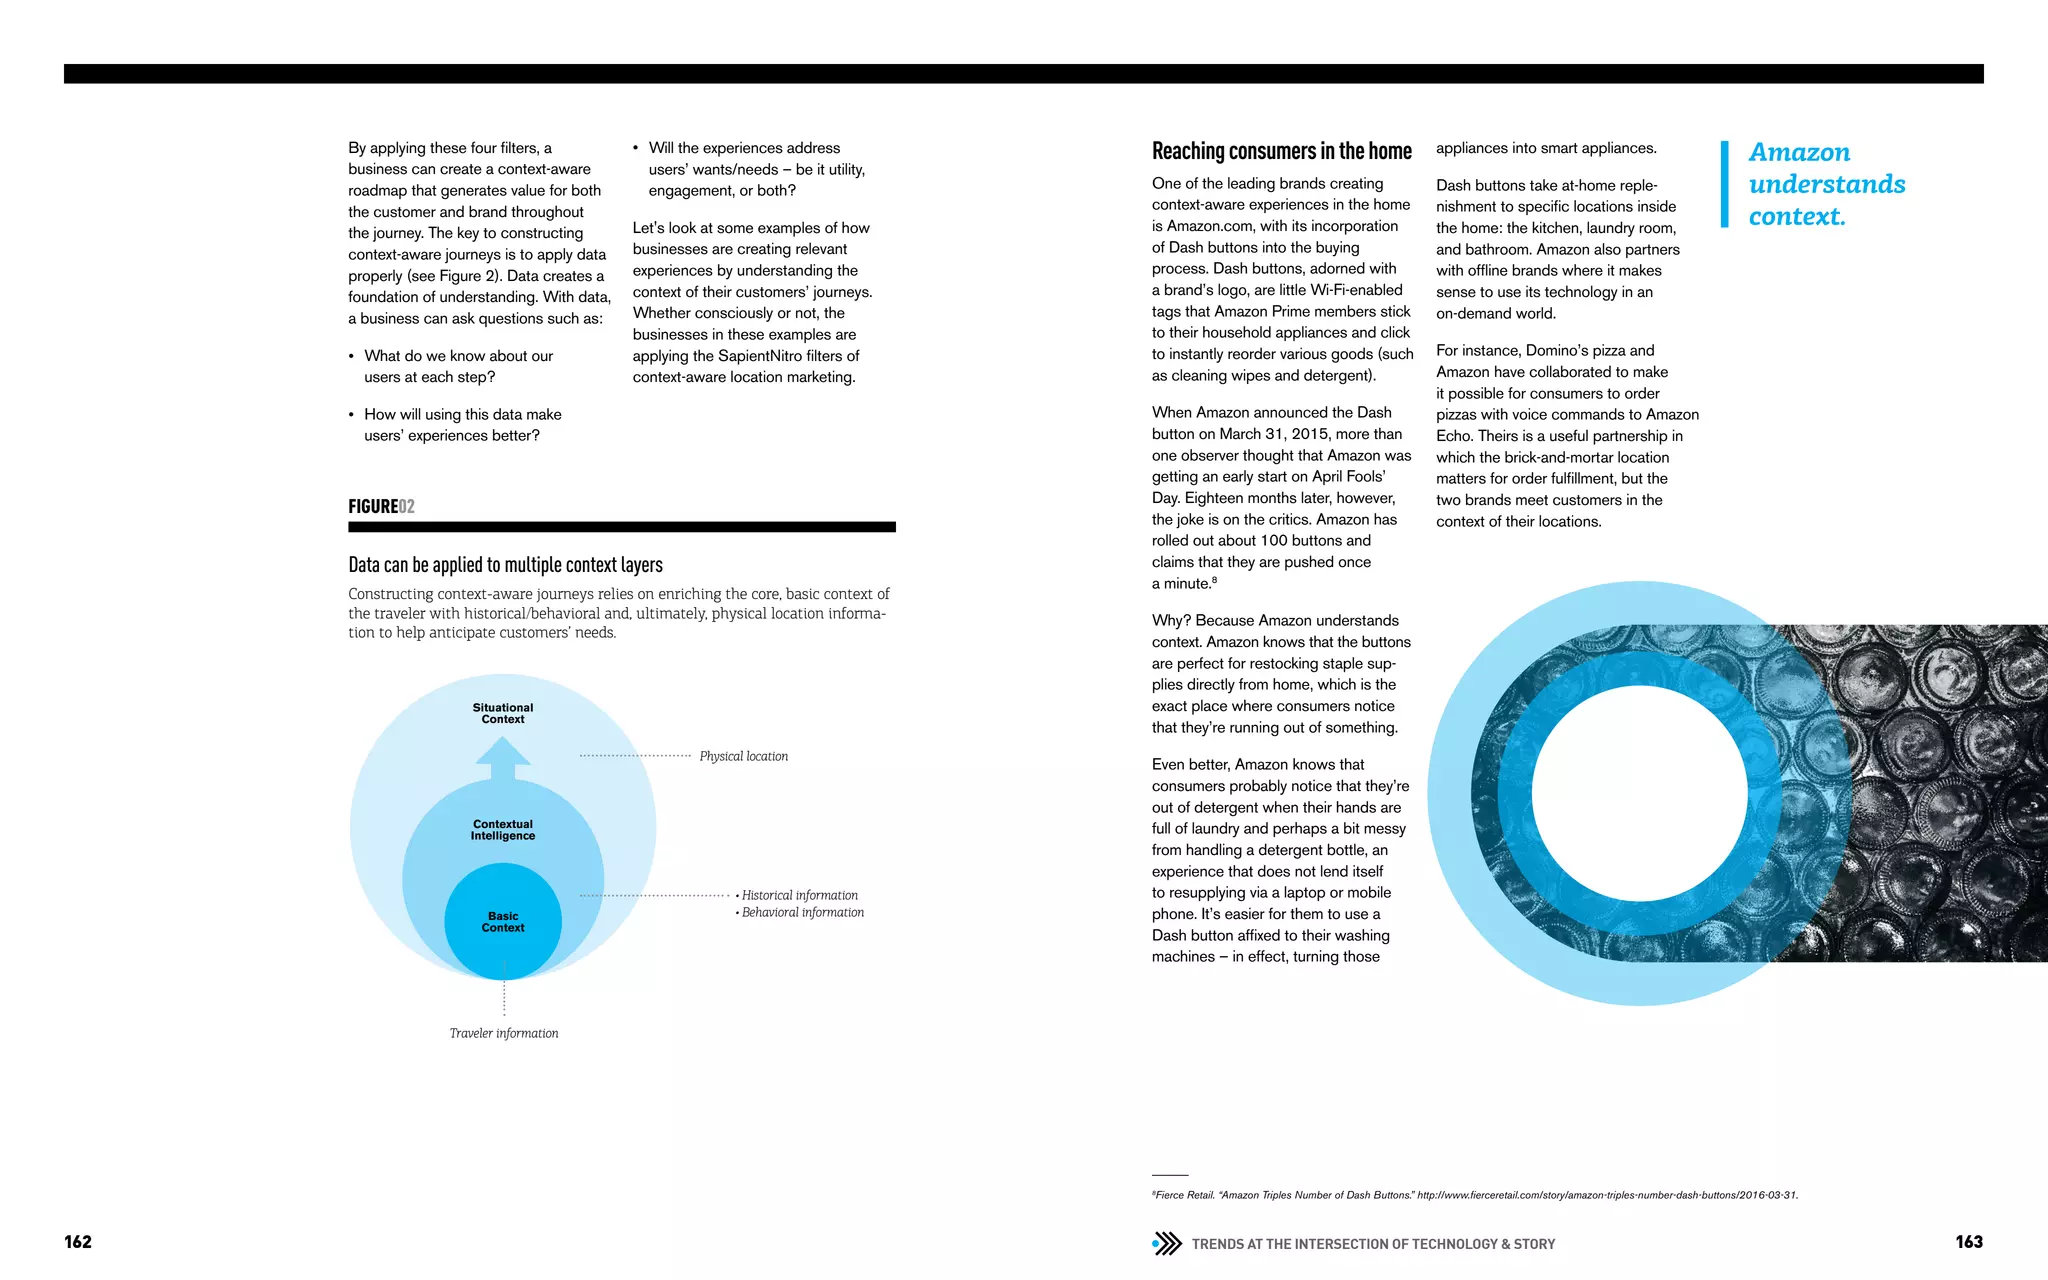
Just 23% of companies support an experimentation culture.
FIGURE01
Q: To what extent do you agree/disagree with the following statement: Most com-
panies support an “experimentation culture,” that is, one characterized by “test
and learn” and “small and frequent” methods.
Introducing a shift in mindset
Our approach to continuous delivery
is a bit like a long car trip. In the past,
we have always focused on reaching
the destination, on how to “go live” on
a specific date. It was not about how
the car was working, how bumpy the
ride was, or how we lost our direction
hundreds of times along the way; rather,
it was all about “have we reached
the destination?”
Our new mindset focuses on both the
car and the journey. By focusing on
the car, new traits become important:
the flexibility to adapt to changing
road conditions, the speed to quickly
achieve your goals, and the endurance
to reach the end destination.
Having a solid engineering methodo-
logy is like having a good car which
is maintained well with excellent road
conditions. It doesn’t guarantee that
you'll make it to your destination safely
and comfortably, but it makes the pros-
pect a lot more likely.
Autonomous product teams
To help large corporations embrace
an experimentation culture, we’ve
developed and refined an “Enterprise
Startup” approach. We start with an
autonomous product team that runs its
own profit and loss (P&L) and reports
to internal investors, even as it also
makes decisions on a daily basis.
The team tests and fails fast by deploy-
ing minimum viable products (MVPs)
and then iterating.
Organize around customer journeys
We organize product teams around
customer journeys, not around traditional
functional areas. For example, rather
than having a team focused on product
development, we focus it around the
customer need. Instead of mortgage
origination, we organize the team on
the “buying a home” customer journey.
Use best-in-class agile methods
We also use best-in-class agile me-
thods. This means shifting the IT
culture from long product development
cycles and extended quality assurance
(QA) periods to daily releases and
continuous QA.
For example, Marks and Spencer, like
most retailers, had traditionally done a
code freeze for several months during
the holidays. This year that changed:
They conducted nineteen code releases
during the peak holiday season. The
result was an improved product and
millions of new data points on customer
behaviors in the new experience.
40%
30%
20%
10%
0%
Strongly
disagree
Disagree Neither agree
nor disagree
Agree Strongly
agree
38%
33%
5%
23 percent of
companies support
experimentation
culture
13%
10%
90%
IDC prediction
of IT projects will be
rooted in the principles
of experimentation,
speed, and quality by
the end of 2018.4
23%
Just
of companies support an
“experimentation culture.”
Source: SapientNitro, 2016.
4
IDC. IDC FutureScape CIO Agenda Predication 5: Driving Experimentation, Speed, and Quality. http://www.idc.com/getdoc.jsp?containerId=US40548115.
5
Forbes. “Jeff Bezos Calls Amazon ‘Best Place in the World to Fail’ in Shareholder Letter.” http://www.forbes.com/sites/ryanmac/2016/04/05/jeff-bezos-calls-amazon-best-place-in-
the-world-to-fail-in-shareholder-letter/.
6
Wired. “Google is 2 Billion Lines of Code – And It’s All in One Place.” http://www.wired.com/2015/09/google-2-billion-lines-codeand-one-place/.
7
For more information, see “About the research” on page 106.
Source: SapientNitro, 2016.7](https://image.slidesharecdn.com/reimaginingbusinessintheagefinal-191209221024/75/Reimagining-Business-in-the-Age-of-the-Customer-50-2048.jpg)


![INDUSTRY VOICES & GAME CHANGERS112 113
Over the last six years, RBS has re-
leased a series of innovations and inter-
nal changes in order to adapt to a more
competitive marketplace. RBS has
transformed its organization to focus
on customer experience, building on
its history of deep product and channel
centricity. Guided by the promise of
“Helpful Banking,” the organization has
been building a digitally-led culture,
reimagining internal structures, and sub-
sequently bettering its customers’ lives.
Organizational change: Creating
journey managers
The reimagining of RBS’s digital busi-
ness started with its people – more
specifically, its product managers. Pre-
viously, product managers across RBS
worked in organizational silos, such as
checking accounts, savings accounts,
mortgages, etc. They rarely communi-
cated across the lines and customer
feedback suggested that customer
requests were, at times, getting lost in
the handoff between specialists. Fur-
thermore, customers reported that they
were not getting holistic “life advice.”
RBS reached the conclusion that an
entirely new role needed to be created
to drive business transformation and
improve the customer experience. This
role was needed in order to disrupt
traditional mindsets, look across pro-
ducts and services, and collaborate
with those who would continue to ma-
nage and own existing products.
To serve this purpose, RBS created the
position of “journey manager.” Journey
managers are individuals who are con-
cerned with customers’ aspirations and
goals. They are oriented not around
products, but rather around customers
and their major financial moments –
including opening their first accounts,
saving money for university, and buying
a home.
In 2012, RBS had five journey managers.
Three years later, there were sixty.
A digitally-led culture and
simplified user experience
Over the years, RBS – like many banks
– has developed multiple website and
web platforms to support its business
needs at specific moments in time.
Often, these proprietary platforms lived
on at a growing cost both financially
and in terms of maintaining a distinct
user experience.
When reimagining its business, however,
RBS saw an opportunity to focus on
the simplification of its digital estates.
Over the last 18 months, RBS has
been on a journey to consolidate over
200 distinct web platforms into a single
one, thereby increasing collaboration
among business teams and simplifying
the user experience.
In addition, RBS introduced an initiative
aimed at increasing the overall digital
IQ of the organization and helping it
transform into a digitally-led company. To
achieve this, two major steps were taken.
The first saw RBS develop agency-like
digital studios in both London and
Edinburgh. These studios began trans-
forming the organization's culture and
technology systems from the inside out
Our busiest
branch...is the
7:01 [train]
from Reading
to Paddington –
over 167,000
of our customers
use our Mobile
Banking app
between 7am
and 8am...
every day.
– Ross McEwan,
CEO of RBS3
via Scrum collaborative development
areas, cross-functional teams, and the
mindset of a more nimble enterprise
startup.
The second step was “Bank of APIs,”
a series of hackathons run by RBS and
open to both staff and external par-
ticipants. Spanning the brand’s three
major geographies (London, Edinburgh,
and India), this initiative further commu-
nicates RBS’s new way of working and
dedication to innovation.
And that was just the start.
The innovation imperative
With the new journey managers and
refined product mix, RBS was working
hard to address consumers’ core
needs. However, to effectively reima-
gine their business, RBS’s leaders
needed to reinvent the customer
journey across all channels and truly
put customers in the center.
But how was the organization going to
address the customer experience holisti-
cally? RBS realized that game-changing
innovation requires an end-to-end view
of the customer experience. RBS was
able to introduce a series of innovative
services to the market over twenty-four
months by combining customer insights
from the journey managers, a team
making rapid prototypes, and a nascent
crowdsourcing/co-creation platform.
The following pages highlight the
innovations made in three major areas:
optimizing existing web properties,
building new tools based on customer
needs, and aggressively embracing the
latest mobile technology.
112
3
BBC. “RBS: Ross McEwan Speech in Full.” http://www.bbc.co.uk/news/business-your-money-26365616.](https://image.slidesharecdn.com/reimaginingbusinessintheagefinal-191209221024/75/Reimagining-Business-in-the-Age-of-the-Customer-58-2048.jpg)


![190
Conclusion
Throughout this piece, we’ve used the
word art to loosely reference what
Daniel Kahneman calls “System 1
thinking” which is “fast…intuitive,
associative, metaphorical, automatic,
impressionistic…[and the] secret
author of many of the choices and judg-
ments [that we] make.”12
Art depicts
and provokes instinctual reactions that
are the sum of 40,000 years of human
life, observation, and learning – allowing
it to uncover valuable wisdom.
By contrast, digital technology has
grown out of Kahneman’s “System 2
thinking”: slow, deliberate, and conside-
red. But “digital” in the broader sense
is young. It’s a teenager full of energy,
with an appetite for the new, but a very
short attention span.
So what can the digital world learn
from art practice?
We’ve touched on four main themes:
existential evidence, kinesis and move-
ment, spatial awareness, and open vs.
closed forms.
In each, classical and modern art
has much to offer. Early French cave
paintings show self-awareness and
evidence of being. Boccioni’s flowing
bronze “Unique Forms of Continuity
in Space” highlights movement and
energy. Mullen’s “Inter Expansion” uses
acrylic paint and shape to suggest
depth and spatial awareness. And
closed and open forms are highlighted
in Parker’s “Hanging Fire” and Géri-
cault’s “The Raft of the Medusa.”
These core themes resonate in today’s
world with just as much urgency and
life. Touch ID and the role of persona-
lization emphasize the importance of
identity. The rise of video and use of
motion and animation reinforce the
import of kinesis. The desktop meta-
phor in most operating systems and
evolution of VR depict how spatial
awareness has continued relevance.
And the debate at the heart of the
nature of the Internet – around its open
or closed system, and the architecture
of its websites – reinforces that key
point as well.
We believe that the notion of tension
is what ties art to digital technology.
Artists love tension because it excites:
complementary colors sizzle and con-
flicts drive drama. It’s an appetite for
“the opposite” by which you recognize
a truly creative thinker – one with the
ability to take seemingly unrelated, even
opposing, things and make them into
something new.
To grow well, digital will need to ma-
ture, deepen, and acquire art’s wisdom
of human experience. Therefore, a
union of technology and emotion is
needed: a mutually beneficial symbiosis
to give art relevance and digital a soul.
Matthew Maxwell
Associate Creative Director,
SapientNitro London
mmaxwell@sapient.com
12
Daniel Kahneman. Thinking, Fast and Slow. Penguin Books. 2010.](https://image.slidesharecdn.com/reimaginingbusinessintheagefinal-191209221024/75/Reimagining-Business-in-the-Age-of-the-Customer-97-2048.jpg)


The document discusses the need for businesses to undergo transformative changes in response to evolving customer expectations and technological advancements. It emphasizes that leaders must not only improve efficiency but also focus on the right strategic changes necessary for long-term relevance. The insights gathered highlight that many organizations understand the importance of digital business transformation but struggle to prioritize and implement it effectively.


