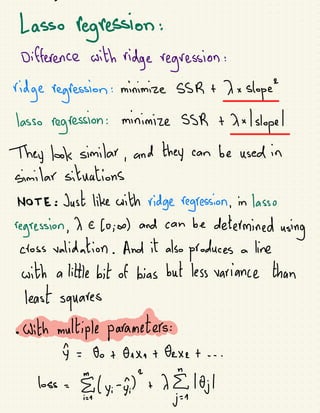
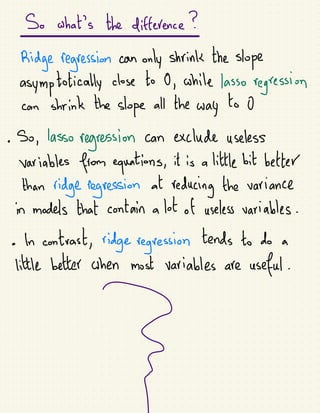
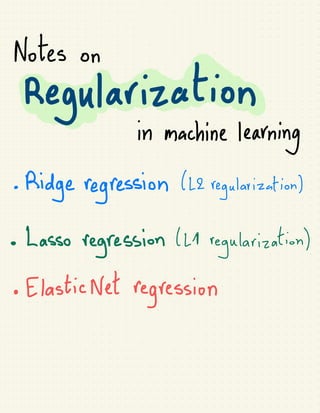
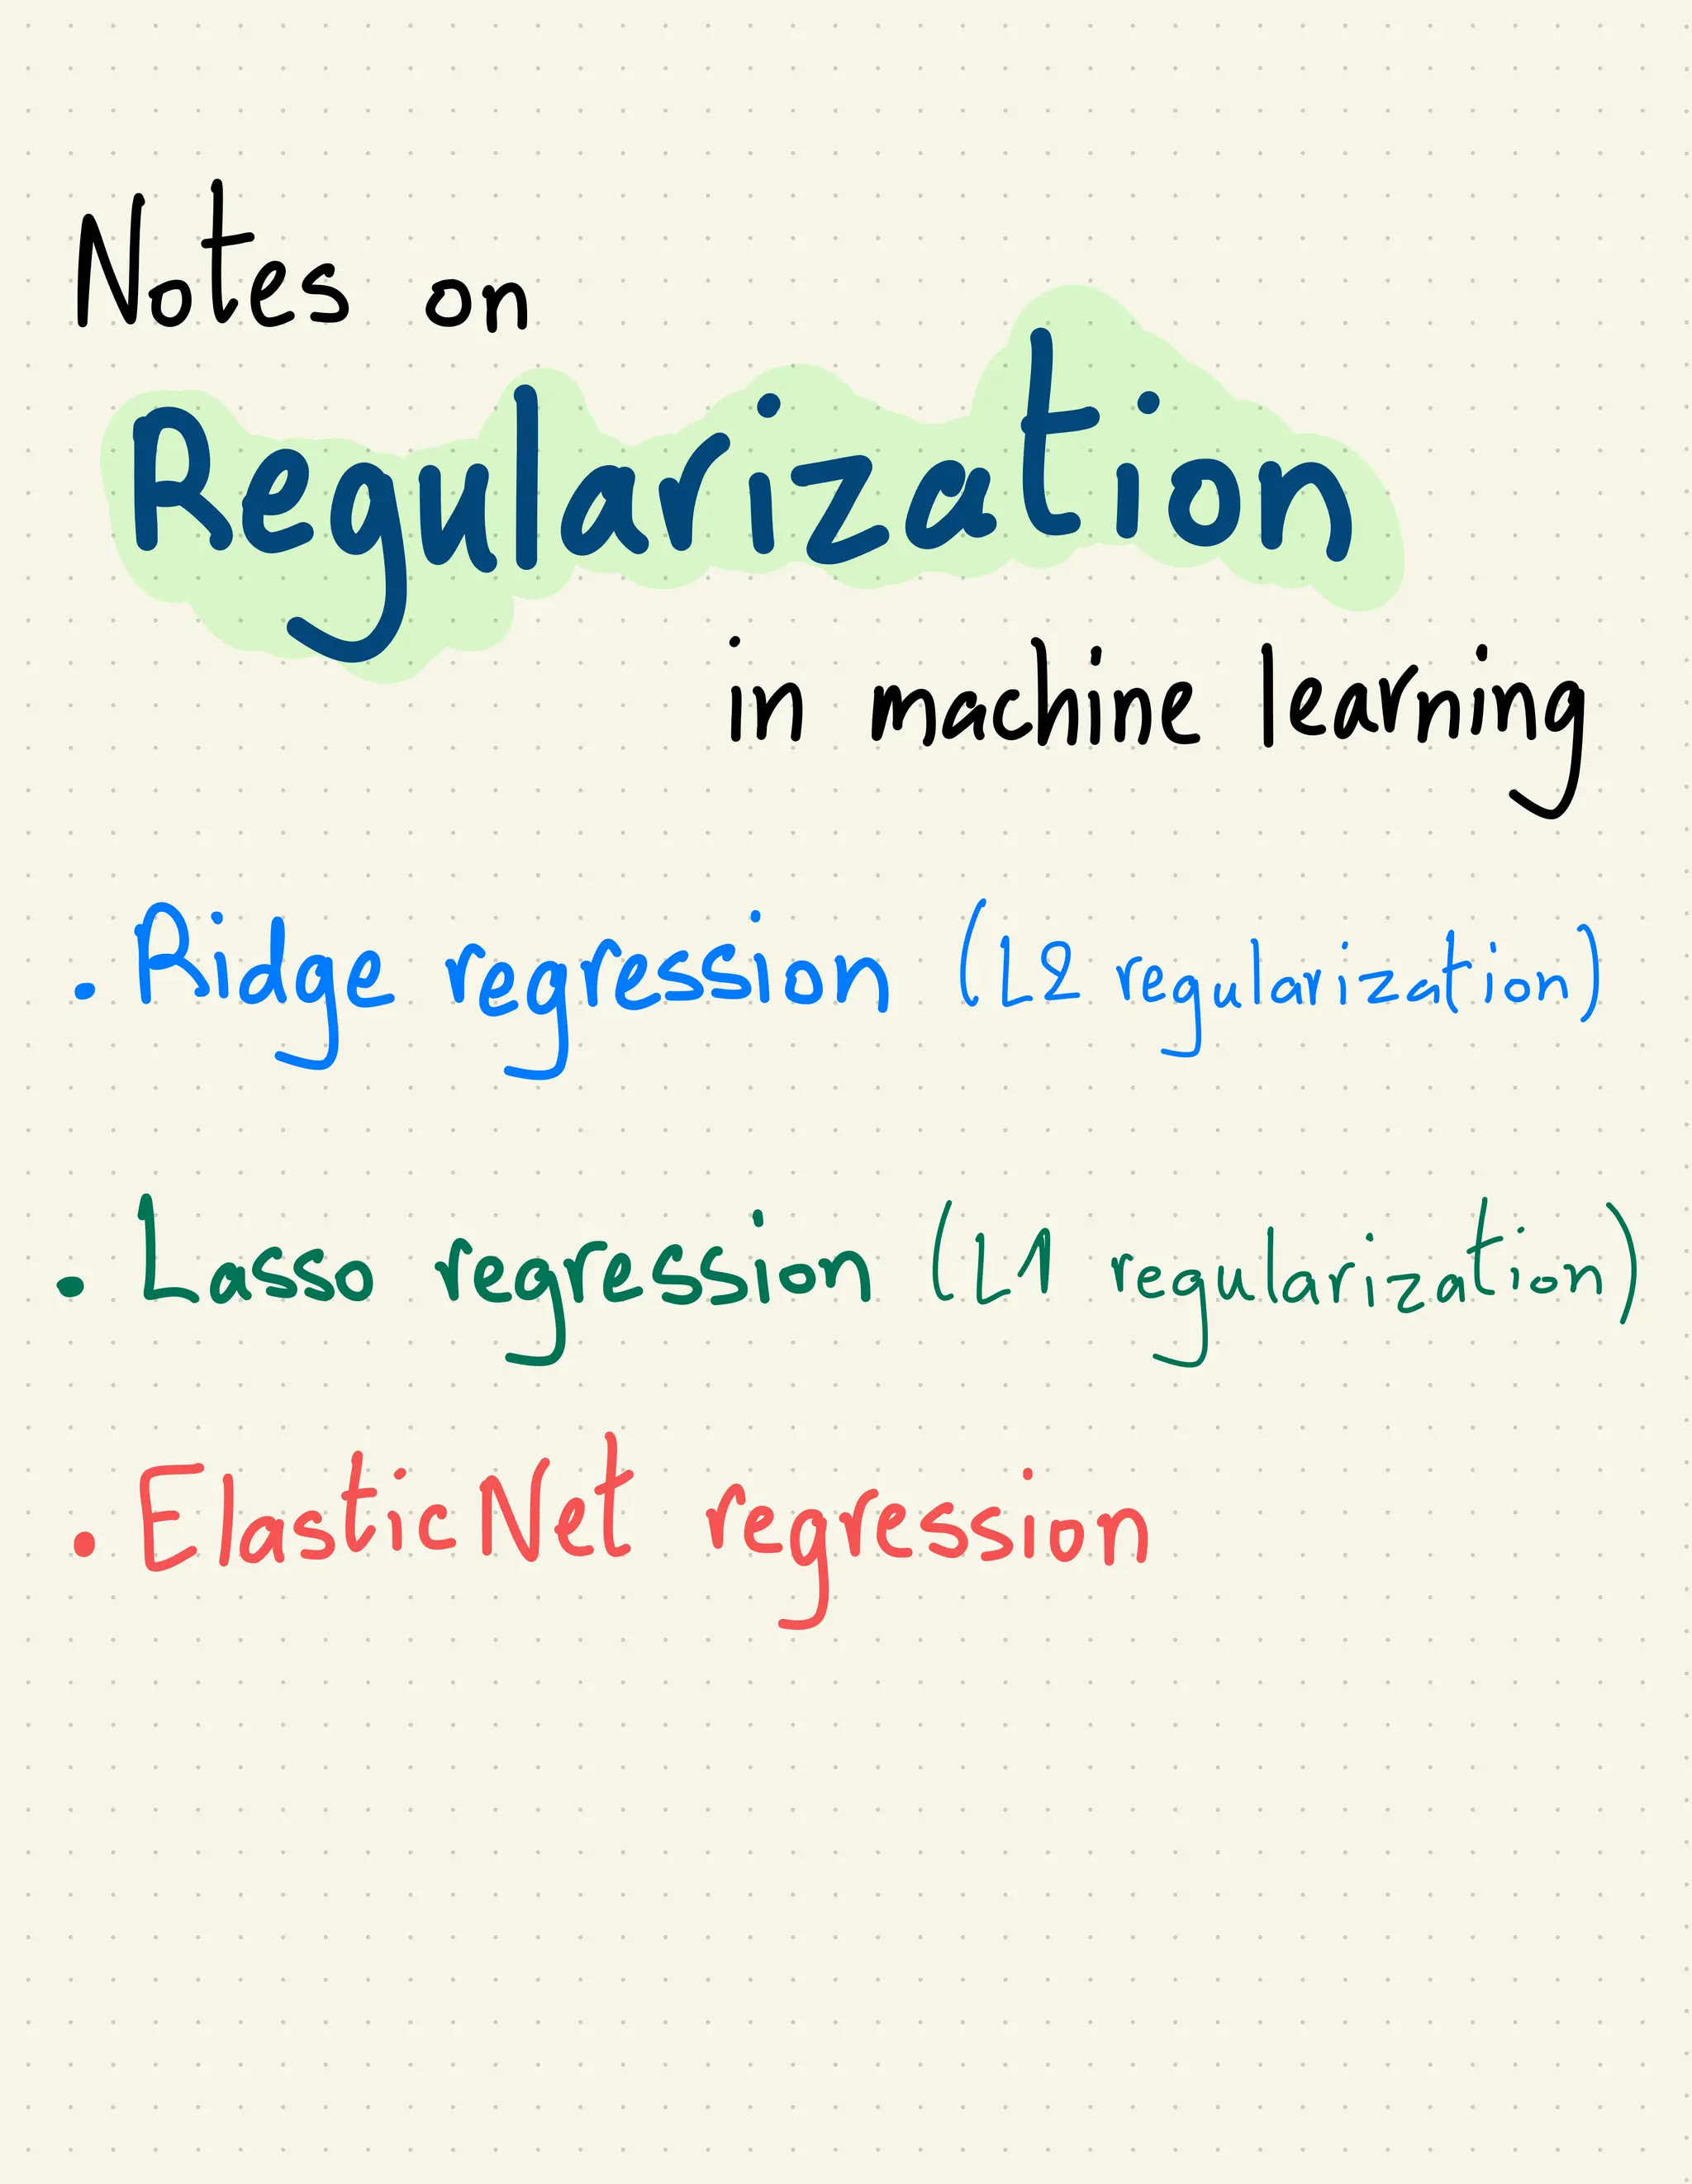
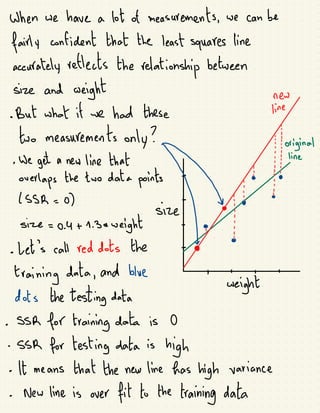
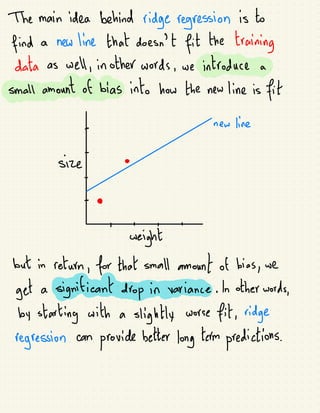
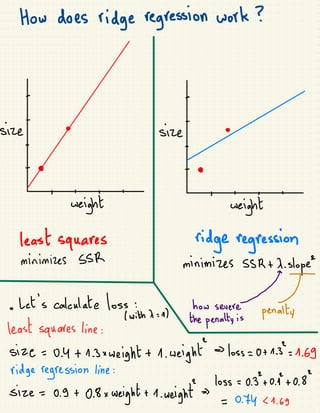
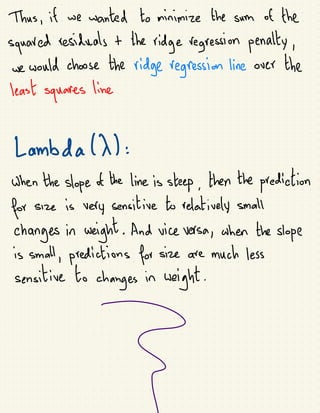
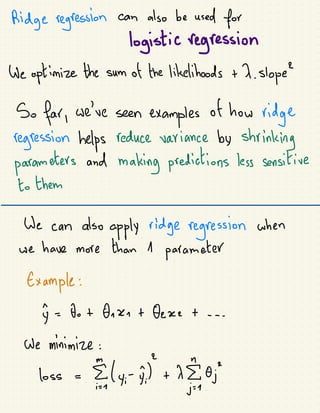
Notes on
Regularization
in machine
learning
·
Ridge regression (Le
regularization)
·
Lasso
regression (LI
regularization)
· Elastic Net
regression
·
Let's start
with data thatrepresents seights
and
sizes of
mice
predicted-
·
size
size ·
⑧
-
·
-
seight
of mouse shom
se sant
to predict
size
-
eight
Since these data look relatively linear,so
sill
use Linear Regression, ARA
least squares, to
model the
relationship between seight and size.
·
Ultimately, we end up
with this equation for the line:
size = 0.9 +
0.75*
seight
intercept slope
When we have a lot of measurements, we can be
fairly confident
that
the least squares line
accurately reflects the
relationship between
size and weight net
·
But
what
it se had these line
too measurements only?
!
·in
original
·
We get a new line that line
(SSR =
0)
·?.
.
craps are so date
positions.
size =
0.4 +
1.34 seight ⑤8.
·
Let's call red dots the -
⑨
training data, and blue
dots the testing data
.
SSR for training data is s
·
SSR for testing data is
high
· It means that
the new line has high saviance
·
Newline is over fitto the
training data
The main idea behind ridge regression is to
find a new line that
doesn't fit the training
data as sell, in other words, we introduce a
small amount
ofbias into how the new line is fit
nes line
-
size ⑧
-
-
-
eight
but in return, for thatsmall amountofbias, se
get a significantdrop in variance. In other words,
by starting with a
slightly sorse fit, ridge
regression can
provide better long term
predictions.
How does ridge regression sork?
-
-
size ⑧
size ⑧
-
-
- -
-
eight
-
eight
least
squares ridge regression
minimizes SSR minimizes
SSR+X.e
~
·
Let's calculate loss:
least
squares line:
litnx: epennes penalty
size =
0.4 +1.3x eight + 1. seight loss =
0 +
1.3°=
1.69
ridge regression line:
size =
0.9 +
8.8x seight +
1.seight loss
=
0.3 0.1+ 0.8°
= 0.74 <1.69
Thus, if we wanted to minimize the sum of the
squared residuals +
the
ridge regression penally,
we would choose the ridge regression line over the
least
squares line
Lambda(X):
Shen the slope of
the line is steep, then the prediction
for size is very sensitive to relatively small
changes in seight. And size versa, when the slope
is small, predictions for size are much less
sensitive to
ages
in
weight
-
-
size ⑧
size ⑧
-
-
- -
-
weight
-
eight
x =
8 x =
1
lequivalentto least
squares)
-
-
-
size ⑧
size ⑧
-
-
- -
-
eight
-
eight
X =
3 X =
1000
So the
larger x
gets, our predictions for size
become less and less sensitive to seight.
and the larger we make X, the slope gets
asymptotically close to 8
How do we decide the value of
X?
be
just
try a bunch of
values
for X
and use
cross validation, typically 10-fold C.J.,
to determine which one results in the losest
saviance.
Xc(0; +
0)
n the presious example, we're seen has
ridge
regression would work when predicting a
continuous
saviable, using a continuous variable. But
it
also works when using a discrete variable
Ridge regression can also be used for
logistic regression
doptimize the sum of
the likelihoods + X. Slope
So far, we're seen
examples
of
how
ridge
regression helps reduce saviance by
shrinking
parameters and
making predictions less sensitive
to them
We can also
apply ridge regression shen
we have more than 1
parameter
Example:
y =
be+
foxo+
feret---
be minimize:
loss -
Ely,ii) +
1
0;
Minimizing RSS +
18
8
(y -
x0)"(y -
x8) +
x0
y*y -
28xy +
8xx6 +
x8 8
because (X8)"= 8x*
&y-28x4 +
0x6 +
x0%
=
-
2X*y +
2xx8 +
8x8
68
set it
equal to 0, solve for 8
0 =
- 2xxy +
exx8 +
ex8
0 =
- x*y +
xx +
x8
x*y =
x
+
x6 +
x8
x*y =
(xx +
xI)8
(xx +
x])x*y =
0
Lass' regression:
Difference with ridge regression:
ridge regression:minimize SSR+Xx slope
lasso regression:minimize SSR
+Xx/slopel
They look similar, and they can be used in
similar situations
ND: Just
like with ridge regression, in lasso
regression, Xc(0,) and can be determined
using
cross solidation. And it
also
produces a line
with a littlebitof
bias but less saviance than
least squares
· With multiple parameters:
4 =
to +
0xxo+
fexet...
loss-
ly:-y,) +
18;1
j
=
x
So what's the difference?
Ridge regression can only shrink the slope
asymptotically close to 0, while lasso regression
can shrink the slope all the
way
to
8
· So, lasse
regression can exclude useless
saviables from equations, it is a little bit
better
than ridge regression
at
reducing the saviance
in models that
contain a
lot
of
useless variables.
in
retire
raniresen
Explanation with a contour plot:
withoutregularization, the goal is to minimize
lyi-yil only, the minima will be inside
the circles
⑧
*
minag.
But with ridge regression, there will be another
term, that
will "attract"parameters (here to, be)
to zero. So here our
algorithm will try to
minimize the sum of
too terms:
E(yi-xi), which attracts our rector to the center
of
purple circles, and x
E,8; shich attracts
our sector to 8:
So our minima will be somewhere in-between
⑦&
I ⑧ a
minima
-
Ex
And the higher X is, the more
"poserful"the
second term will be, our rector getcloser to 0.
Same
logic with lasso
regression, the second
term,
yl0j1,
will attractour sector to
↳
mina
=
Elastic Net
regression:
·
We said that lasso
regression works best when
your model contains a lotof useless variables
·
We also said thatridge regression works best
when most of
the variables are useful
·
Soil
we know a lot
about
all of the parameters
in our model, it's easy to choose
But what if we don't?
de use Elastic Net
regression
It combines both lasso
regression and
ridge regression, and takes advantage
of
both oftheir benefits
With Elastic Net
regression, we wantto
minimize:
(4i-yi) +
X, 18;1 +
xe,8;
j=
1
Note that
do and to don't
have to be
equal,
and their values can be foundwith cross
validation
⑦&
Visualization
with contour plot:
I · X
minima
⑧
-
Ex

Regularisation in Machine Learning notebook

  • 1.
    Notes on Regularization in machine learning · Ridgeregression (Le regularization) · Lasso regression (LI regularization) · Elastic Net regression
  • 2.
    · Let's start with datathatrepresents seights and sizes of mice predicted- · size size · ⑧ - · - seight of mouse shom se sant to predict size - eight Since these data look relatively linear,so sill use Linear Regression, ARA least squares, to model the relationship between seight and size. · Ultimately, we end up with this equation for the line: size = 0.9 + 0.75* seight intercept slope
  • 3.
    When we havea lot of measurements, we can be fairly confident that the least squares line accurately reflects the relationship between size and weight net · But what it se had these line too measurements only? ! ·in original · We get a new line that line (SSR = 0) ·?. . craps are so date positions. size = 0.4 + 1.34 seight ⑤8. · Let's call red dots the - ⑨ training data, and blue dots the testing data . SSR for training data is s · SSR for testing data is high · It means that the new line has high saviance · Newline is over fitto the training data
  • 4.
    The main ideabehind ridge regression is to find a new line that doesn't fit the training data as sell, in other words, we introduce a small amount ofbias into how the new line is fit nes line - size ⑧ - - - eight but in return, for thatsmall amountofbias, se get a significantdrop in variance. In other words, by starting with a slightly sorse fit, ridge regression can provide better long term predictions.
  • 5.
    How does ridgeregression sork? - - size ⑧ size ⑧ - - - - - eight - eight least squares ridge regression minimizes SSR minimizes SSR+X.e ~ · Let's calculate loss: least squares line: litnx: epennes penalty size = 0.4 +1.3x eight + 1. seight loss = 0 + 1.3°= 1.69 ridge regression line: size = 0.9 + 8.8x seight + 1.seight loss = 0.3 0.1+ 0.8° = 0.74 <1.69
  • 6.
    Thus, if wewanted to minimize the sum of the squared residuals + the ridge regression penally, we would choose the ridge regression line over the least squares line Lambda(X): Shen the slope of the line is steep, then the prediction for size is very sensitive to relatively small changes in seight. And size versa, when the slope is small, predictions for size are much less sensitive to ages in weight
  • 7.
    - - size ⑧ size ⑧ - - -- - weight - eight x = 8 x = 1 lequivalentto least squares) - - - size ⑧ size ⑧ - - - - - eight - eight X = 3 X = 1000
  • 8.
    So the larger x gets,our predictions for size become less and less sensitive to seight. and the larger we make X, the slope gets asymptotically close to 8 How do we decide the value of X? be just try a bunch of values for X and use cross validation, typically 10-fold C.J., to determine which one results in the losest saviance. Xc(0; + 0) n the presious example, we're seen has ridge regression would work when predicting a continuous saviable, using a continuous variable. But it also works when using a discrete variable
  • 9.
    Ridge regression canalso be used for logistic regression doptimize the sum of the likelihoods + X. Slope So far, we're seen examples of how ridge regression helps reduce saviance by shrinking parameters and making predictions less sensitive to them We can also apply ridge regression shen we have more than 1 parameter Example: y = be+ foxo+ feret--- be minimize: loss - Ely,ii) + 1 0;
  • 10.
    Minimizing RSS + 18 8 (y- x0)"(y - x8) + x0 y*y - 28xy + 8xx6 + x8 8 because (X8)"= 8x* &y-28x4 + 0x6 + x0% = - 2X*y + 2xx8 + 8x8 68 set it equal to 0, solve for 8 0 = - 2xxy + exx8 + ex8 0 = - x*y + xx + x8 x*y = x + x6 + x8 x*y = (xx + xI)8 (xx + x])x*y = 0
  • 11.
    Lass' regression: Difference withridge regression: ridge regression:minimize SSR+Xx slope lasso regression:minimize SSR +Xx/slopel They look similar, and they can be used in similar situations ND: Just like with ridge regression, in lasso regression, Xc(0,) and can be determined using cross solidation. And it also produces a line with a littlebitof bias but less saviance than least squares · With multiple parameters: 4 = to + 0xxo+ fexet... loss- ly:-y,) + 18;1 j = x
  • 12.
    So what's thedifference? Ridge regression can only shrink the slope asymptotically close to 0, while lasso regression can shrink the slope all the way to 8 · So, lasse regression can exclude useless saviables from equations, it is a little bit better than ridge regression at reducing the saviance in models that contain a lot of useless variables. in retire raniresen
  • 13.
    Explanation with acontour plot: withoutregularization, the goal is to minimize lyi-yil only, the minima will be inside the circles ⑧ * minag.
  • 14.
    But with ridgeregression, there will be another term, that will "attract"parameters (here to, be) to zero. So here our algorithm will try to minimize the sum of too terms: E(yi-xi), which attracts our rector to the center of purple circles, and x E,8; shich attracts our sector to 8: So our minima will be somewhere in-between ⑦& I ⑧ a minima - Ex
  • 15.
    And the higherX is, the more "poserful"the second term will be, our rector getcloser to 0. Same logic with lasso regression, the second term, yl0j1, will attractour sector to ↳ mina =
  • 16.
    Elastic Net regression: · We saidthat lasso regression works best when your model contains a lotof useless variables · We also said thatridge regression works best when most of the variables are useful · Soil we know a lot about all of the parameters in our model, it's easy to choose But what if we don't? de use Elastic Net regression It combines both lasso regression and ridge regression, and takes advantage of both oftheir benefits
  • 17.
    With Elastic Net regression,we wantto minimize: (4i-yi) + X, 18;1 + xe,8; j= 1 Note that do and to don't have to be equal, and their values can be foundwith cross validation ⑦& Visualization with contour plot: I · X minima ⑧ - Ex