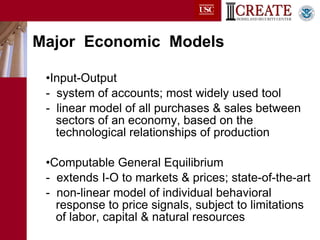
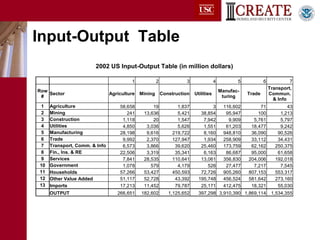
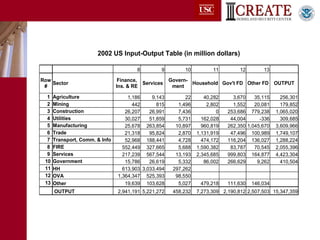
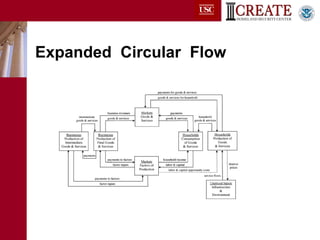
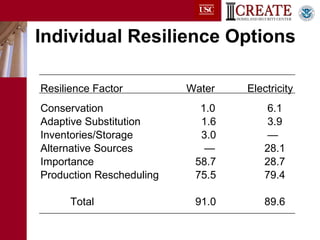
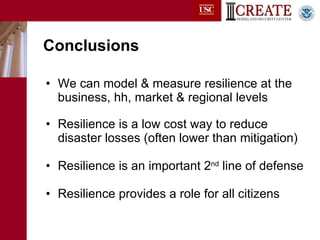
Regional Models & Data to Analyze Disaster Mitigation & Resilience Adam Rose Center for Risk and Economic Analysis of Terrorism Events University of Southern California
Regional Scope of U.S. Disasters Disasters rarely extend to national boundary -  sheer size of the U.S. -  limits of natural and man-made forces Even localized impacts ripple to trading area -  interdependence of economic sectors -  connecting role of infrastructure
Re-Examine Interdependence Old View—Brittle -  multiplier or domino perspective -  network vulnerability New View—Flexible, or Resilient -  static resilience (adjusts & adapts) -  dynamic resilience (bounces back)
Focus of Presentation Models for analyzing interdependence: -  input-output -  computable general equilibrium Incorporation of Resilience Data bases for county level analyses: -  IMPLAN -  HAZUS
Major  Economic  Models Input-Output -  system of accounts; most widely used tool  -  linear model of all purchases & sales between    sectors of an economy, based on the    technological relationships of production Computable General Equilibrium -  extends I-O to markets & prices; state-of-the-art -  non-linear model of individual behavioral     response to price signals, subject to limitations     of labor, capital & natural resources
Input-Output  Table
 
Expanded  Circular  Flow
Economic  Resilience General Definition : static : ability of a system to maintain function when shocked dynamic : speed of a system to recover from shock Types of Resilience : inherent : normal ability during crises to maintain function (input/import substitution, market reallocation) adaptive : ingenuity during crises (increased substitution possibilities, market strengthening)
Examples of Resilience Individual Business (and Household) -  conservation of critical inputs -  use of inventories -  business relocation Market -  efficient allocation of resources via price signals -  non-interruptible service premia Regional Economy -  importing scarce commodities -  information clearinghouses
 
Infrastructure-Economy Interaction through GIS
TABLE 2.  RESILIENCE TO UTILITY SERVICE DISRUPTIONS
  Resilience Factor   Water   Electricity Conservation   1.0    6.1 Adaptive Substitution   1.6  3.9 Inventories/Storage   3.0  — Alternative Sources    —    28.1 Importance     58.7   28.7 Production Rescheduling    75.5 79.4   Total     91.0    89.6  Individual Resilience Options
IMPLAN Im pact Analysis for  Plan ning Developed by several federal gov’t agencies Most popular source of regional I-O tables Consists of 3 components -  county data on economic activity -  algorithms for generating county I-O tables -  computations to perform impact analyses
HAZUS Haz ards  U nited  S tates— M ulti- H azard Loss estimation tool developed by FEMA Immense data base: -  built environment -  physical damage functions -  translation to direct economic loss -  I-O analysis to estimate indirect econ loss
Conclusions We can model & measure resilience at the business, hh, market & regional levels Resilience is a low cost way to reduce disaster losses (often lower than mitigation) Resilience is an important 2 nd  line of defense Resilience provides a role for all citizens

Regional Models & Data to Analyze Disaster Mitigation & Resilience

  • 1.
    Regional Models &Data to Analyze Disaster Mitigation & Resilience Adam Rose Center for Risk and Economic Analysis of Terrorism Events University of Southern California
  • 2.
    Regional Scope ofU.S. Disasters Disasters rarely extend to national boundary - sheer size of the U.S. - limits of natural and man-made forces Even localized impacts ripple to trading area - interdependence of economic sectors - connecting role of infrastructure
  • 3.
    Re-Examine Interdependence OldView—Brittle - multiplier or domino perspective - network vulnerability New View—Flexible, or Resilient - static resilience (adjusts & adapts) - dynamic resilience (bounces back)
  • 4.
    Focus of PresentationModels for analyzing interdependence: - input-output - computable general equilibrium Incorporation of Resilience Data bases for county level analyses: - IMPLAN - HAZUS
  • 5.
    Major Economic Models Input-Output - system of accounts; most widely used tool - linear model of all purchases & sales between sectors of an economy, based on the technological relationships of production Computable General Equilibrium - extends I-O to markets & prices; state-of-the-art - non-linear model of individual behavioral    response to price signals, subject to limitations    of labor, capital & natural resources
  • 6.
  • 7.
  • 8.
  • 9.
    Economic ResilienceGeneral Definition : static : ability of a system to maintain function when shocked dynamic : speed of a system to recover from shock Types of Resilience : inherent : normal ability during crises to maintain function (input/import substitution, market reallocation) adaptive : ingenuity during crises (increased substitution possibilities, market strengthening)
  • 10.
    Examples of ResilienceIndividual Business (and Household) - conservation of critical inputs - use of inventories - business relocation Market - efficient allocation of resources via price signals - non-interruptible service premia Regional Economy - importing scarce commodities - information clearinghouses
  • 11.
  • 12.
  • 13.
    TABLE 2. RESILIENCE TO UTILITY SERVICE DISRUPTIONS
  • 14.
      Resilience Factor Water Electricity Conservation 1.0 6.1 Adaptive Substitution 1.6 3.9 Inventories/Storage 3.0 — Alternative Sources — 28.1 Importance 58.7 28.7 Production Rescheduling 75.5 79.4 Total 91.0 89.6  Individual Resilience Options
  • 15.
    IMPLAN Im pactAnalysis for Plan ning Developed by several federal gov’t agencies Most popular source of regional I-O tables Consists of 3 components - county data on economic activity - algorithms for generating county I-O tables - computations to perform impact analyses
  • 16.
    HAZUS Haz ards U nited S tates— M ulti- H azard Loss estimation tool developed by FEMA Immense data base: - built environment - physical damage functions - translation to direct economic loss - I-O analysis to estimate indirect econ loss
  • 17.
    Conclusions We canmodel & measure resilience at the business, hh, market & regional levels Resilience is a low cost way to reduce disaster losses (often lower than mitigation) Resilience is an important 2 nd line of defense Resilience provides a role for all citizens