Real-World Evidence andClaims
Databases
Craig I. Coleman, PharmD
Professor, University of Connecticut (UCONN)
Co-Director and Methods-Chief, UCONN Evidence-Based
Practice Center
Craig.coleman@hhchealth.org
2.
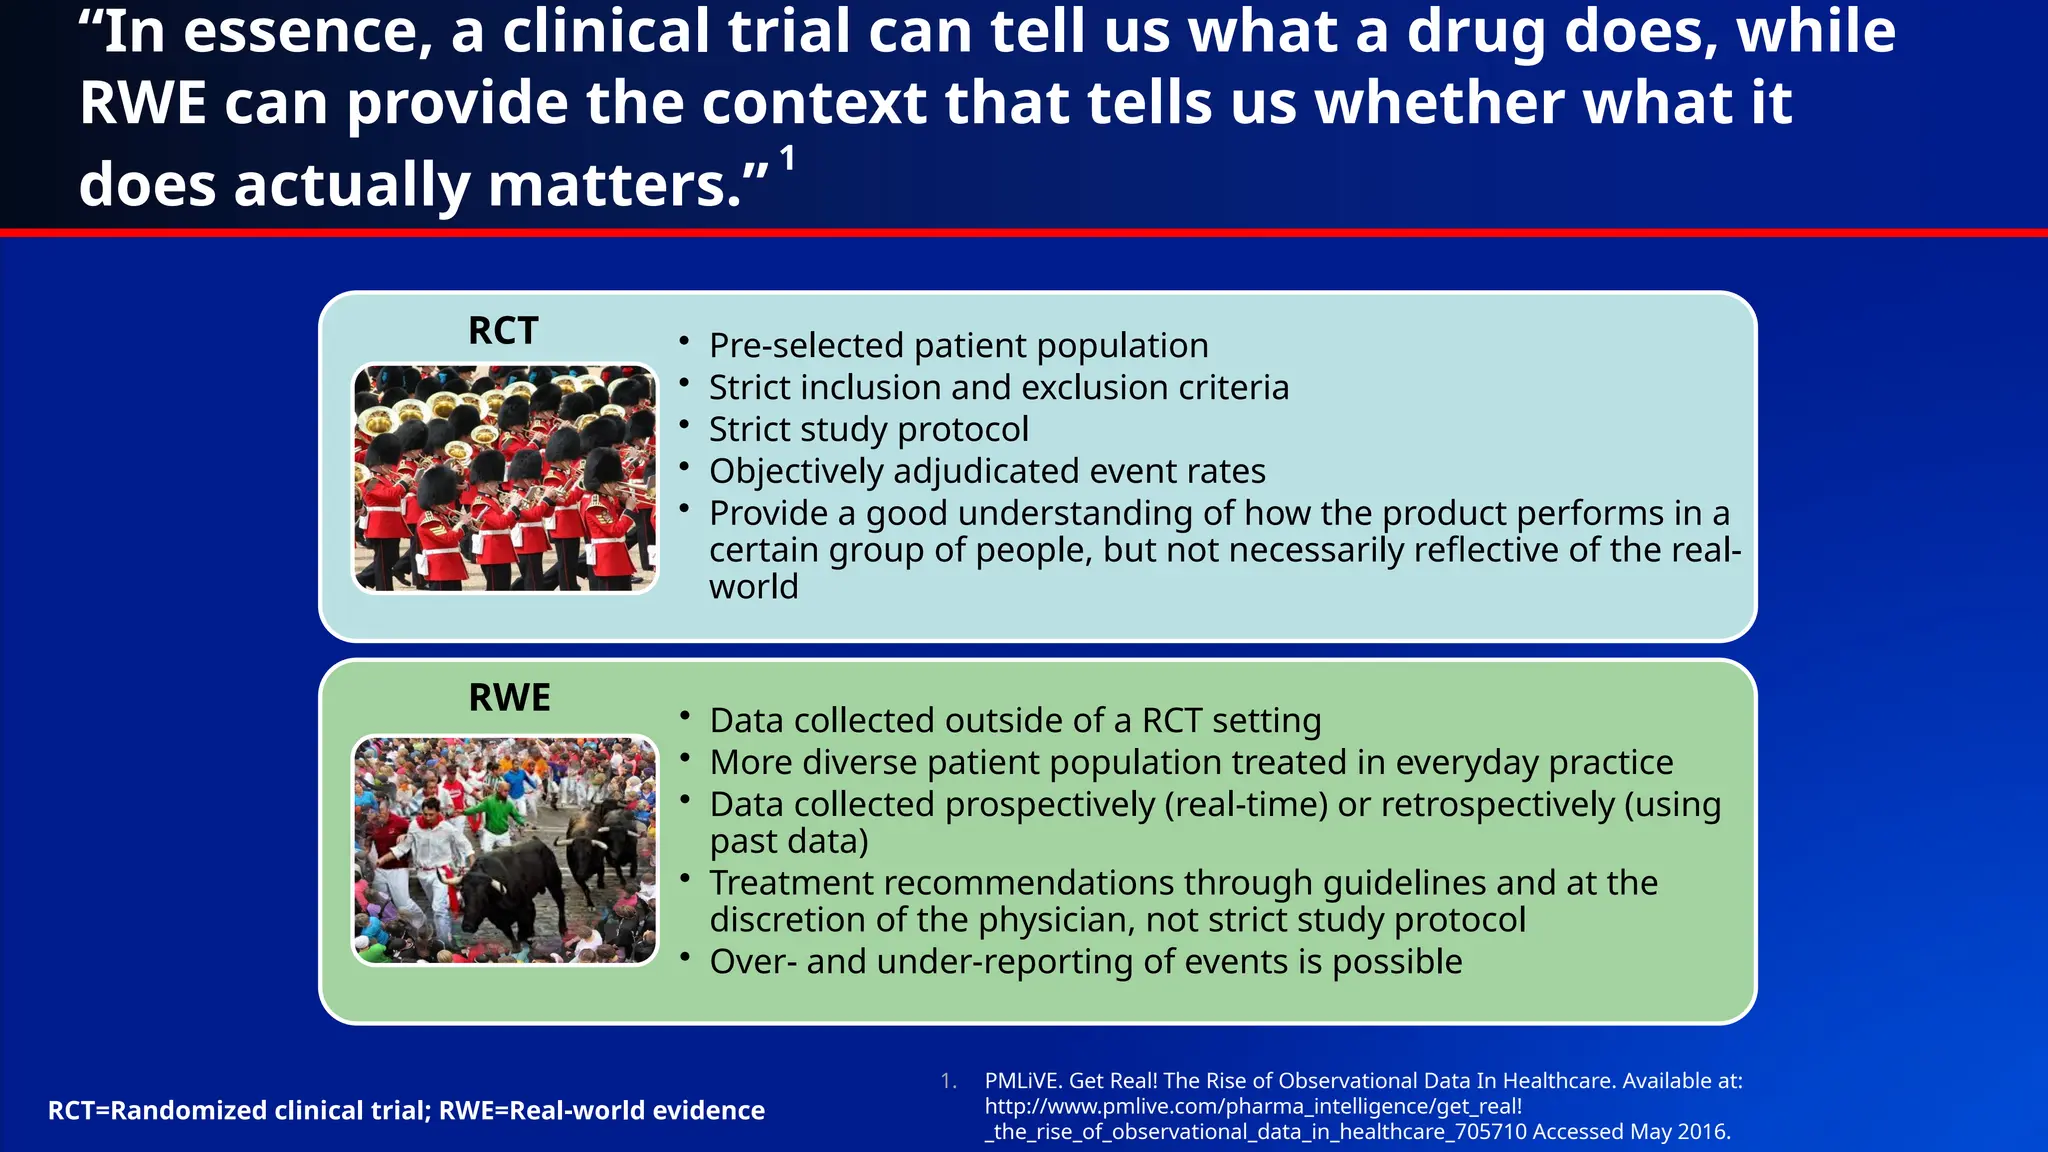
“In essence, aclinical trial can tell us what a drug does, while
RWE can provide the context that tells us whether what it
does actually matters.”
1
• Pre-selected patient population
• Strict inclusion and exclusion criteria
• Strict study protocol
• Objectively adjudicated event rates
• Provide a good understanding of how the product performs in a
certain group of people, but not necessarily reflective of the real-
world
• Data collected outside of a RCT setting
• More diverse patient population treated in everyday practice
• Data collected prospectively (real-time) or retrospectively (using
past data)
• Treatment recommendations through guidelines and at the
discretion of the physician, not strict study protocol
• Over- and under-reporting of events is possible
RCT
RWE
1. PMLiVE. Get Real! The Rise of Observational Data In Healthcare. Available at:
http://www.pmlive.com/pharma_intelligence/get_real!
_the_rise_of_observational_data_in_healthcare_705710 Accessed May 2016.
RCT=Randomized clinical trial; RWE=Real-world evidence
3.
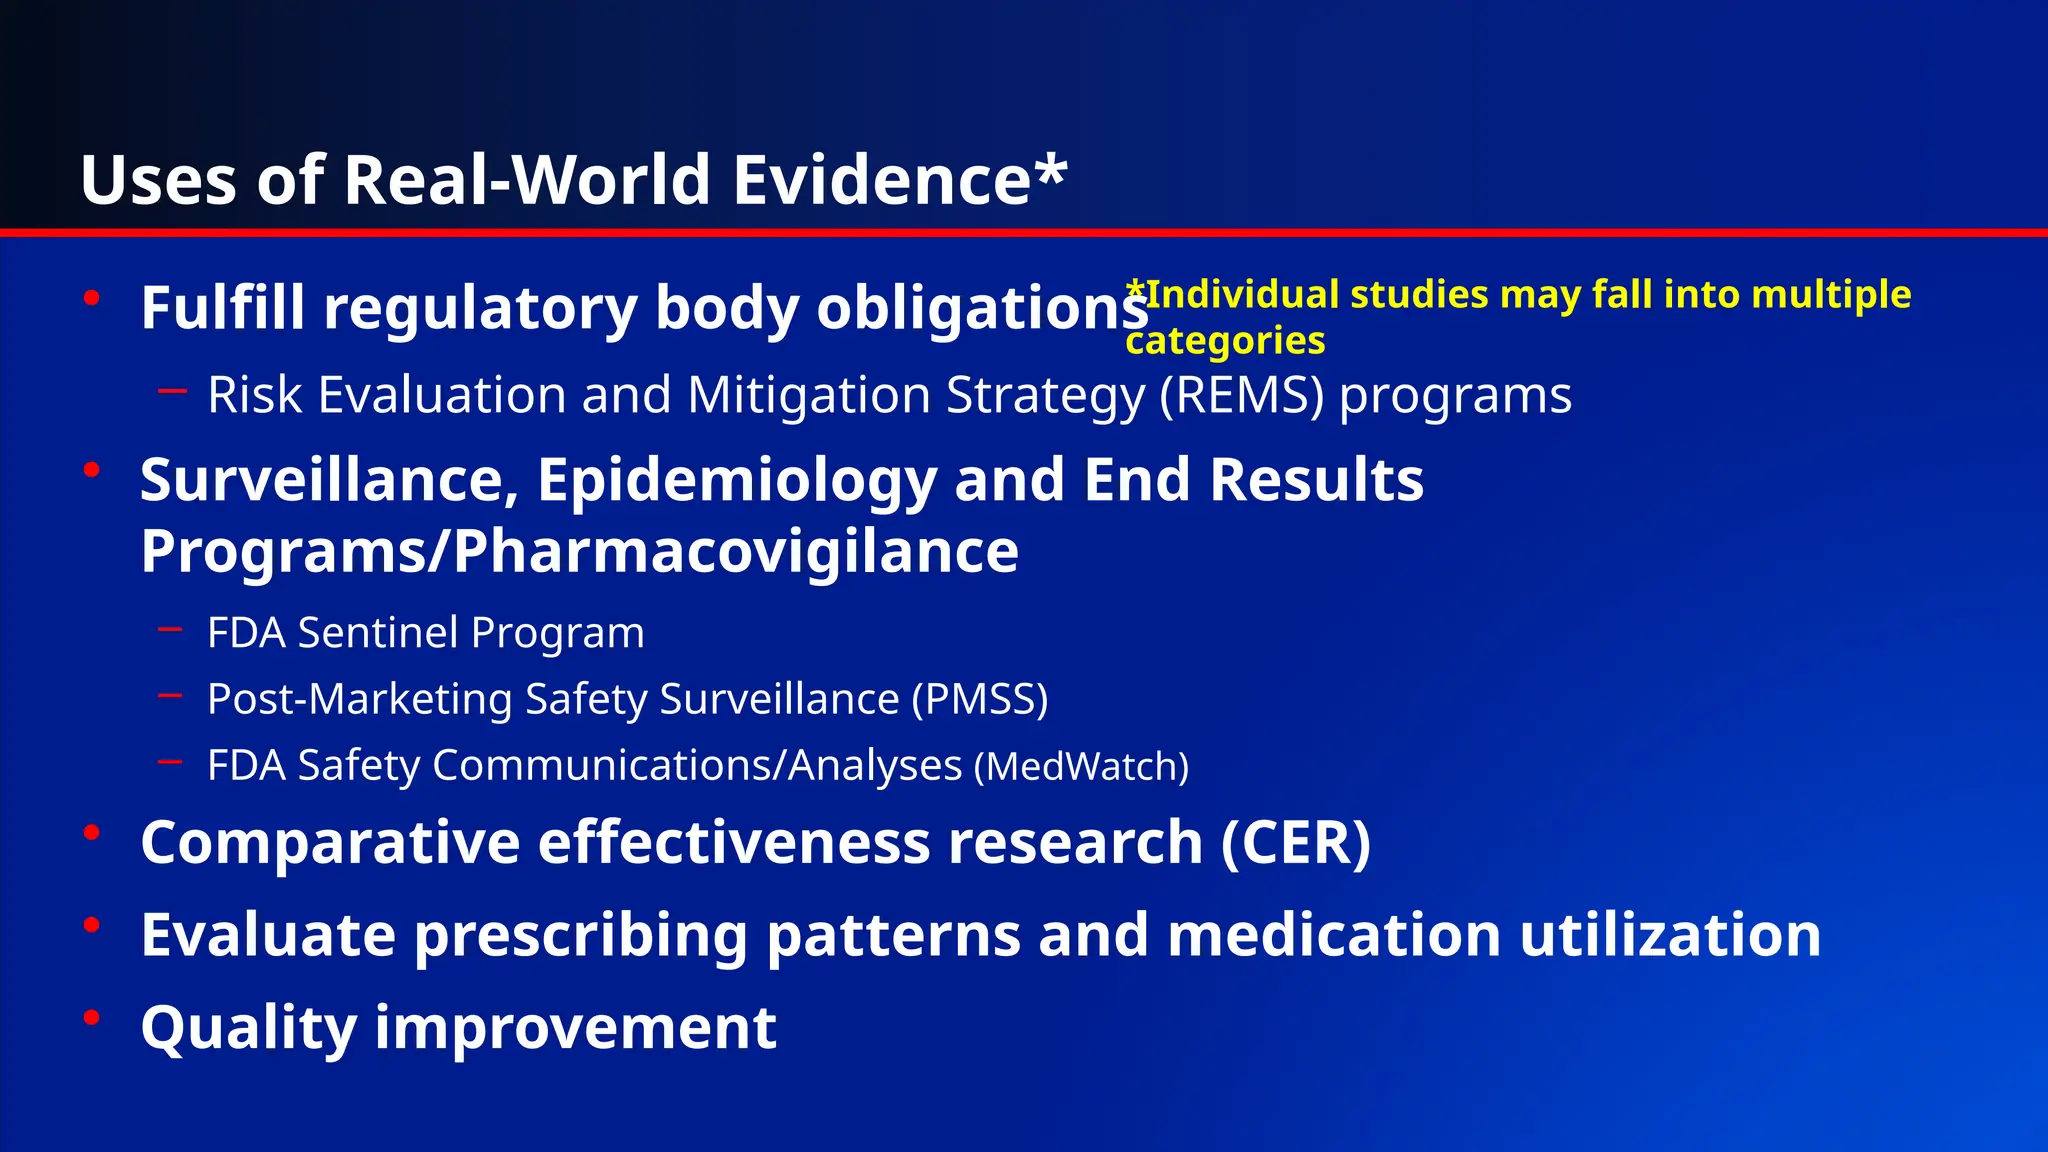
Uses of Real-WorldEvidence*
• Fulfill regulatory body obligations
– Risk Evaluation and Mitigation Strategy (REMS) programs
• Surveillance, Epidemiology and End Results
Programs/Pharmacovigilance
– FDA Sentinel Program
– Post-Marketing Safety Surveillance (PMSS)
– FDA Safety Communications/Analyses (MedWatch)
• Comparative effectiveness research (CER)
• Evaluate prescribing patterns and medication utilization
• Quality improvement
*Individual studies may fall into multiple
categories
4.
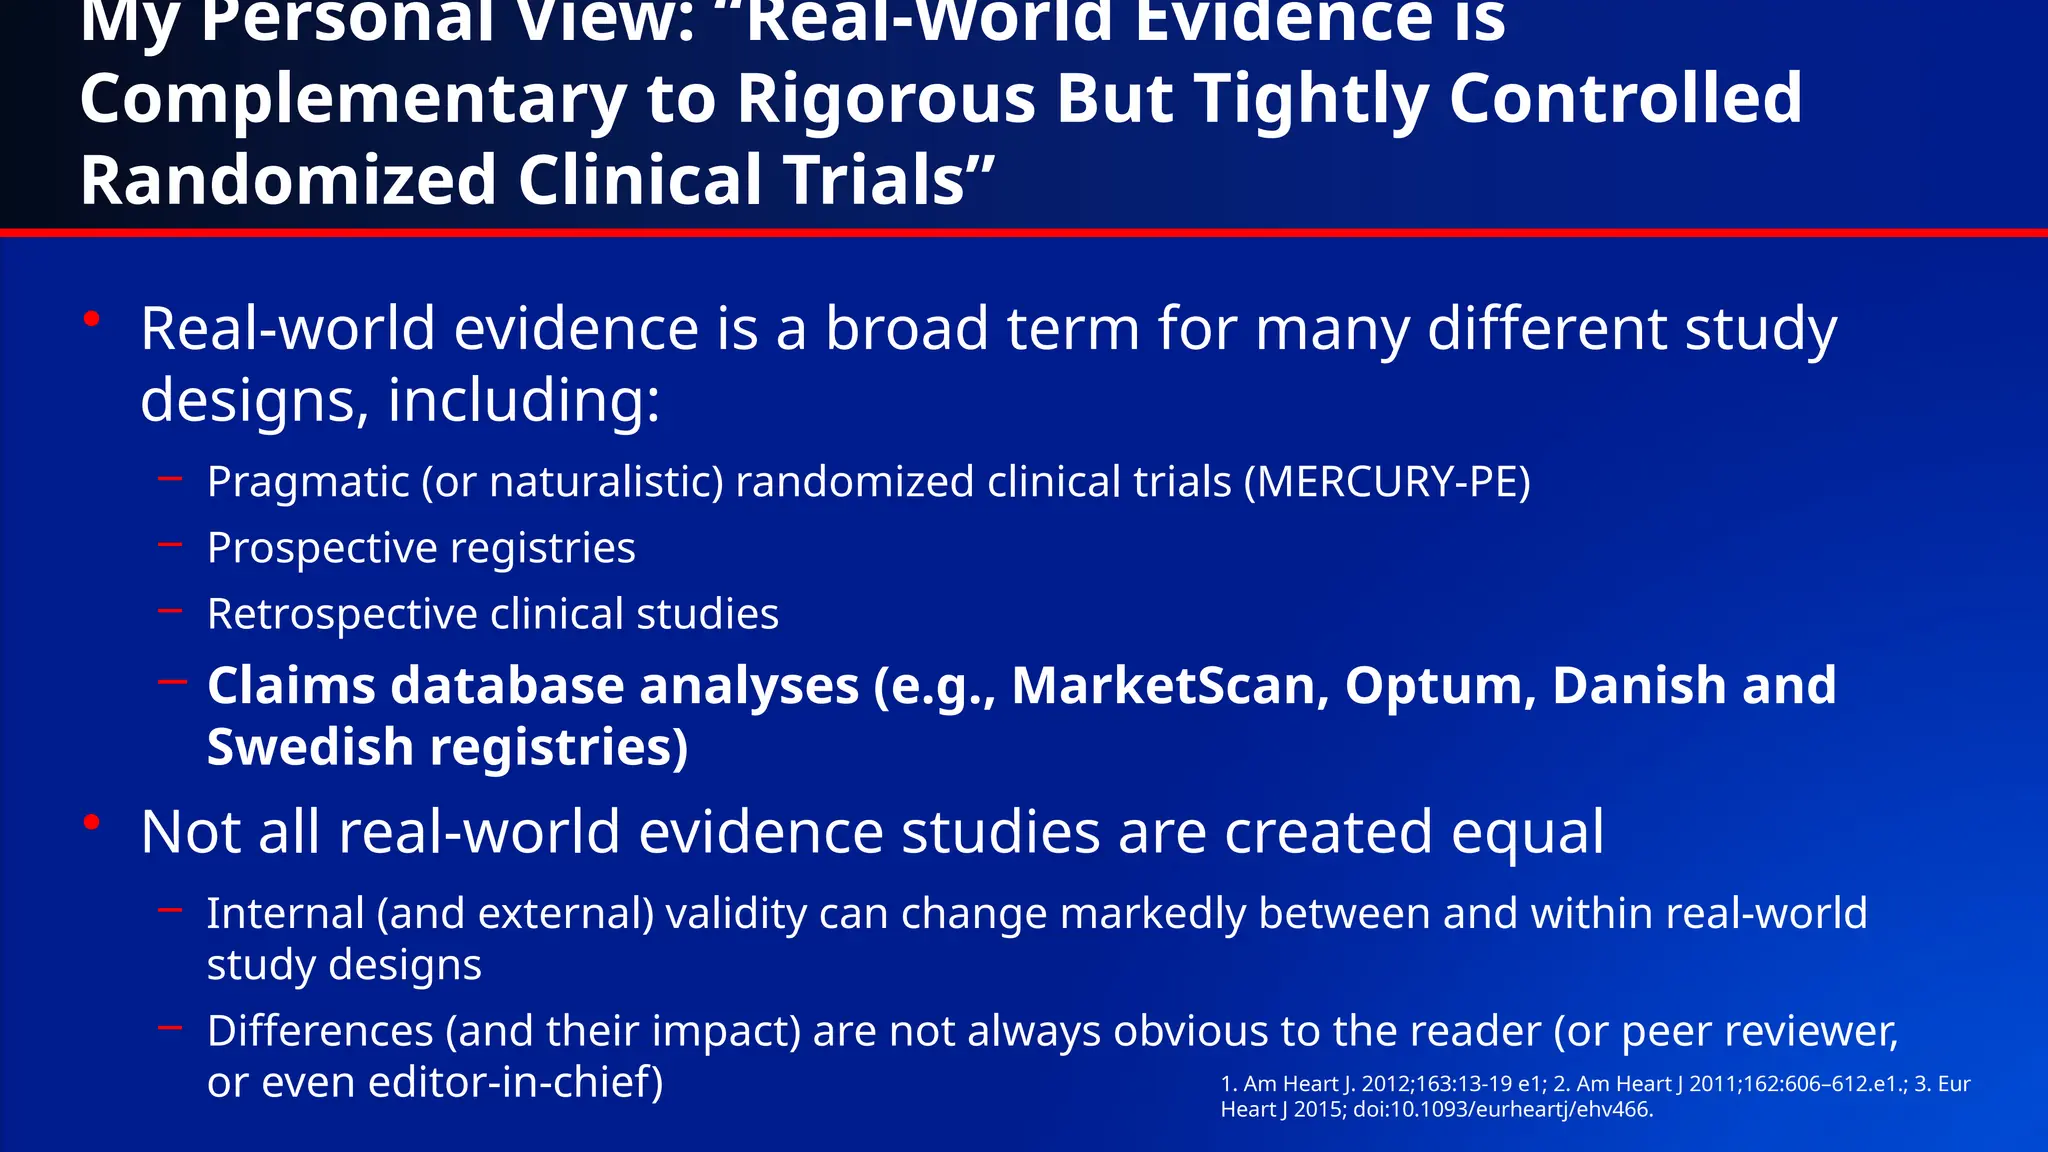
My Personal View:“Real-World Evidence is
Complementary to Rigorous But Tightly Controlled
Randomized Clinical Trials”
• Real-world evidence is a broad term for many different study
designs, including:
– Pragmatic (or naturalistic) randomized clinical trials (MERCURY-PE)
– Prospective registries
– Retrospective clinical studies
– Claims database analyses (e.g., MarketScan, Optum, Danish and
Swedish registries)
• Not all real-world evidence studies are created equal
– Internal (and external) validity can change markedly between and within real-world
study designs
– Differences (and their impact) are not always obvious to the reader (or peer reviewer,
or even editor-in-chief) 1. Am Heart J. 2012;163:13-19 e1; 2. Am Heart J 2011;162:606–612.e1.; 3. Eur
Heart J 2015; doi:10.1093/eurheartj/ehv466.
5.
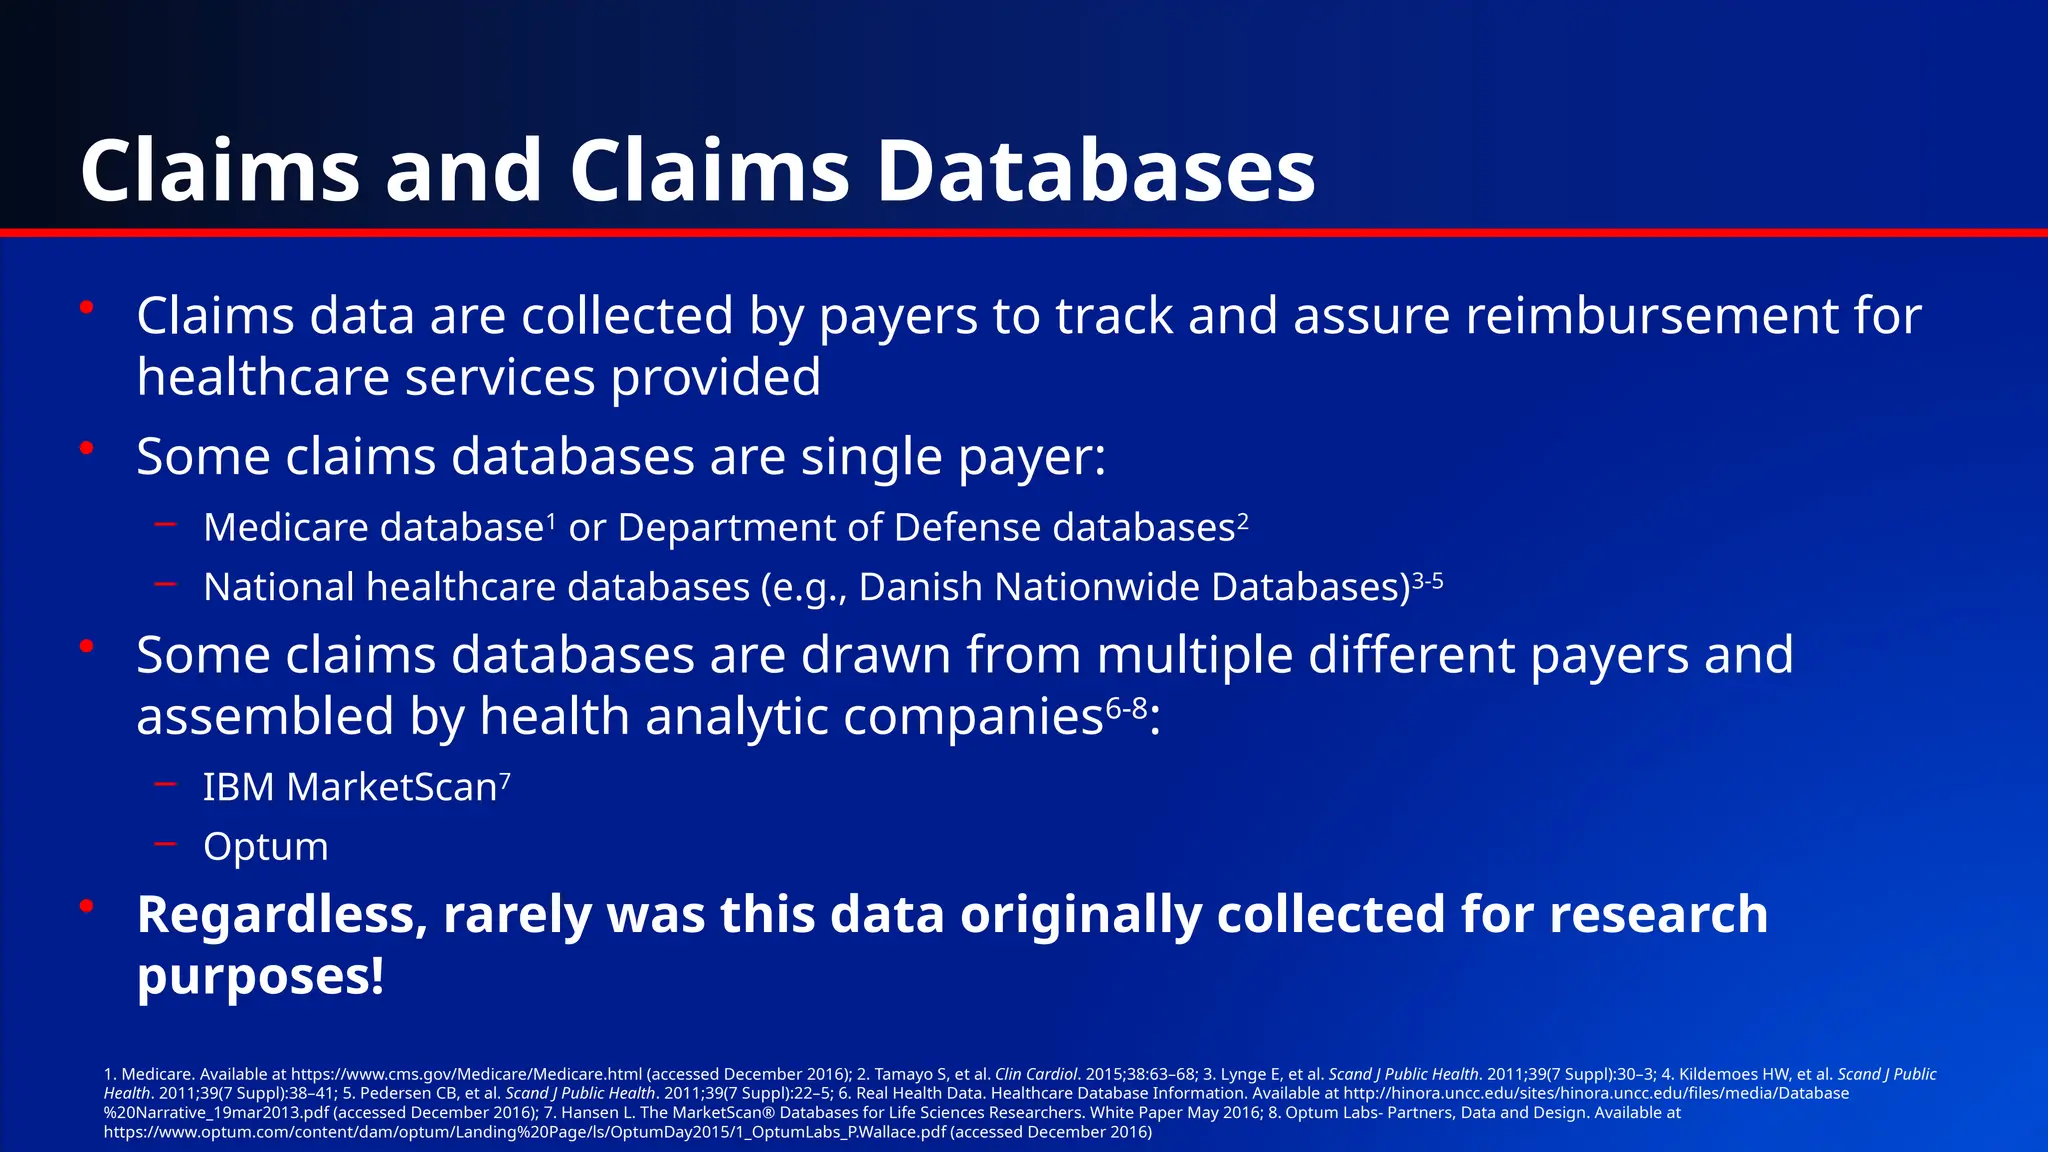
Claims and ClaimsDatabases
• Claims data are collected by payers to track and assure reimbursement for
healthcare services provided
• Some claims databases are single payer:
– Medicare database1
or Department of Defense databases2
– National healthcare databases (e.g., Danish Nationwide Databases)3-5
• Some claims databases are drawn from multiple different payers and
assembled by health analytic companies6-8
:
– IBM MarketScan7
– Optum
• Regardless, rarely was this data originally collected for research
purposes!
1. Medicare. Available at https://www.cms.gov/Medicare/Medicare.html (accessed December 2016); 2. Tamayo S, et al. Clin Cardiol. 2015;38:63–68; 3. Lynge E, et al. Scand J Public Health. 2011;39(7 Suppl):30–3; 4. Kildemoes HW, et al. Scand J Public
Health. 2011;39(7 Suppl):38–41; 5. Pedersen CB, et al. Scand J Public Health. 2011;39(7 Suppl):22–5; 6. Real Health Data. Healthcare Database Information. Available at http://hinora.uncc.edu/sites/hinora.uncc.edu/files/media/Database
%20Narrative_19mar2013.pdf (accessed December 2016); 7. Hansen L. The MarketScan® Databases for Life Sciences Researchers. White Paper May 2016; 8. Optum Labs- Partners, Data and Design. Available at
https://www.optum.com/content/dam/optum/Landing%20Page/ls/OptumDay2015/1_OptumLabs_P.Wallace.pdf (accessed December 2016)
6.
What is ina Claims Database?
• Typically only include data needed to facilitate reimbursement of healthcare services1-2
– Basic demographics (age, gender, race [sometimes], insurance type)
– Types and counts of healthcare encounters (hospitalisations, office visits, diagnostic and
laboratory tests)
– Diagnostic codes (ICD-10) associated with each healthcare encounter
– Prescription drug fill records
• Each healthcare encounter is (typically) associated with multiple diagnosis codes3
– The first or primary code listed should depict the main reason for the encounter
– Subsequent codes are used to demonstrate patient complexity/acuity (and possible justification
for higher reimbursement) by designating comorbidities
– Diagnostic codes are often chosen by a medical coder/biller based upon review of medical
records for an encounter
ICD=International Classification of Diseases
1. Real Health Data. Healthcare Database Information. Available at http://hinora.uncc.edu/sites/hinora.uncc.edu/files/media/Database%20Narrative_19mar2013.pdf (accessed December 2016); 2. Gandhi S, et al. J Manag Care Spec Pharm.
1999;5:215-222; 3. ProfNet. Questions and answers on ICD10 coding. Available at http://www.profnetmedical.co.za/media/1080/qa-on-icd-10-v2.pdf (accessed December 2016)
7.
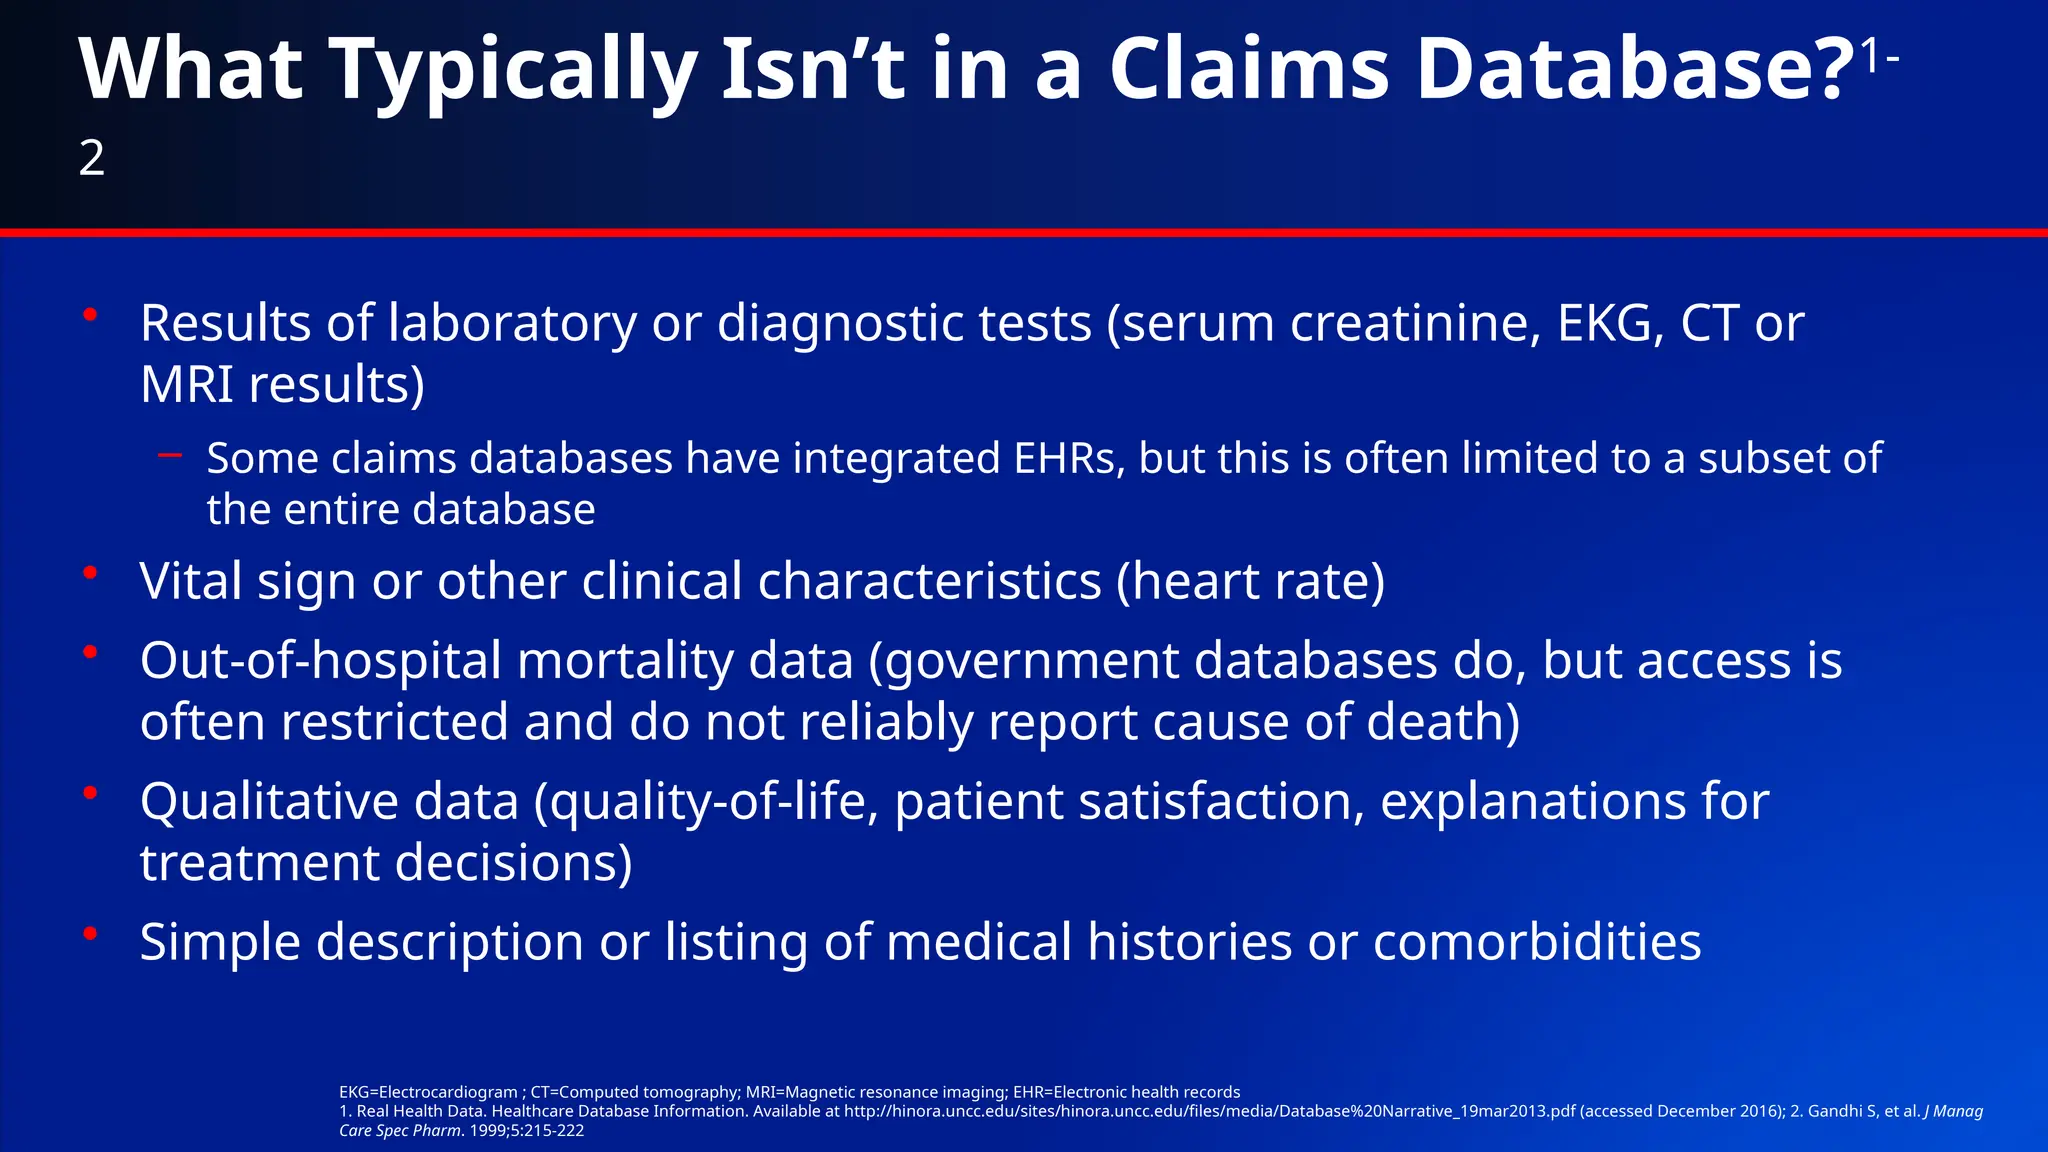
What Typically Isn’tin a Claims Database?1-
2
• Results of laboratory or diagnostic tests (serum creatinine, EKG, CT or
MRI results)
– Some claims databases have integrated EHRs, but this is often limited to a subset of
the entire database
• Vital sign or other clinical characteristics (heart rate)
• Out-of-hospital mortality data (government databases do, but access is
often restricted and do not reliably report cause of death)
• Qualitative data (quality-of-life, patient satisfaction, explanations for
treatment decisions)
• Simple description or listing of medical histories or comorbidities
EKG=Electrocardiogram ; CT=Computed tomography; MRI=Magnetic resonance imaging; EHR=Electronic health records
1. Real Health Data. Healthcare Database Information. Available at http://hinora.uncc.edu/sites/hinora.uncc.edu/files/media/Database%20Narrative_19mar2013.pdf (accessed December 2016); 2. Gandhi S, et al. J Manag
Care Spec Pharm. 1999;5:215-222
8.
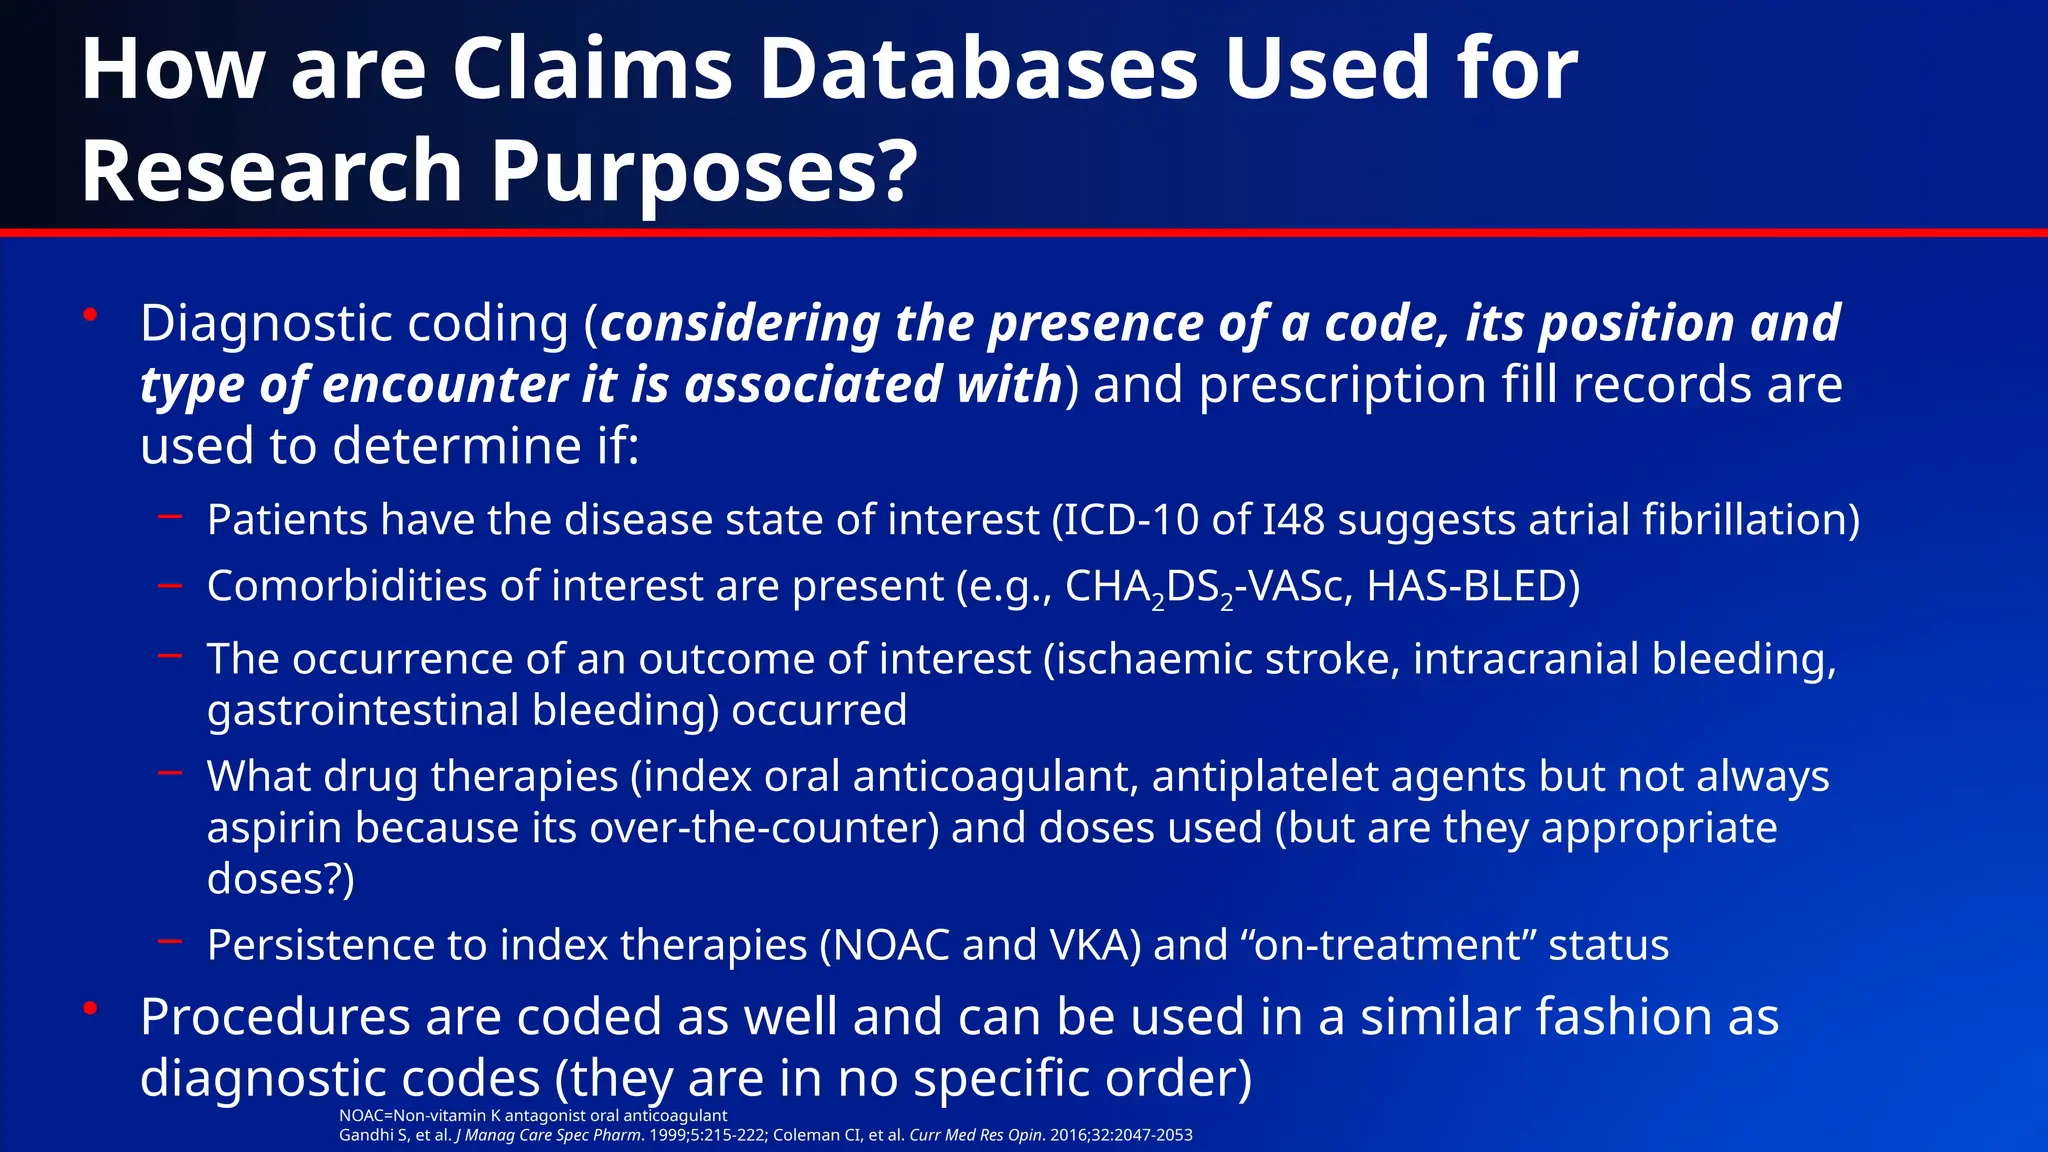
How are ClaimsDatabases Used for
Research Purposes?
• Diagnostic coding (considering the presence of a code, its position and
type of encounter it is associated with) and prescription fill records are
used to determine if:
– Patients have the disease state of interest (ICD-10 of I48 suggests atrial fibrillation)
– Comorbidities of interest are present (e.g., CHA2DS2-VASc, HAS-BLED)
– The occurrence of an outcome of interest (ischaemic stroke, intracranial bleeding,
gastrointestinal bleeding) occurred
– What drug therapies (index oral anticoagulant, antiplatelet agents but not always
aspirin because its over-the-counter) and doses used (but are they appropriate
doses?)
– Persistence to index therapies (NOAC and VKA) and “on-treatment” status
• Procedures are coded as well and can be used in a similar fashion as
diagnostic codes (they are in no specific order)
NOAC=Non-vitamin K antagonist oral anticoagulant
Gandhi S, et al. J Manag Care Spec Pharm. 1999;5:215-222; Coleman CI, et al. Curr Med Res Opin. 2016;32:2047-2053
9.
Common Limitations ofClaims Database
Analyses1-2
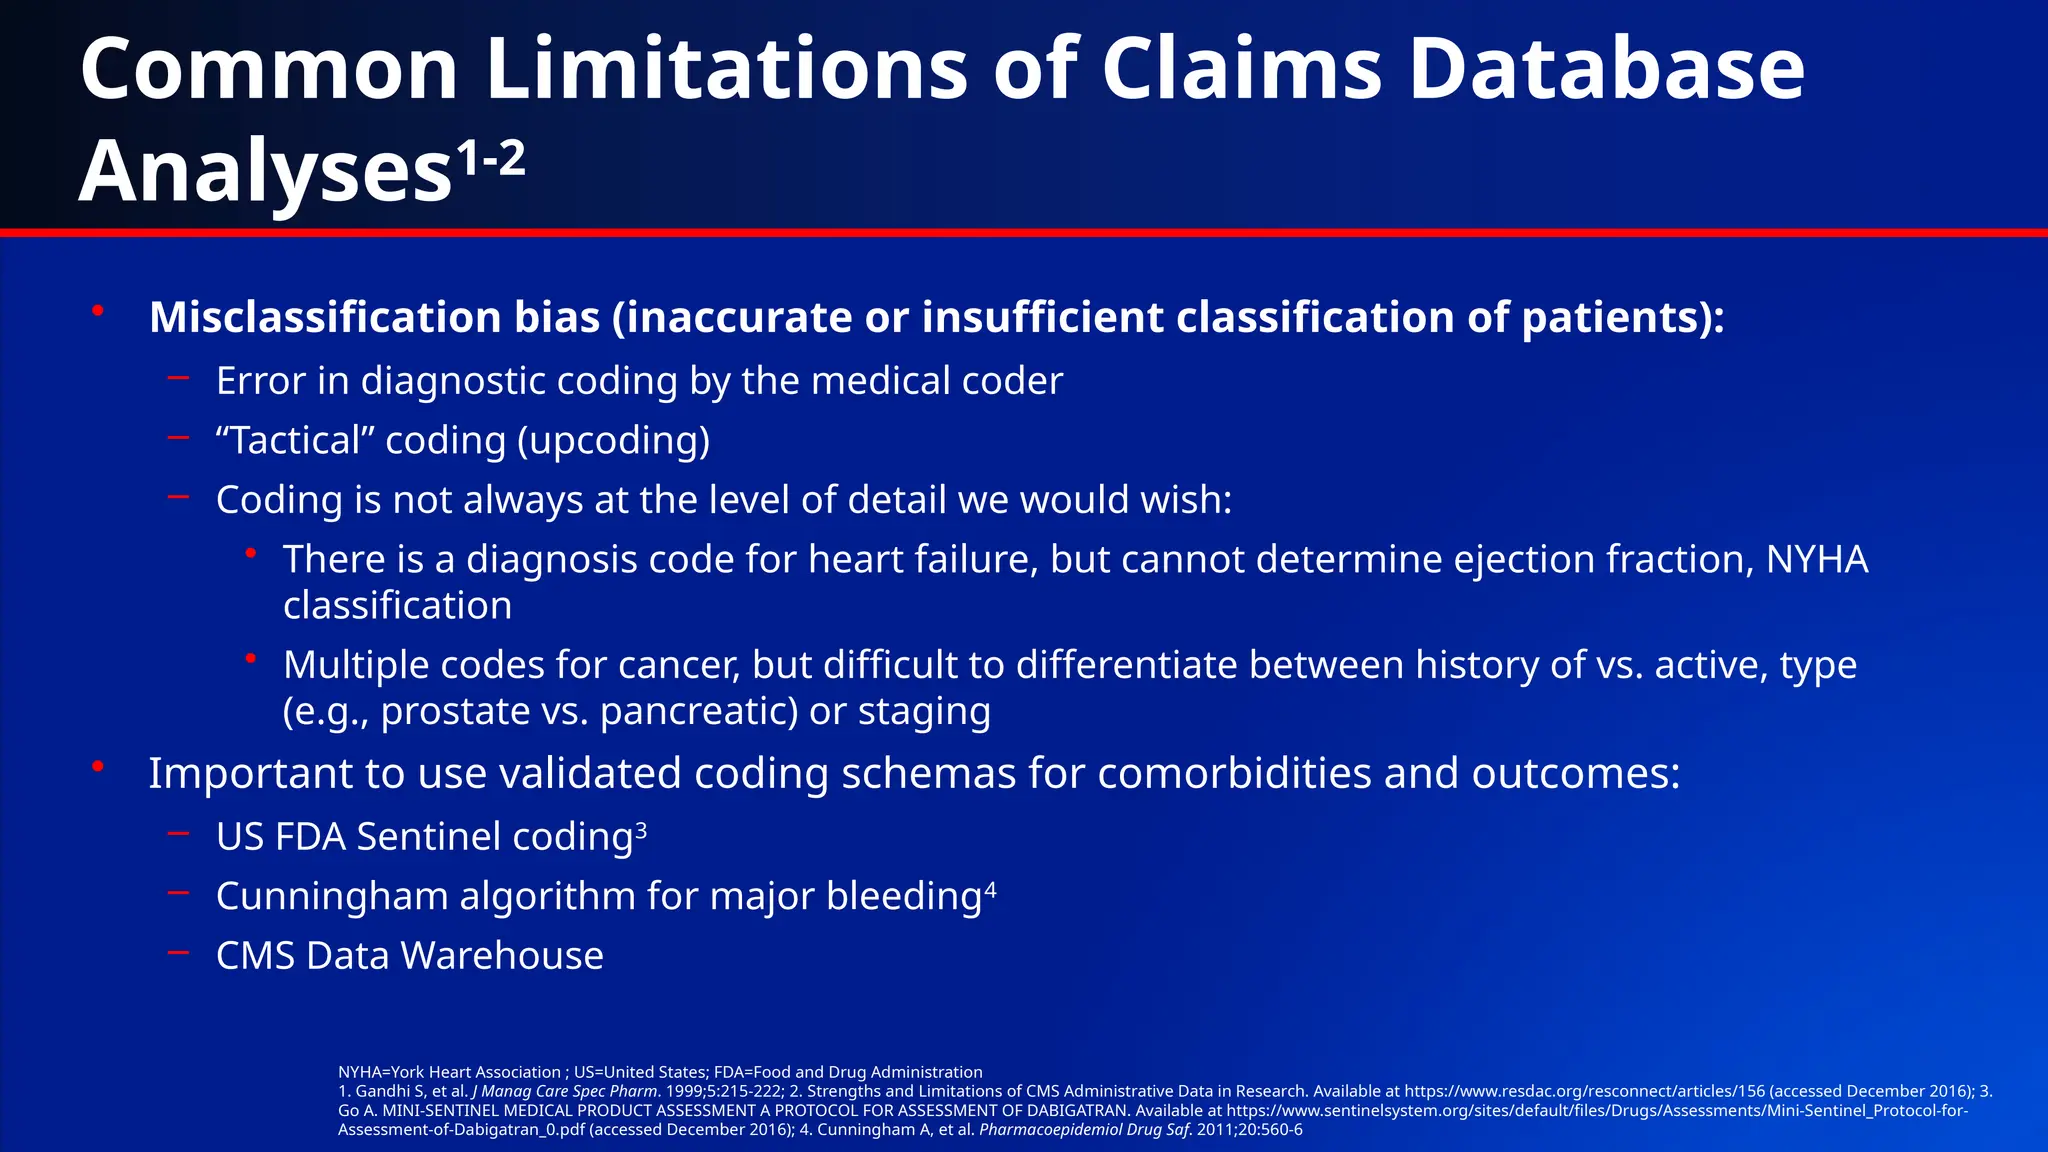
• Misclassification bias (inaccurate or insufficient classification of patients):
– Error in diagnostic coding by the medical coder
– “Tactical” coding (upcoding)
– Coding is not always at the level of detail we would wish:
• There is a diagnosis code for heart failure, but cannot determine ejection fraction, NYHA
classification
• Multiple codes for cancer, but difficult to differentiate between history of vs. active, type
(e.g., prostate vs. pancreatic) or staging
• Important to use validated coding schemas for comorbidities and outcomes:
– US FDA Sentinel coding3
– Cunningham algorithm for major bleeding4
– CMS Data Warehouse
NYHA=York Heart Association ; US=United States; FDA=Food and Drug Administration
1. Gandhi S, et al. J Manag Care Spec Pharm. 1999;5:215-222; 2. Strengths and Limitations of CMS Administrative Data in Research. Available at https://www.resdac.org/resconnect/articles/156 (accessed December 2016); 3.
Go A. MINI-SENTINEL MEDICAL PRODUCT ASSESSMENT A PROTOCOL FOR ASSESSMENT OF DABIGATRAN. Available at https://www.sentinelsystem.org/sites/default/files/Drugs/Assessments/Mini-Sentinel_Protocol-for-
Assessment-of-Dabigatran_0.pdf (accessed December 2016); 4. Cunningham A, et al. Pharmacoepidemiol Drug Saf. 2011;20:560-6
10.
Inconsistency in MajorBleeding
Definitions Using Claims
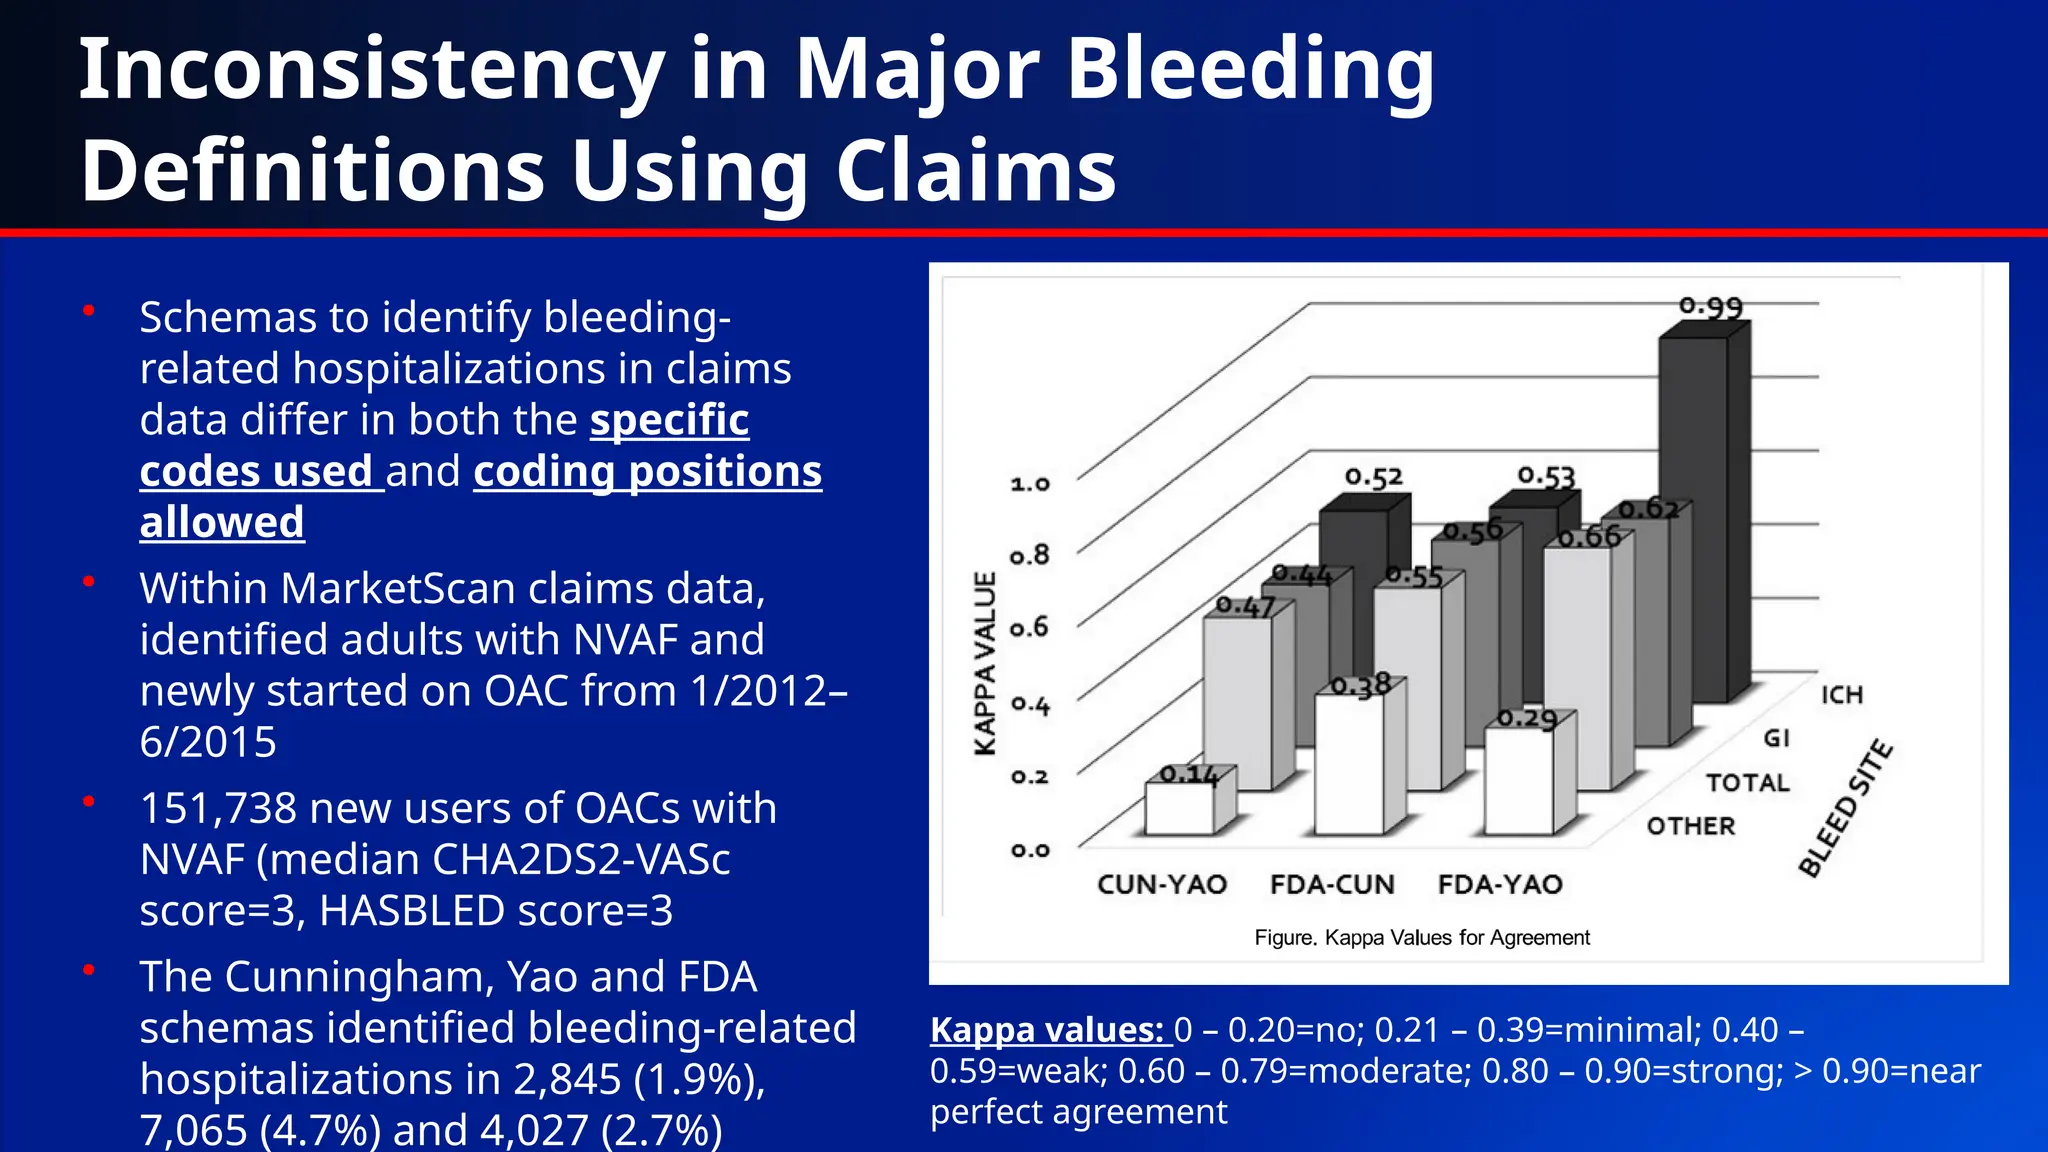
• Schemas to identify bleeding-
related hospitalizations in claims
data differ in both the specific
codes used and coding positions
allowed
• Within MarketScan claims data,
identified adults with NVAF and
newly started on OAC from 1/2012–
6/2015
• 151,738 new users of OACs with
NVAF (median CHA2DS2-VASc
score=3, HASBLED score=3
• The Cunningham, Yao and FDA
schemas identified bleeding-related
hospitalizations in 2,845 (1.9%),
7,065 (4.7%) and 4,027 (2.7%)
Kappa values: 0 – 0.20=no; 0.21 – 0.39=minimal; 0.40 –
0.59=weak; 0.60 – 0.79=moderate; 0.80 – 0.90=strong; > 0.90=near
perfect agreement
11.
Common Limitations ofClaims Database
Analyses
• Confounding (imbalance between “relevant” characteristics)
– Want to be able to say “All other things being equal…!”
– But it is highly likely patients receiving compared therapies vary in important characteristics
• Methods used to adjust or balance patients on “relevant” characteristics
– Regression and/or propensity scoring (adjustment, weighting, “greedy matching”)
• Characteristics adjusted/matched upon should take into account not just
the disease state, but also the endpoints of interest
– Matching on CHA2DS2-VASc and HAS-BLED criteria may be sufficient for stroke or major
bleeding in NVAF, but is it sufficient for all-cause mortality?
– Studies often match on ~30-50 “relevant” characteristics, but many more diagnoses and drugs
exist
• In the absence of randomisation, we will ALWAYS have residual
confounding
1. Gandhi S, et al. J Manag Care Spec Pharm. 1999;5:215-222; 2. Strengths and Limitations of CMS Administrative Data in Research. Available at https://www.resdac.org/resconnect/articles/156 (accessed December 2016);
3. Austin PC. Multivariate Behav Res. 2011;46:399–424; 4. Coleman CI, et al. Curr Med Res Opin. 2016;32:2047-2053
12.
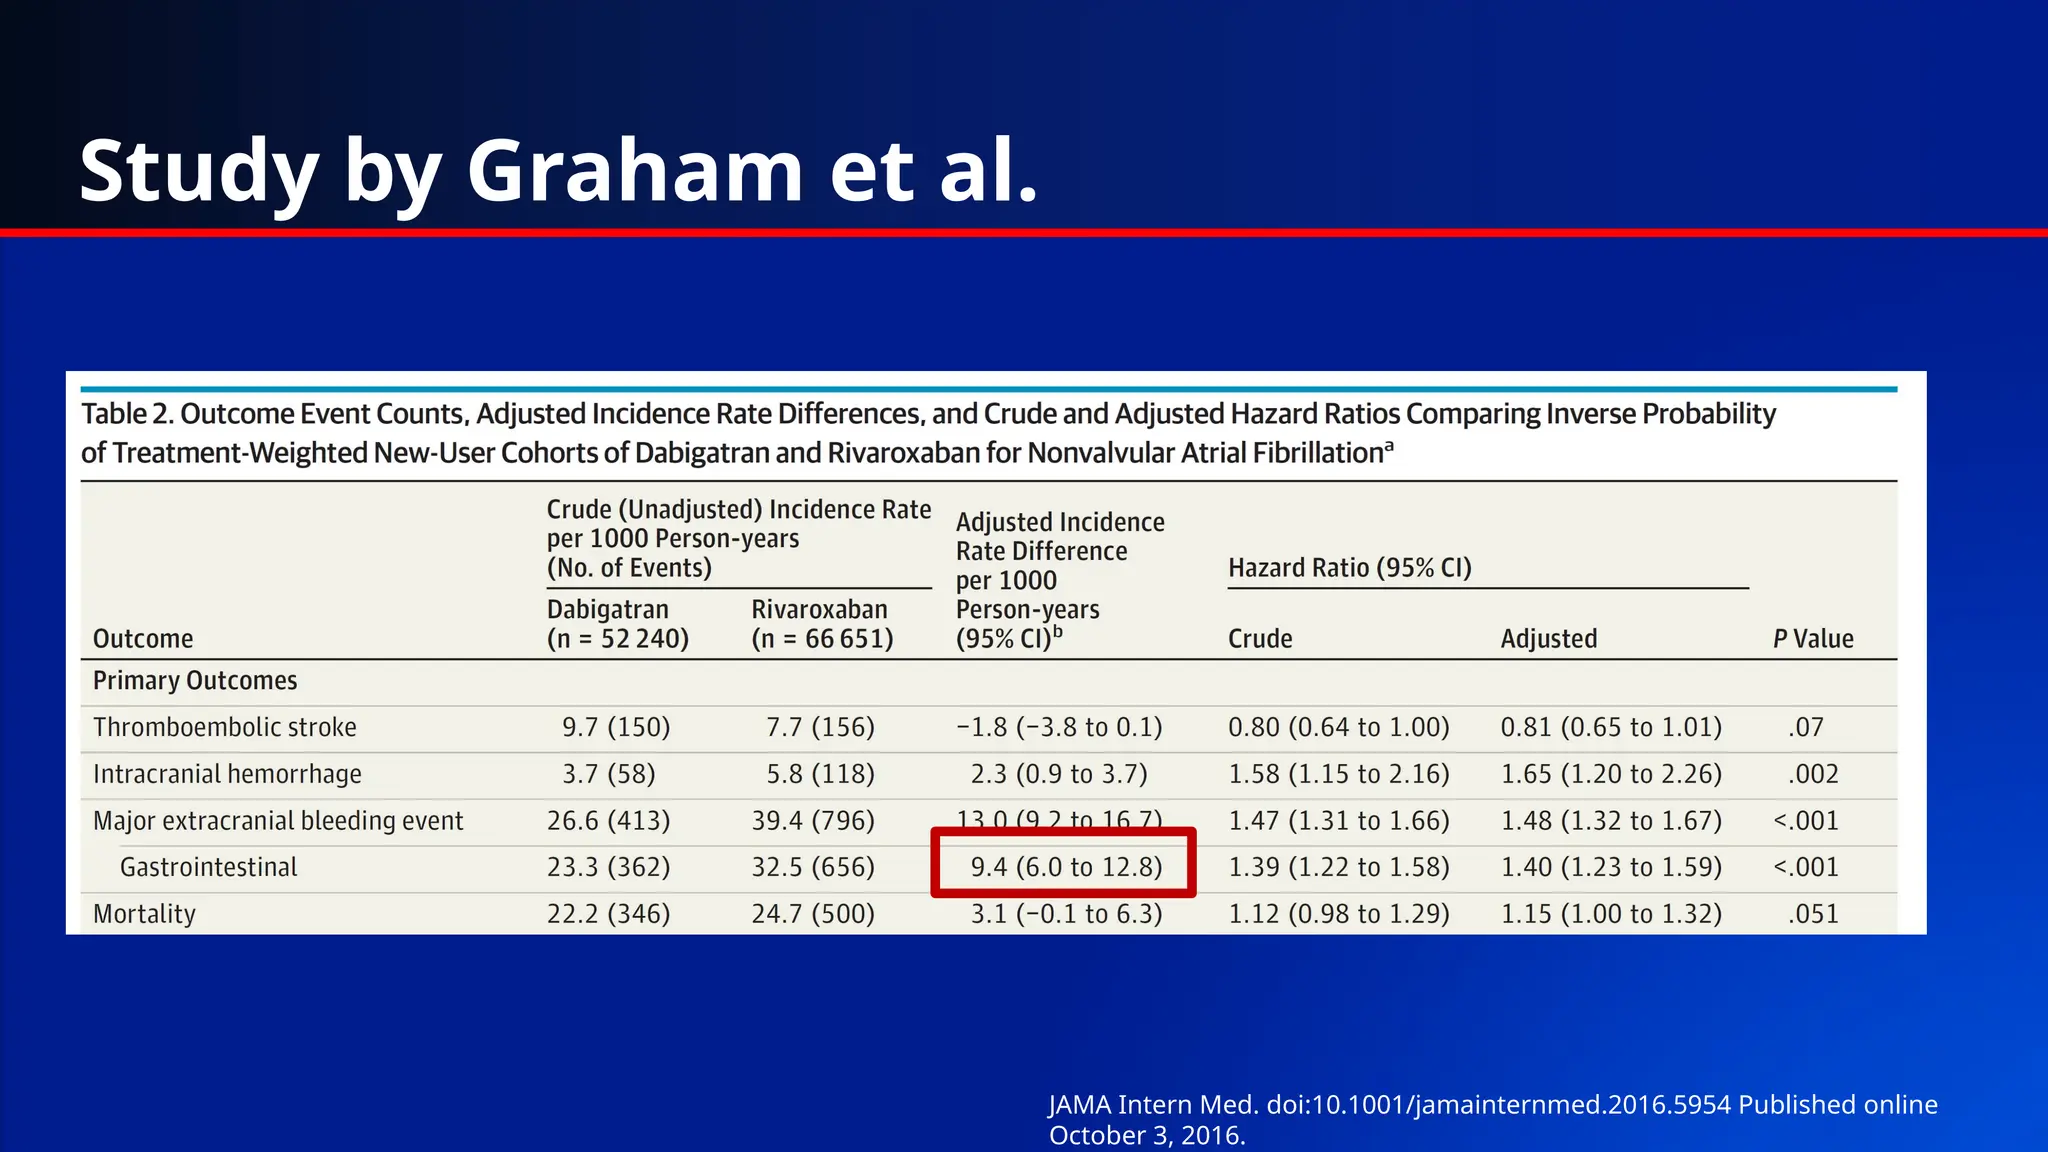
Study by Grahamet al.
JAMA Intern Med. doi:10.1001/jamainternmed.2016.5954 Published online
October 3, 2016.
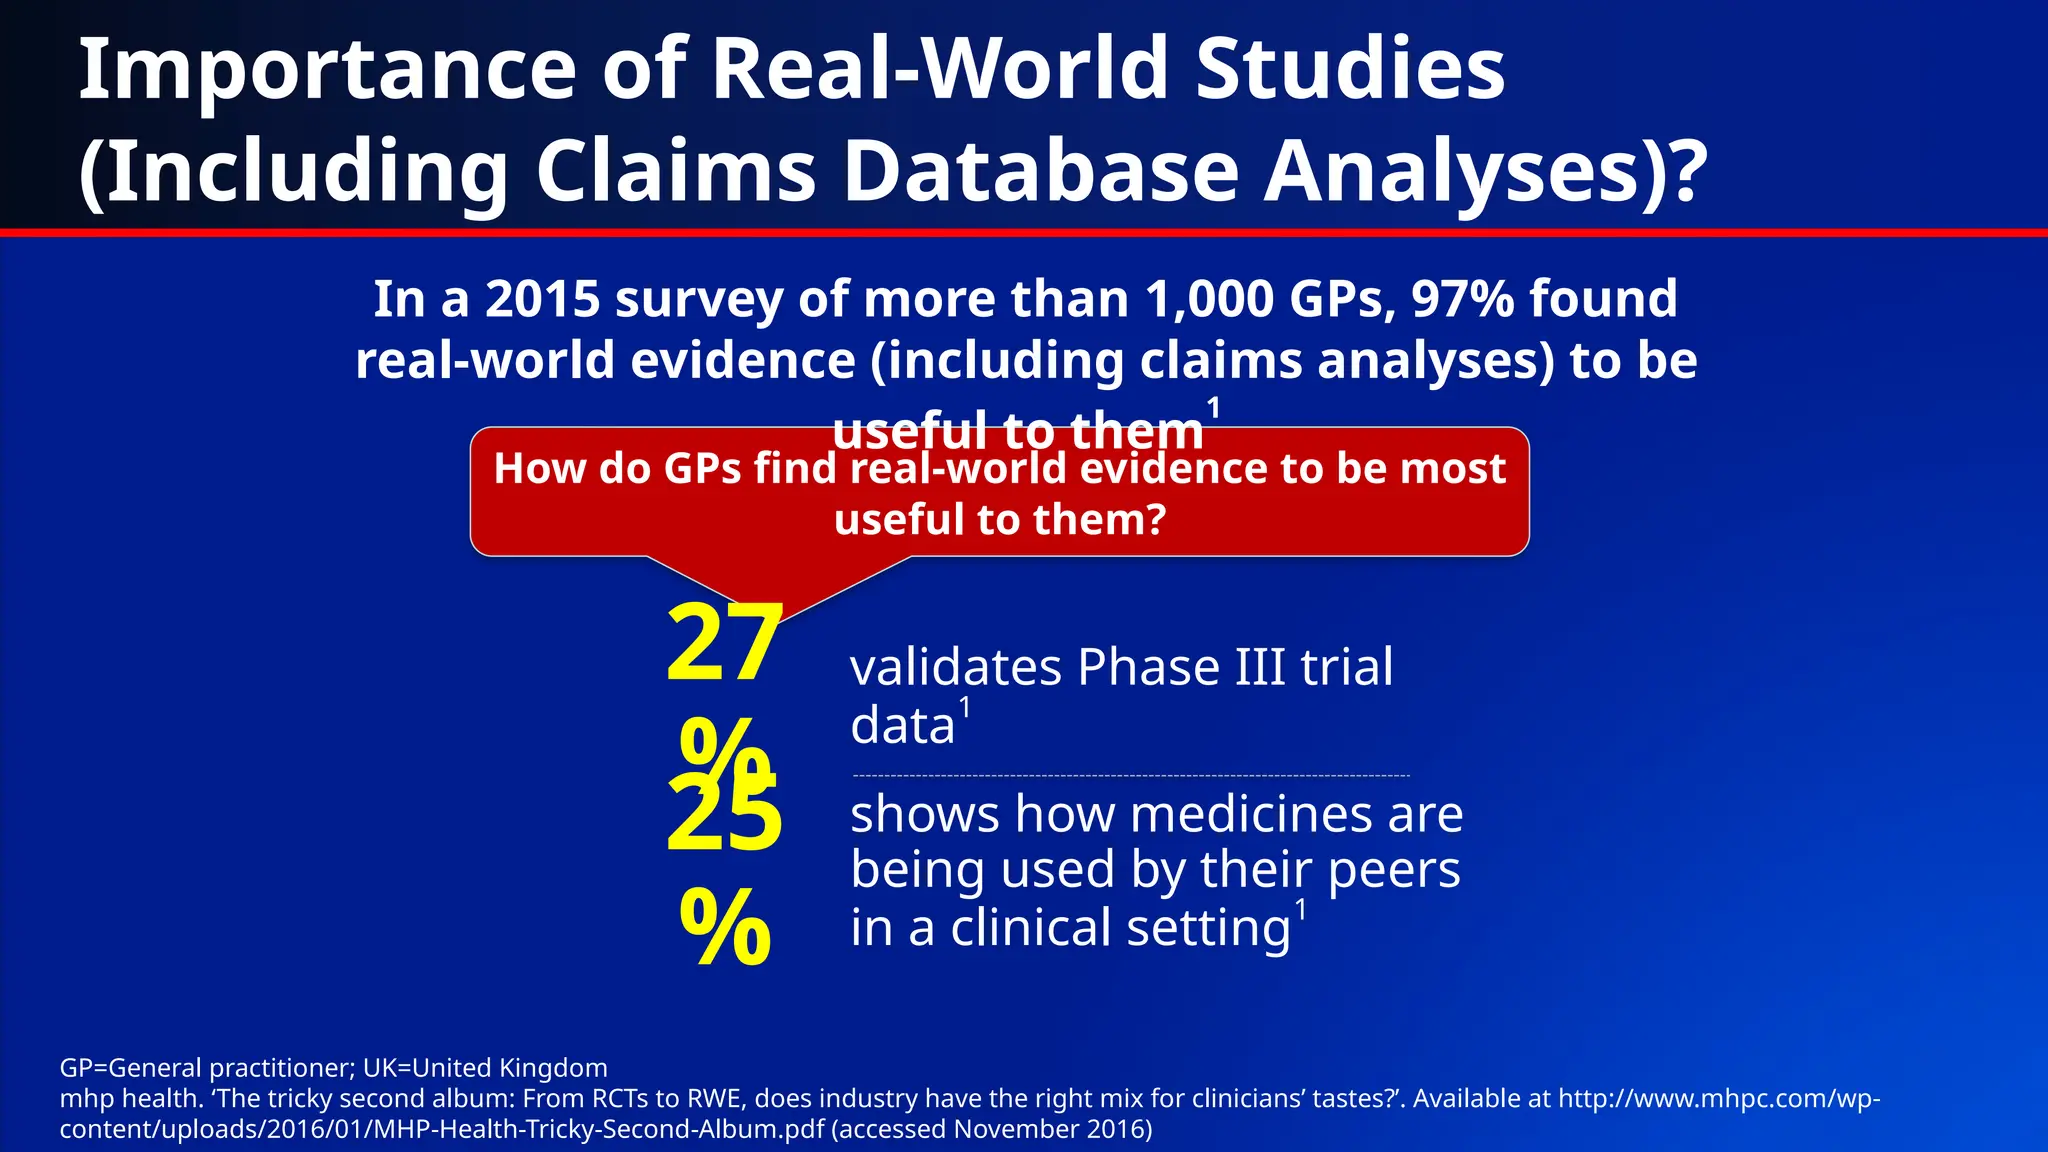
How do GPsfind real-world evidence to be most
useful to them?
validates Phase III trial
data
1
27
% shows how medicines are
being used by their peers
in a clinical setting1
25
%
Importance of Real-World Studies
(Including Claims Database Analyses)?
In a 2015 survey of more than 1,000 GPs, 97% found
real-world evidence (including claims analyses) to be
useful to them
1
GP=General practitioner; UK=United Kingdom
mhp health. ‘The tricky second album: From RCTs to RWE, does industry have the right mix for clinicians’ tastes?’. Available at http://www.mhpc.com/wp-
content/uploads/2016/01/MHP-Health-Tricky-Second-Album.pdf (accessed November 2016)
16.
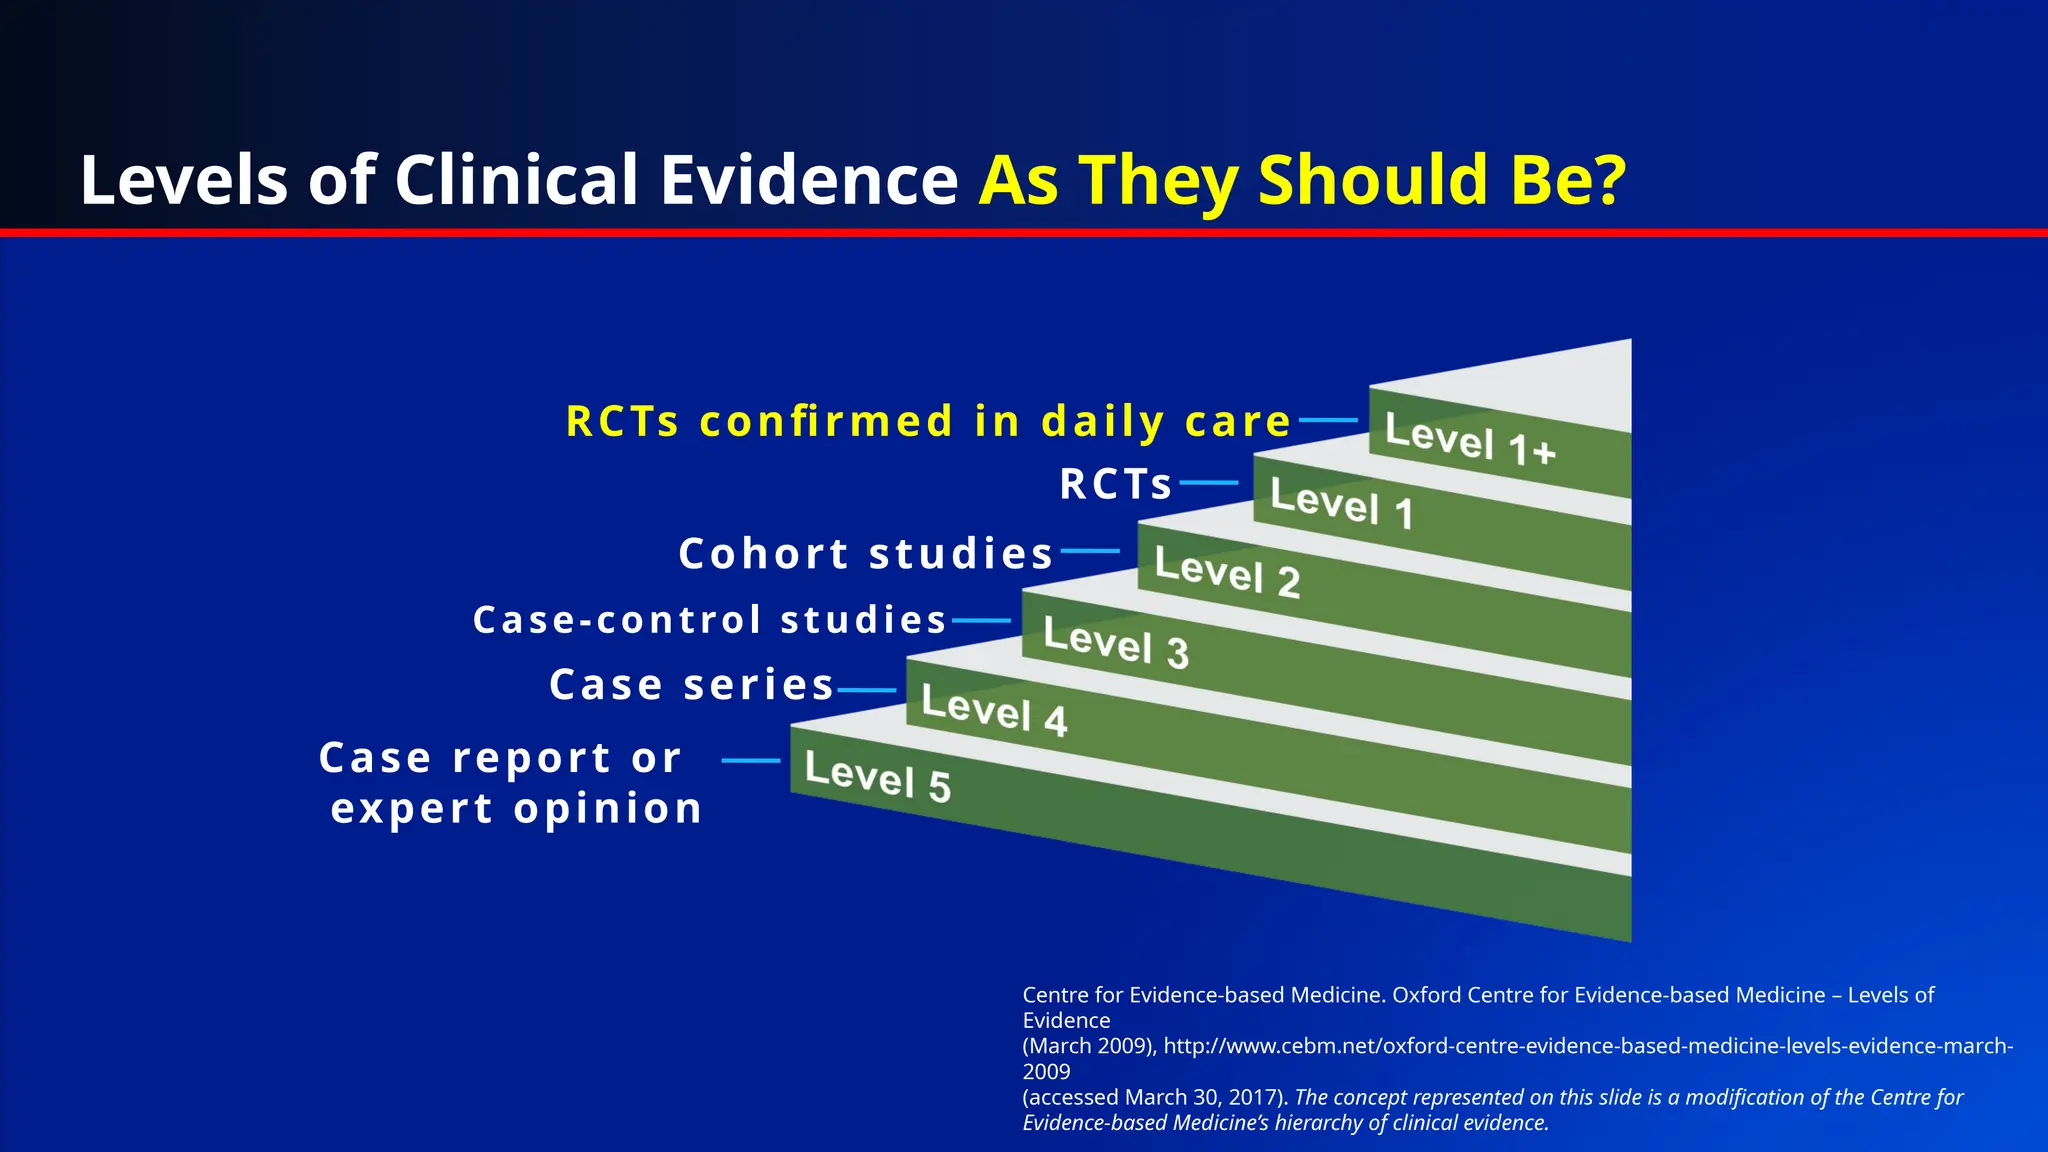
Case report or
expertopinion
Case series
Case-control studies
Cohort studies
RCTs
RCTs confirmed in daily care
Levels of Clinical Evidence As They Should Be?
Centre for Evidence-based Medicine. Oxford Centre for Evidence-based Medicine – Levels of
Evidence
(March 2009), http://www.cebm.net/oxford-centre-evidence-based-medicine-levels-evidence-march-
2009
(accessed March 30, 2017). The concept represented on this slide is a modification of the Centre for
Evidence-based Medicine’s hierarchy of clinical evidence.
![What is in a Claims Database?
• Typically only include data needed to facilitate reimbursement of healthcare services1-2
– Basic demographics (age, gender, race [sometimes], insurance type)
– Types and counts of healthcare encounters (hospitalisations, office visits, diagnostic and
laboratory tests)
– Diagnostic codes (ICD-10) associated with each healthcare encounter
– Prescription drug fill records
• Each healthcare encounter is (typically) associated with multiple diagnosis codes3
– The first or primary code listed should depict the main reason for the encounter
– Subsequent codes are used to demonstrate patient complexity/acuity (and possible justification
for higher reimbursement) by designating comorbidities
– Diagnostic codes are often chosen by a medical coder/biller based upon review of medical
records for an encounter
ICD=International Classification of Diseases
1. Real Health Data. Healthcare Database Information. Available at http://hinora.uncc.edu/sites/hinora.uncc.edu/files/media/Database%20Narrative_19mar2013.pdf (accessed December 2016); 2. Gandhi S, et al. J Manag Care Spec Pharm.
1999;5:215-222; 3. ProfNet. Questions and answers on ICD10 coding. Available at http://www.profnetmedical.co.za/media/1080/qa-on-icd-10-v2.pdf (accessed December 2016)](https://image.slidesharecdn.com/claimsdatabaseresearch3-250724142604-c2f5ae33/75/Real-world-evidence-and-claims-databases-6-2048.jpg)