Task Done:
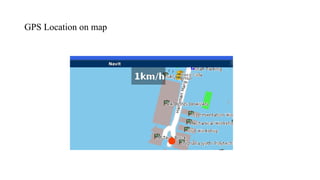
InterfacedUSB GPS Receiver to the Beagleboard.
Successfully installed a navigation software “Navit” on
Beagleboard which shows the GPS location on OSM
maps.
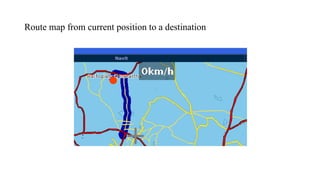
Navit automatically generates the route information
from current location to the destination.
Also Navit gives audio prompts (like take right/left
turn) to assist the driver during the journey.
GPS Module
Accelerometer
Electromechanical device thatwill measure
acceleration.
It is a sensor.
Its value does not change at uniform speed.
Accelerometer Selection
Dynamic Range
Sensitive axis
Size and Mass
Output
E-Speak SpeechSynthesizer
E-Speak is a compact open source software speech
synthesizer for English and other languages, for Linux.
Using e-speak command
$ "echo Welcome Please wear your seatbelt Have a safe
journey | espeak -s150 --stdin"
FFmpeg Tool
FFmpeg is a complete solution to record, convert and stream
audio and video.
We can record videos by giving the command
$ ffmpeg –t 10 –f video4linux2 –s 320x240 –i /dev/video0
/home/root/vid1.avi
18.
Accelerometer X, Y& Z directions when
mounted in a car
$GPRMC,001724.042,V,…150209,,N*44
GPS data
19.
Application Program
Initializethe accelerometer module
Save the accelerometer readings along with time stamp.
Compare the accelerometer readings with predefined threshold
values of the events and if exceeded then generate voice
prompts, text prompts, record video and evaluate the
performance index.
Plot the graph for accelerometer readings at the end of the
journey.
20.
Flow chart forapplication program
Configure the serial port to
communicate with accelerometer
module
Start
Receive the data(3-axis readings) from
the accelerometer
Play the voice prompt, displays
the text prompt, logs the GPS
data and record the video for a
specified time
Initialize the communication with the
accelerometer
Assign the data to the variables x,y,z
B
A
mCompare the readings with
predefined threshold
e
If the readings are
greater than
threshold
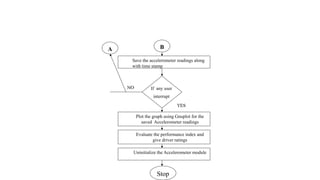
21.
B
Save the accelerometerreadings along
with time stamp
Stop
A
Uninitialize the Accelerometer module
Plot the graph using Gnuplot for the
saved Accelerometer readings
If any user
interrupt
Evaluate the performance index and
give driver ratings
22.
Event Classification
The Eventswhich are occurred after exceeding the threshold
value are classified into two events which can determine the
performance of the driver and give ratings.
Soft Events
The events which occur after threshold value has been exceeded,
slightly degrade the performance of the driver.
Hard Events
The events which occur after threshold value has been exceeded,
may lead to an accident and can be considered as worst driving.
23.
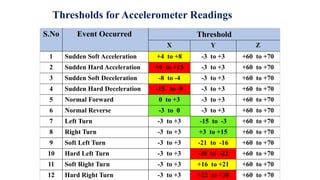
Thresholds for AccelerometerReadings
S.No Event Occurred Threshold
X Y Z
1 Sudden Soft Acceleration +4 to +8 -3 to +3 +60 to +70
2 Sudden Hard Acceleration +9 to +15 -3 to +3 +60 to +70
3 Sudden Soft Deceleration -8 to -4 -3 to +3 +60 to +70
4 Sudden Hard Deceleration -15 to -9 -3 to +3 +60 to +70
5 Normal Forward 0 to +3 -3 to +3 +60 to +70
6 Normal Reverse -3 to 0 -3 to +3 +60 to +70
7 Left Turn -3 to +3 -15 to -3 +60 to +70
8 Right Turn -3 to +3 +3 to +15 +60 to +70
9 Soft Left Turn -3 to +3 -21 to -16 +60 to +70
10 Hard Left Turn -3 to +3 -30 to -22 +60 to +70
11 Soft Right Turn -3 to +3 +16 to +21 +60 to +70
12 Hard Right Turn -3 to +3 +22 to +30 +60 to +70
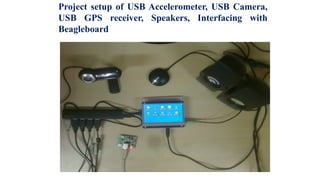
Project setup ofUSB Accelerometer, USB Camera,
USB GPS receiver, Speakers, Interfacing with
Beagleboard
26.
Accelerometer Program Initialization
LCDdisplaying the text prompt “Welcome please wear your seat
belt, have a safe journey” when the Accelerometer program is
initialized.
27.
Normal readings inthe 3-axis of Accelerometer
LCD displaying the readings of the accelerometer in the
3 – axis X, Y and Z respectively with the timestamp.
28.
Thresholds for AccelerometerReadings
S.No Event Occurred Threshold
X Y Z
1 Sudden Soft Acceleration +4 to +8 -3 to +3 +60 to +70
2 Sudden Hard Acceleration +9 to +15 -3 to +3 +60 to +70
3 Sudden Soft Deceleration -8 to -4 -3 to +3 +60 to +70
4 Sudden Hard Deceleration -15 to -9 -3 to +3 +60 to +70
5 Normal Forward 0 to +3 -3 to +3 +60 to +70
6 Normal Reverse -3 to 0 -3 to +3 +60 to +70
7 Left Turn -3 to +3 -15 to -3 +60 to +70
8 Right Turn -3 to +3 +3 to +15 +60 to +70
9 Soft Left Turn -3 to +3 -21 to -16 +60 to +70
10 Hard Left Turn -3 to +3 -30 to -22 +60 to +70
11 Soft Right Turn -3 to +3 +16 to +21 +60 to +70
12 Hard Right Turn -3 to +3 +22 to +30 +60 to +70
29.
Sudden Acceleration Detection,Soft Event
LCD displaying that “You are suddenly accelerating the
vehicle , Soft Event”
Where X = +6 , Y = +2 , Z = +70.
30.
Sudden Acceleration Detection,Hard Event
Lcd displaying that “You are suddenly accelerating the vehicle ,
Hard Event”
Where X = +13 , Y = -3 , Z = +64.
31.
Sudden Deceleration Detection, Soft Event
Lcd displaying that “You are decelerating the vehicle, Event”
Where X = -7 , Y = -2 , Z = +68.
32.
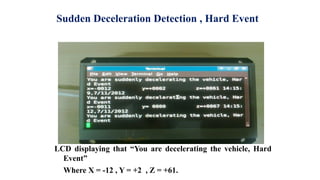
Sudden Deceleration Detection, Hard Event
LCD displaying that “You are decelerating the vehicle, Hard
Event”
Where X = -12 , Y = +2 , Z = +61.
33.
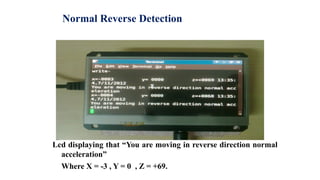
Normal Reverse Detection
Lcddisplaying that “You are moving in reverse direction normal
acceleration”
Where X = -3 , Y = 0 , Z = +69.
34.
Camera Recording whenEvent Occurred
LCD displaying the recording process with the camera,
displaying the recording time.
35.
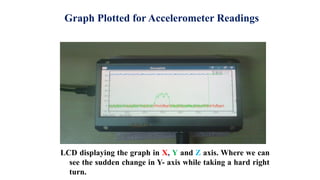
Graph Plotted forAccelerometer Readings
LCD displaying the graph in X, Y and Z axis. Where we can
see the sudden change in Y- axis while taking a hard right
turn.
36.
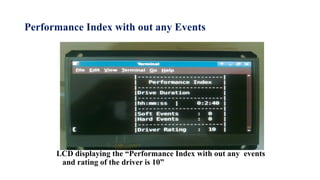
Performance Index without any Events
LCD displaying the “Performance Index with out any events
and rating of the driver is 10”
37.
Performance Index withEvents
LCD displaying the “Performance Index with certain events
occurred and rating of the driver is 9”
38.
Logged GPS data
LCDdisplaying the GPS data file of the hard right turn
event.