Download as PDF, PPTX


![Auto Scaling?
[What can be done to achieve auto-scaling?]](https://image.slidesharecdn.com/reactivebyexample6-150311143900-conversion-gate01/85/Reactive-by-example-at-Reversim-Summit-2015-40-320.jpg)


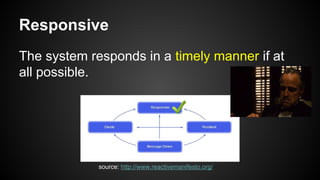
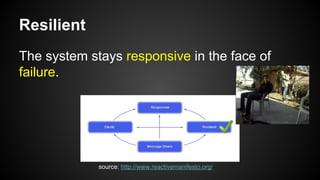
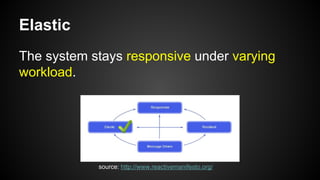
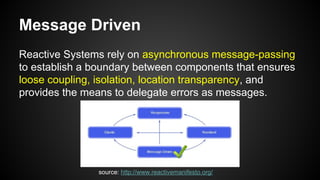
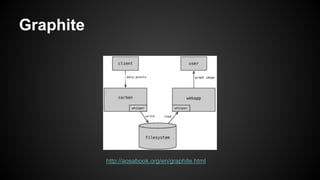
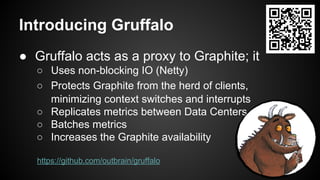
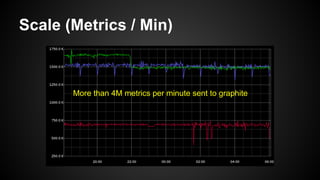
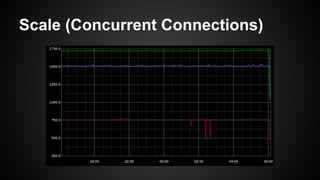
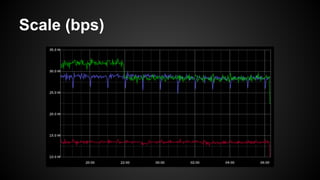
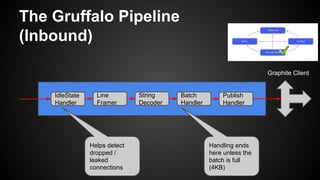
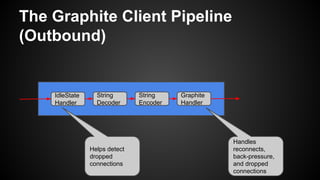
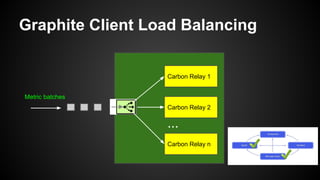
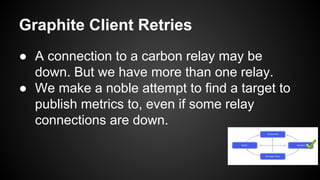
The document discusses the principles of reactive systems, focusing on responsiveness, resilience, elasticity, and message-driven architecture. It provides a case study of scaling the metric delivery system Graphite, detailing challenges faced and solutions implemented with Gruffalo as a proxy to manage load and improve availability. It highlights the importance of handling system failures gracefully and the role of back-pressure in maintaining performance under high loads.


![谷歌留痕技术教程[ 𝙩𝙤𝙥 𝟮𝟯𝟯. 𝙘 𝙤𝙢 ]](https://cdn.slidesharecdn.com/ss_thumbnails/top233-260130173900-2eb784f9-thumbnail.jpg?width=640&height=640&fit=bounds)


