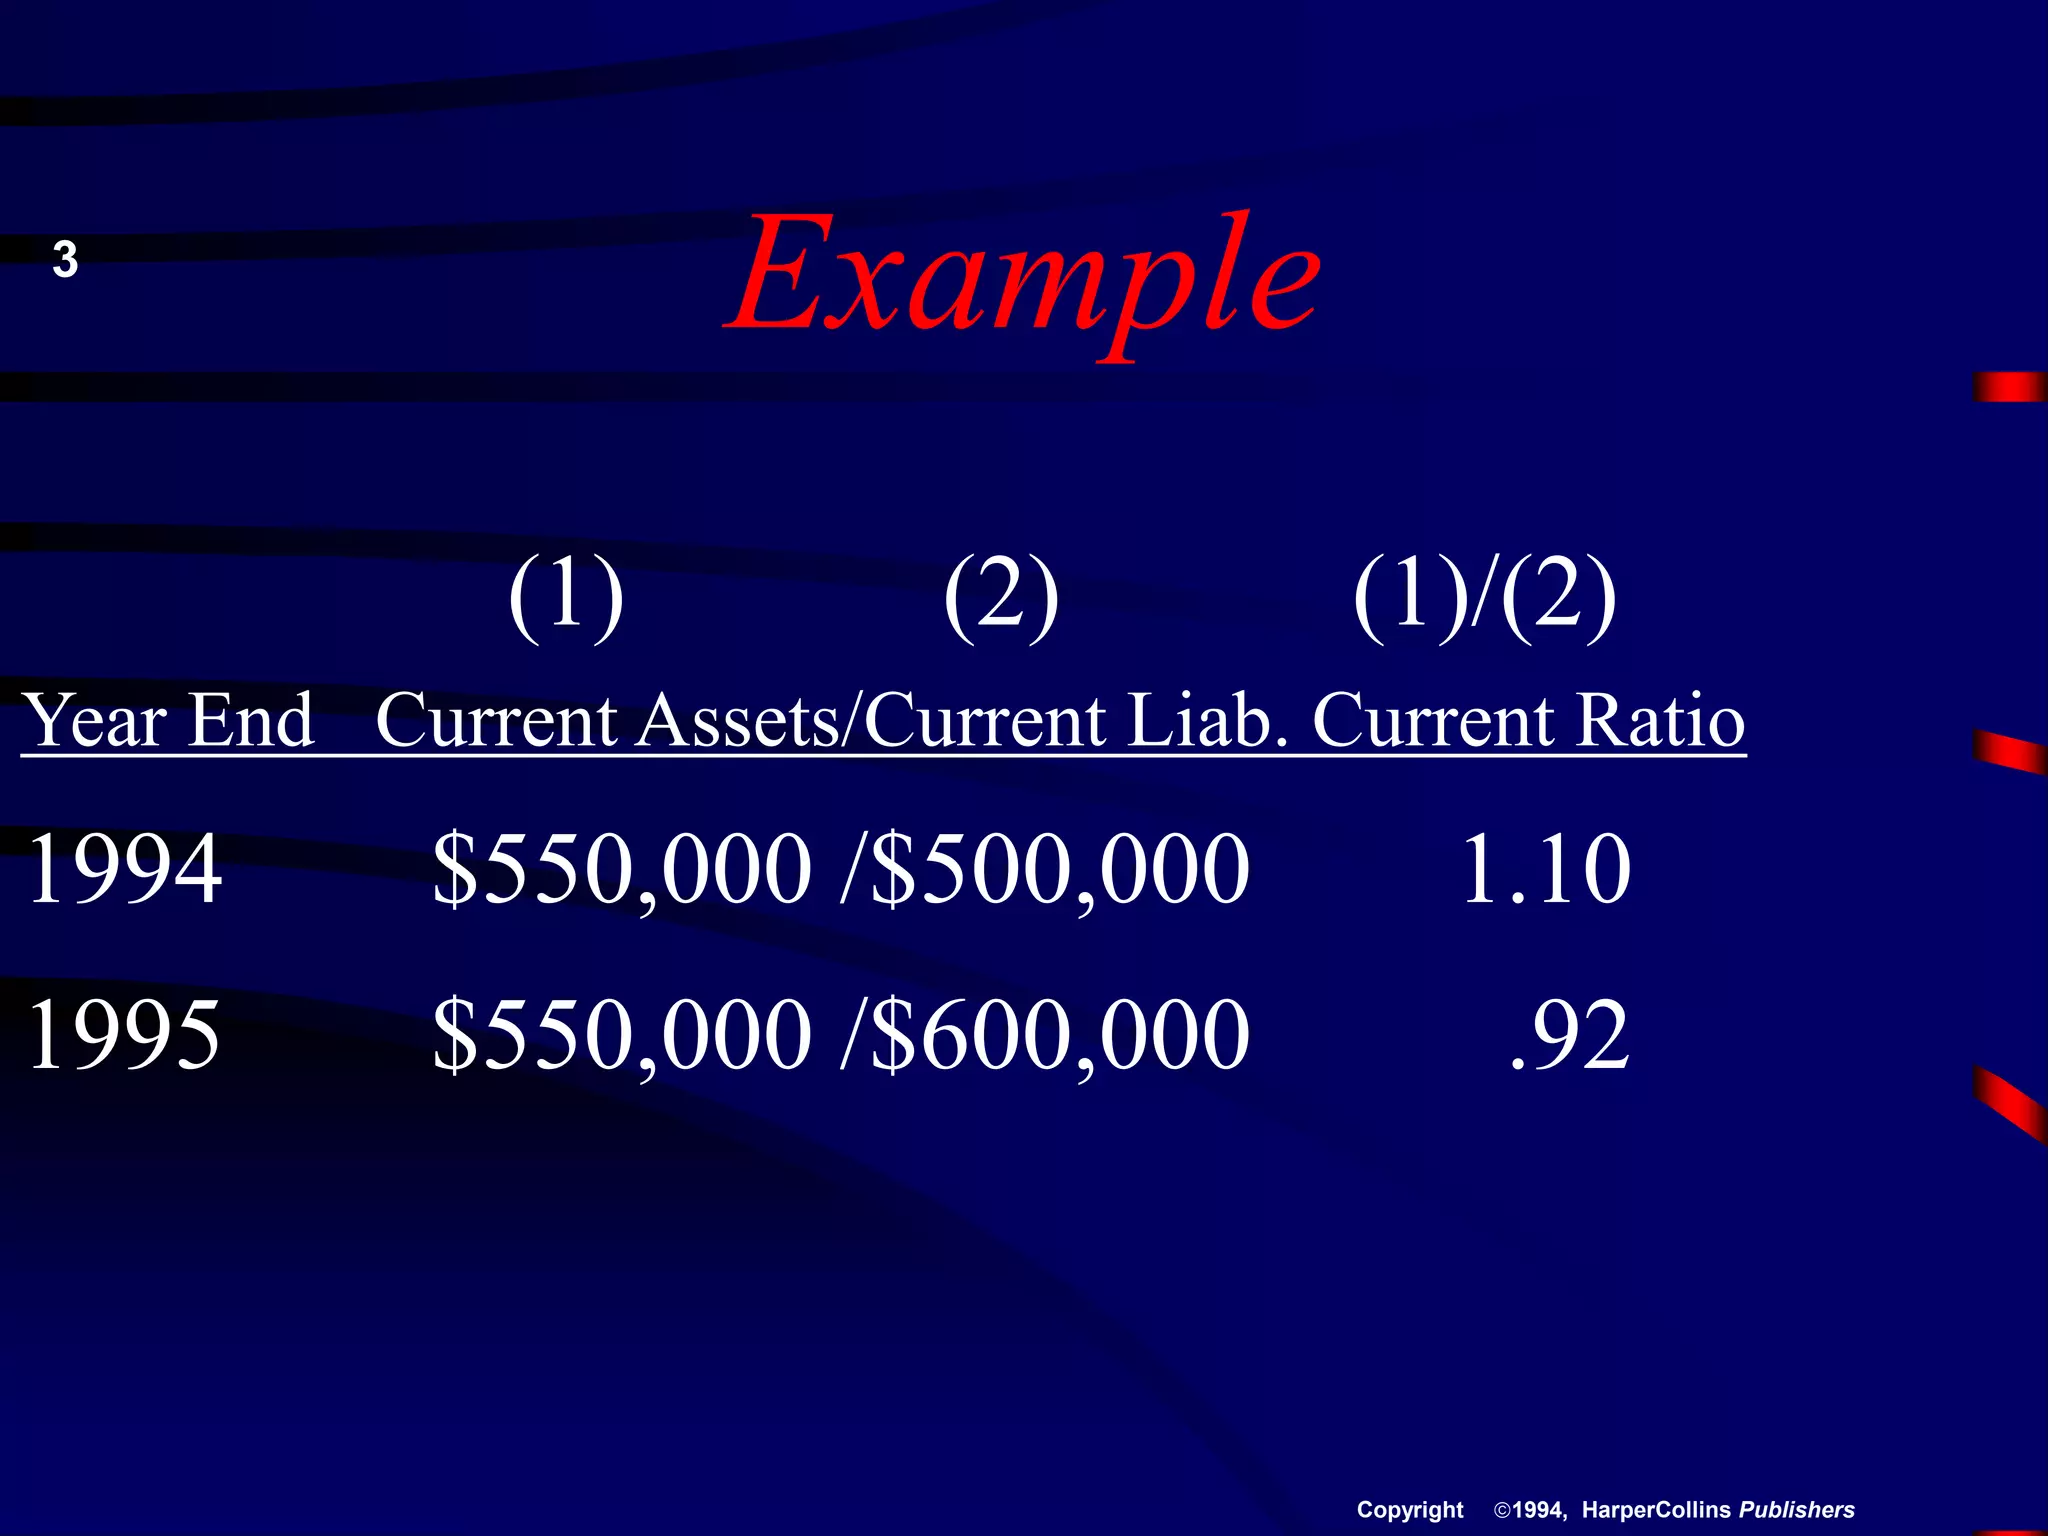
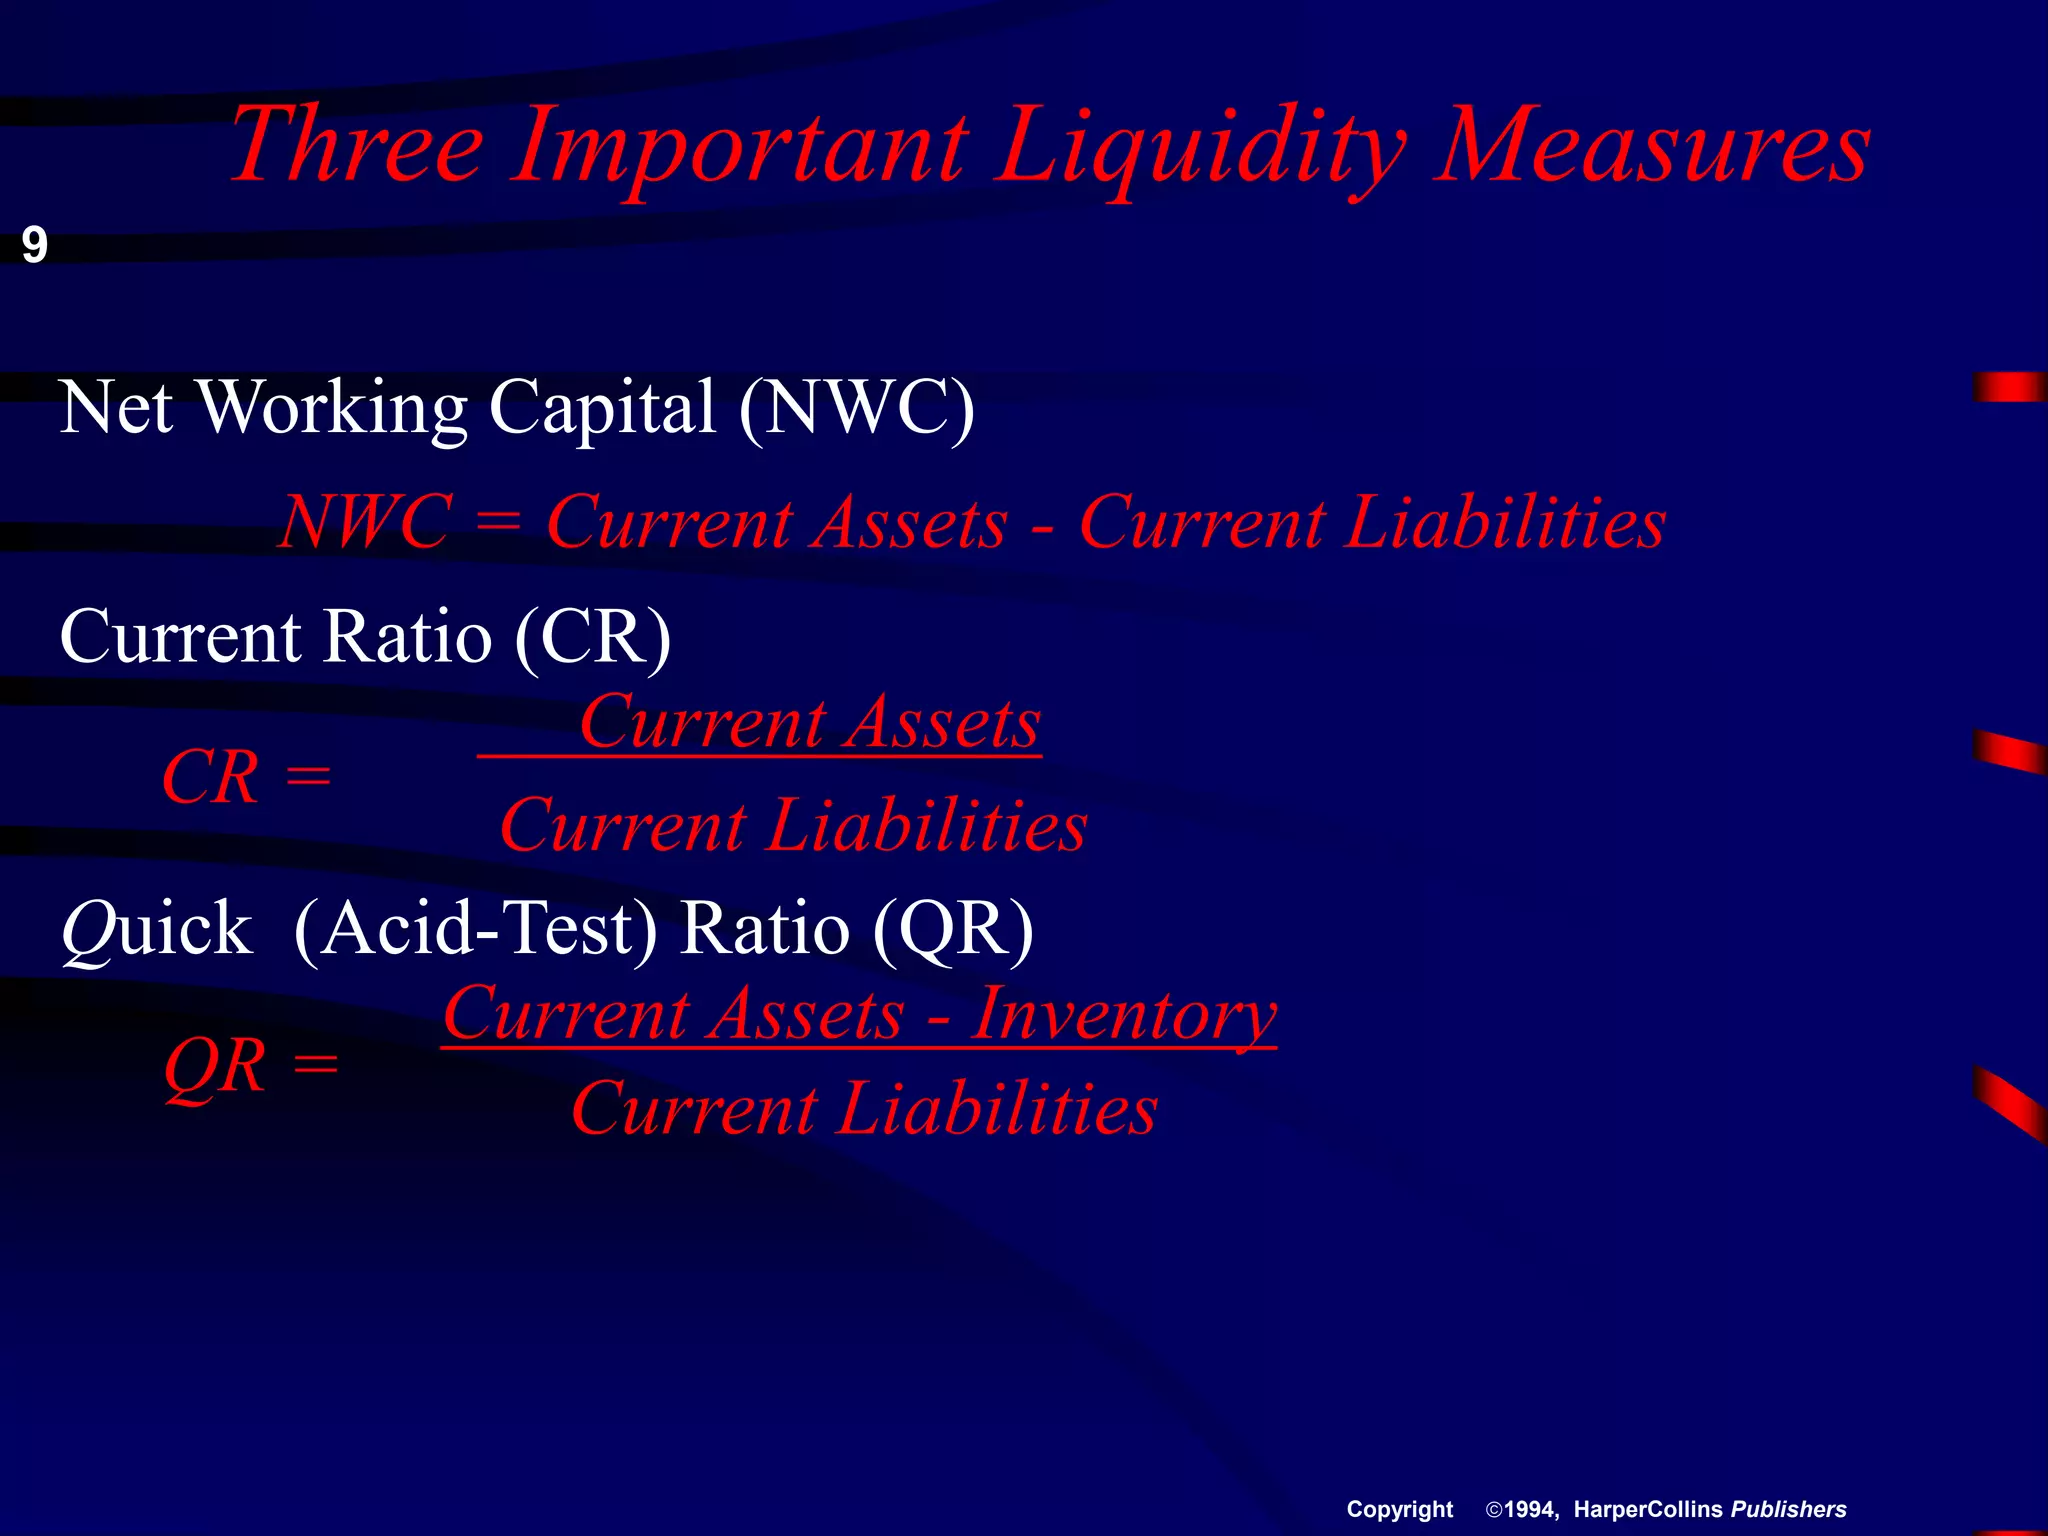
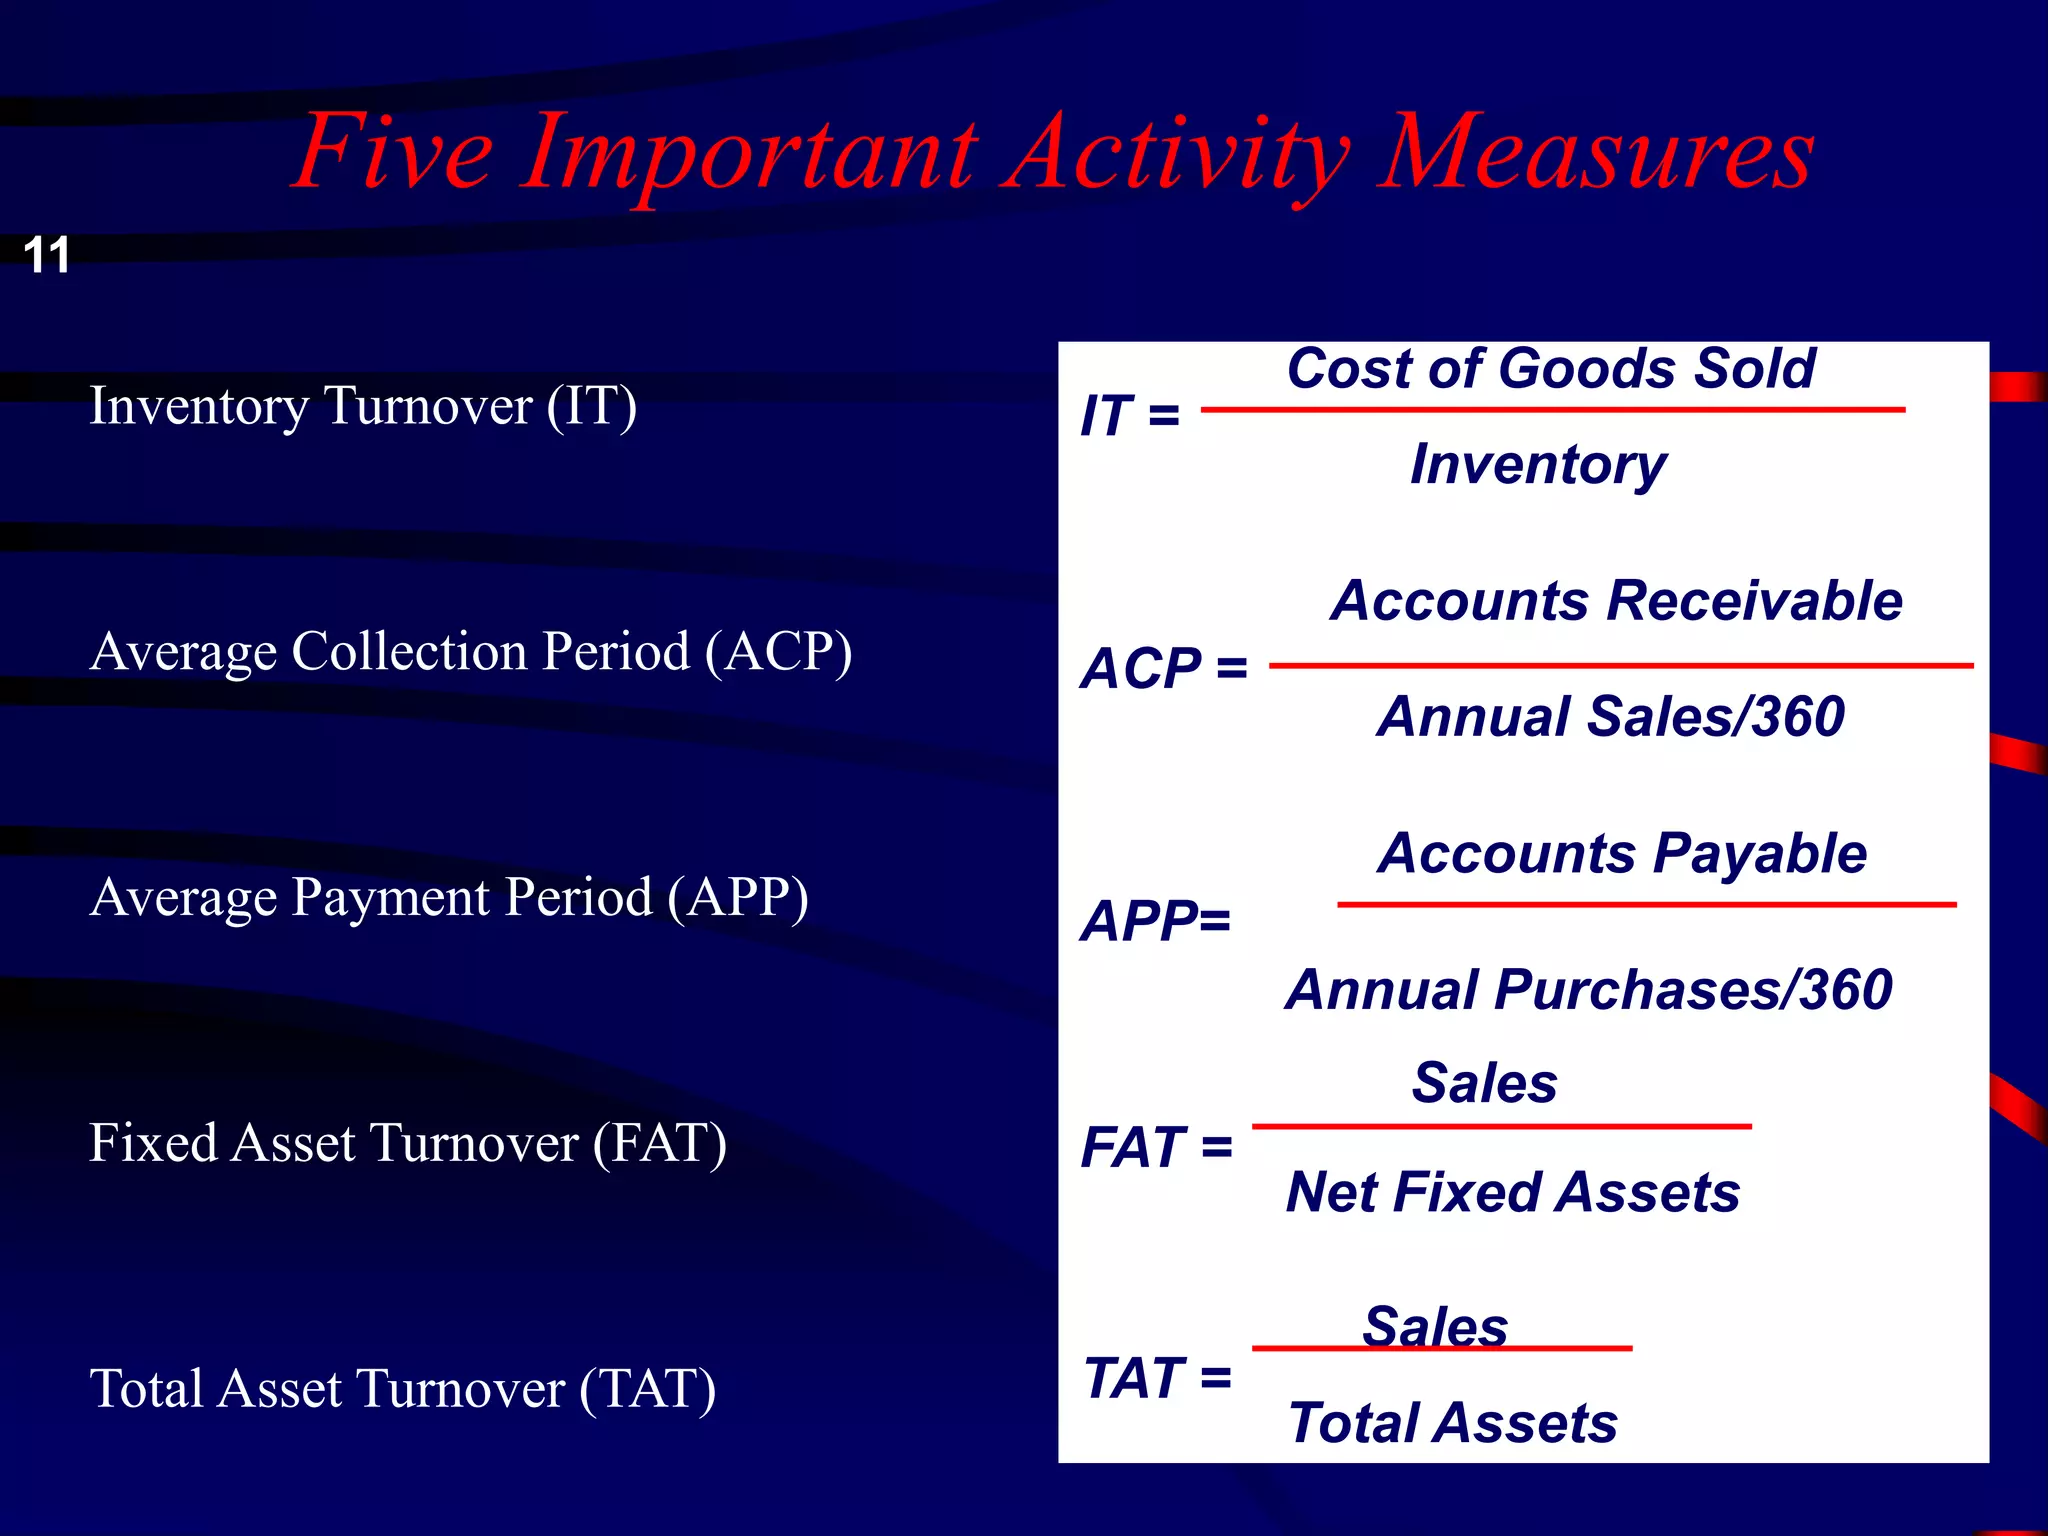
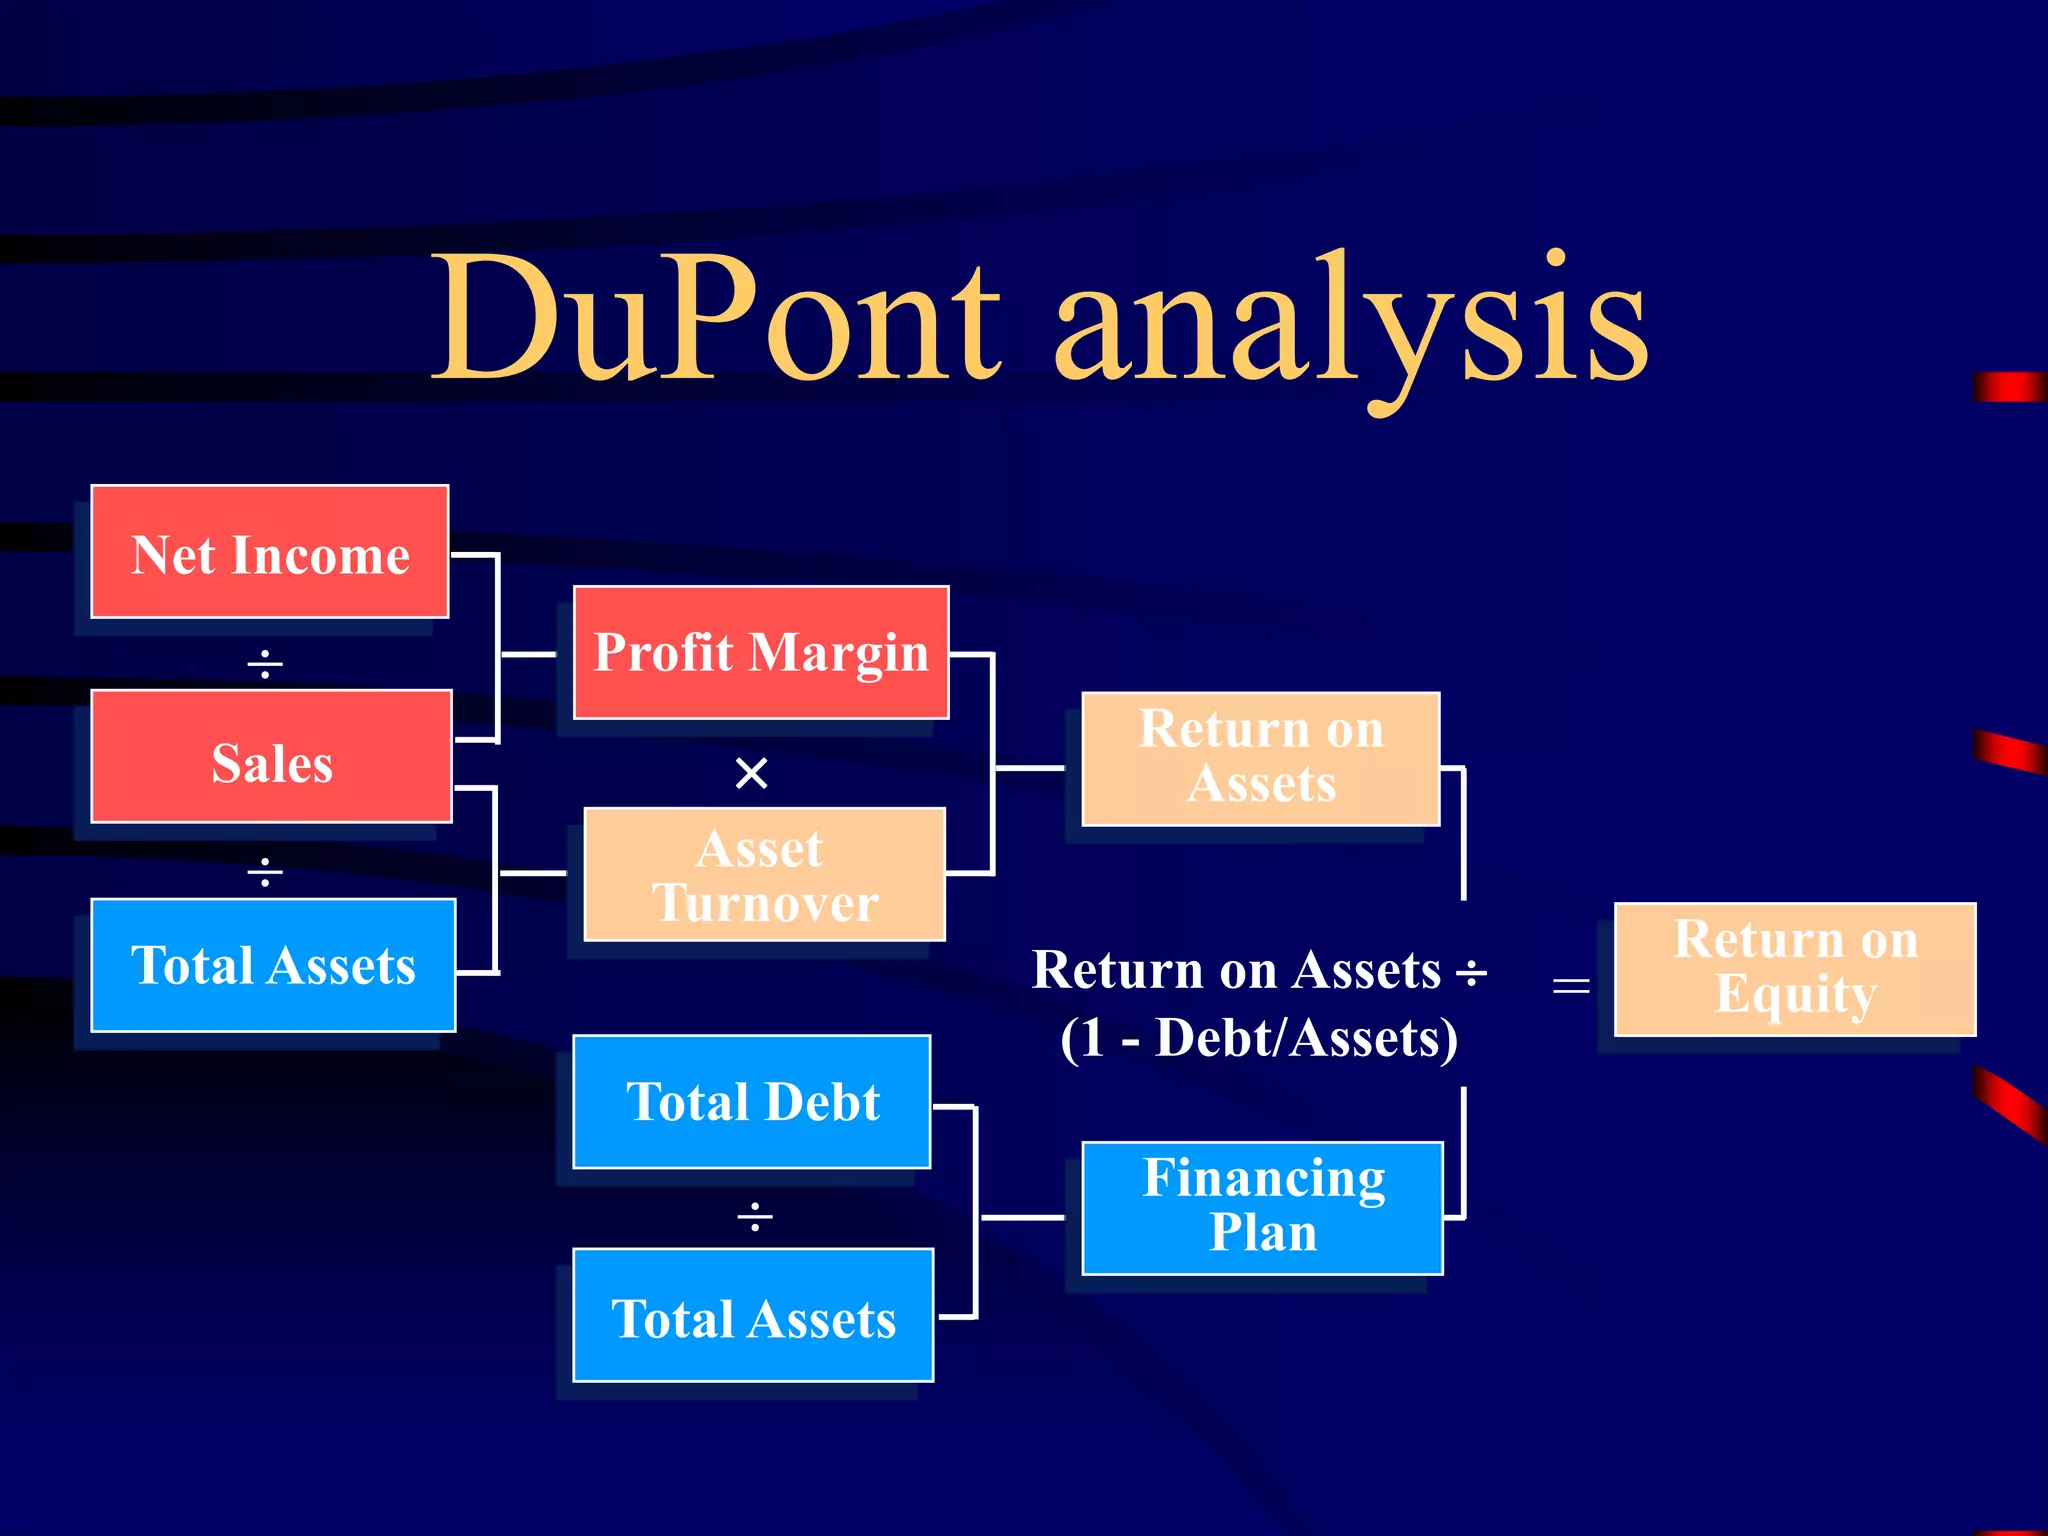
The Analysis of Financial Statements
The Use Of Financial Ratios
Analyzing Liquidity
Analyzing Activity
Analyzing Debt
Analyzing Profitability
A Complete Ratio Analysis
The Analysis of Financial
Statements
THE USE OF FINANCIAL RATIOS
– Financial Ratio are used as a relative measure
that facilitates the evaluation of efficiency or
condition of a particular aspect of a firm's
operations and status
– Ratio Analysis involves methods of
calculating and interpreting financial ratios in
order to assess a firm's performance and status
2
Example
(1) (2) (1)/(2)
Year End Current Assets/Current Liab. Current Ratio
1994 $550,000 /$500,000 1.10
1995 $550,000 /$600,000 .92
3
1994, HarperCollins Publishers
Copyright
Interested Parties
Three sets of parties are interested
in ratio analysis:
Shareholders
Creditors
Management
4
1994, HarperCollins Publishers
Copyright
Types of Ratio Comparisons
There are two types of ratio comparisons
that can be made:
Cross-Sectional Analysis
Time-Series Analysis
– Combined Analysis uses both types of analysis
to assess a firm's trends versus its competitors
or the industry
5
1994, HarperCollins Publishers
Copyright
Time-Series Analysis
Groups of Financial Ratios
Liquidity
Activity
Debt
Profitability
7
1994, HarperCollins Publishers
Copyright
Analyzing Liquidity
Liquidity refers to the solvency of the
firm's overall financial position, i.e. a
"liquid firm" is one that can easily meet
its short-term obligations as they come
due.
A second meaning includes the concept of
converting an asset into cash with little or
no loss in value.
8
1994, HarperCollins Publishers
Copyright
Three Important Liquidity Measures
Net Working Capital (NWC)
NWC = Current Assets - Current Liabilities
Current Ratio (CR)
Current Assets
CR =
Current Liabilities
Quick (Acid-Test) Ratio (QR)
Current Assets - Inventory
QR =
Current Liabilities
9
1994, HarperCollins Publishers
Copyright
Analyzing Activity
Activity is a more sophisticated
analysis of a firm's liquidity,
evaluating the speed with which
certain accounts are converted into
sales or cash; also measures a firm's
efficiency
10
1994, HarperCollins Publishers
Copyright
Inventory Turnover (IT)
Average Collection Period (ACP)
Average Payment Period (APP)
Fixed Asset Turnover (FAT)
Total Asset Turnover (TAT)
Cost of Goods Sold
IT =
Inventory
Accounts Receivable
ACP =
Annual Sales/360
Accounts Payable
APP=
Annual Purchases/360
Sales
FAT =
Net Fixed Assets
Sales
TAT =
Total Assets
Five Important Activity Measures
11
Analyzing Debt
Debt is a true "double-edged" sword as it allows
for the generation of profits with the use of other
people's (creditors) money, but creates claims on
earnings with a higher priority than those of the
firm's owners.
Financial Leverage is a term used to describe the
magnification of risk and return resulting from
the use of fixed-cost financing such as debt and
preferred stock.
12
Prof. Kuhle
Debt Ratio
(DR)
Debt-Equity Ratio
(DER)
Times Interest Earned
Ratio (TIE)
Fixed Payment Coverage Ratio
(FPC)
Total Liabilities
DR=
Total Assets
Long-Term Debt
DER=
Stockholders’ Equity
Earnings Before Interest
& Taxes (EBIT)
TIE=
Interest
Earnings Before Interest &
Taxes + Lease Payments
FPC=
Interest + Lease Payments
+{(Principal Payments +
Preferred Stock
Dividends) X [1 / (1 -T)]}
Four Important Debt Measures
14
Analyzing Profitability
– Profitability Measures assess the firm's ability
to operate efficiently and are of concern to
owners, creditors, and management
– A Common-Size Income Statement, which
expresses each income statement item as a
percentage of sales, allows for easy evaluation
of the firm’s profitability relative to sales.
15
Gross Profit Margin (GPM)
Operating Profit Margin
(OPM)
Net Profit Margin (NPM)
Return on Total Assets
(ROA)
Return On Equity (ROE)
Earnings Per Share (EPS)
Price/Earnings (P/E) Ratio
Gross Profits
GPM=
Sales
Operating Profits (EBIT)
OPM =
Sales
Net Profit After Taxes
NPM=
Sales
Net Profit After Taxes
ROA=
Total Assets
Net Profit After Taxes
ROE=
Stockholders’ Equity
Earnings Available for
Common Stockholder’s
EPS =
Number of Shares of Common
Stock Outstanding
Market Price Per Share of
Common Stock
P/E =
Earnings Per Share
Seven Basic Profitability Measures
16
A Complete Ratio Analysis
DuPont System of Analysis
– DuPont System of Analysis is an integrative
approach used to dissect a firm's financial
statements and assess its financial condition
– It ties together the income statement and
balance sheet to determine two summary
measures of profitability, namely ROA and
ROE
17



DuPont analysis
Net Income
Sales
Total Assets
Profit Margin
Asset
Turnover
Total Debt
Total Assets
Return on
Assets
Financing
Plan
Return on
Equity
Return on Assets 
(1 - Debt/Assets)
=

DuPont System of Analysis
The firm's return is broken into three
components:
–A profitability measure (net profit margin)
–An efficiency measure(total asset turnover)
–A leverage measure (financial leverage
multiplier)
18

ratioAnal.ppt

  • 1.
    The Analysis ofFinancial Statements The Use Of Financial Ratios Analyzing Liquidity Analyzing Activity Analyzing Debt Analyzing Profitability A Complete Ratio Analysis
  • 2.
    The Analysis ofFinancial Statements THE USE OF FINANCIAL RATIOS – Financial Ratio are used as a relative measure that facilitates the evaluation of efficiency or condition of a particular aspect of a firm's operations and status – Ratio Analysis involves methods of calculating and interpreting financial ratios in order to assess a firm's performance and status 2
  • 3.
    Example (1) (2) (1)/(2) YearEnd Current Assets/Current Liab. Current Ratio 1994 $550,000 /$500,000 1.10 1995 $550,000 /$600,000 .92 3 1994, HarperCollins Publishers Copyright
  • 4.
    Interested Parties Three setsof parties are interested in ratio analysis: Shareholders Creditors Management 4 1994, HarperCollins Publishers Copyright
  • 5.
    Types of RatioComparisons There are two types of ratio comparisons that can be made: Cross-Sectional Analysis Time-Series Analysis – Combined Analysis uses both types of analysis to assess a firm's trends versus its competitors or the industry 5 1994, HarperCollins Publishers Copyright
  • 6.
  • 7.
    Groups of FinancialRatios Liquidity Activity Debt Profitability 7 1994, HarperCollins Publishers Copyright
  • 8.
    Analyzing Liquidity Liquidity refersto the solvency of the firm's overall financial position, i.e. a "liquid firm" is one that can easily meet its short-term obligations as they come due. A second meaning includes the concept of converting an asset into cash with little or no loss in value. 8 1994, HarperCollins Publishers Copyright
  • 9.
    Three Important LiquidityMeasures Net Working Capital (NWC) NWC = Current Assets - Current Liabilities Current Ratio (CR) Current Assets CR = Current Liabilities Quick (Acid-Test) Ratio (QR) Current Assets - Inventory QR = Current Liabilities 9 1994, HarperCollins Publishers Copyright
  • 10.
    Analyzing Activity Activity isa more sophisticated analysis of a firm's liquidity, evaluating the speed with which certain accounts are converted into sales or cash; also measures a firm's efficiency 10 1994, HarperCollins Publishers Copyright
  • 11.
    Inventory Turnover (IT) AverageCollection Period (ACP) Average Payment Period (APP) Fixed Asset Turnover (FAT) Total Asset Turnover (TAT) Cost of Goods Sold IT = Inventory Accounts Receivable ACP = Annual Sales/360 Accounts Payable APP= Annual Purchases/360 Sales FAT = Net Fixed Assets Sales TAT = Total Assets Five Important Activity Measures 11
  • 12.
    Analyzing Debt Debt isa true "double-edged" sword as it allows for the generation of profits with the use of other people's (creditors) money, but creates claims on earnings with a higher priority than those of the firm's owners. Financial Leverage is a term used to describe the magnification of risk and return resulting from the use of fixed-cost financing such as debt and preferred stock. 12 Prof. Kuhle
  • 13.
    Debt Ratio (DR) Debt-Equity Ratio (DER) TimesInterest Earned Ratio (TIE) Fixed Payment Coverage Ratio (FPC) Total Liabilities DR= Total Assets Long-Term Debt DER= Stockholders’ Equity Earnings Before Interest & Taxes (EBIT) TIE= Interest Earnings Before Interest & Taxes + Lease Payments FPC= Interest + Lease Payments +{(Principal Payments + Preferred Stock Dividends) X [1 / (1 -T)]} Four Important Debt Measures 14
  • 14.
    Analyzing Profitability – ProfitabilityMeasures assess the firm's ability to operate efficiently and are of concern to owners, creditors, and management – A Common-Size Income Statement, which expresses each income statement item as a percentage of sales, allows for easy evaluation of the firm’s profitability relative to sales. 15
  • 15.
    Gross Profit Margin(GPM) Operating Profit Margin (OPM) Net Profit Margin (NPM) Return on Total Assets (ROA) Return On Equity (ROE) Earnings Per Share (EPS) Price/Earnings (P/E) Ratio Gross Profits GPM= Sales Operating Profits (EBIT) OPM = Sales Net Profit After Taxes NPM= Sales Net Profit After Taxes ROA= Total Assets Net Profit After Taxes ROE= Stockholders’ Equity Earnings Available for Common Stockholder’s EPS = Number of Shares of Common Stock Outstanding Market Price Per Share of Common Stock P/E = Earnings Per Share Seven Basic Profitability Measures 16
  • 16.
    A Complete RatioAnalysis DuPont System of Analysis – DuPont System of Analysis is an integrative approach used to dissect a firm's financial statements and assess its financial condition – It ties together the income statement and balance sheet to determine two summary measures of profitability, namely ROA and ROE 17
  • 17.
       DuPont analysis Net Income Sales TotalAssets Profit Margin Asset Turnover Total Debt Total Assets Return on Assets Financing Plan Return on Equity Return on Assets  (1 - Debt/Assets) = 
  • 19.
    DuPont System ofAnalysis The firm's return is broken into three components: –A profitability measure (net profit margin) –An efficiency measure(total asset turnover) –A leverage measure (financial leverage multiplier) 18