Download to read offline


![Speed up the RGB Strip Software
The RGB python code is a bit slow at the time of this writing, but a few tweaks can
dramatically speed it up.
First edit ledstrip.py to use the hardware SPI, note the argument use_py_spi = True.
My ledstrip.py was located at /home/pi/RPi-LPD8806/raspledstrip/ledstrip.py
Now inside LPD8806.py, we're going to change the SPI speed to 16MHz.
That print statement is there just to make sure everything gets set correctly.
One final change to the LPD8806.py file is in the update() function. Every call to
self.spi.xfer2() seems to have a 160ms delay at the end, so we're simply going to change
the update function so that it calls the spi.xfer2() fewer times.
If you re-run the example.py python file, you should see a substantial increase in speed.
def __init__(self, leds, use_py_spi = True, dev="/dev/spidev0.0", driver="LPD8806"):
if self.use_py_spi:
import spidev
self.spi = spidev.SpiDev()
self.spi.open(0,0)
self.spi.max_speed_hz = 16000000
print 'py-spidev MHz: %d' % (self.spi.max_speed_hz / 1000000.0 )
def update(self, buffer):
temp_buffer = []
if self.use_py_spi:
for x in range(self.leds):
temp_buffer = temp_buffer + [i for i in buffer[x]]
#self.spi.xfer2([i for i in buffer[x]])
self.spi.xfer2(temp_buffer)
self.spi.xfer2([0x00,0x00,0x00]) #zero fill the last to prevent stray colors at the end
self.spi.xfer2([0x00]) #once more with feeling - this helps :) time2 = time.time()
© Adafruit
Industries
https://learn.adafruit.com/raspberry-pi-spectrum-analyzer-display-on-
rgb-led-strip
Page 12 of 14](https://image.slidesharecdn.com/raspberry-pi-spectrum-analyzer-display-on-rgb-led-strip-170121102324/85/Raspberry-pi-spectrum-analyzer-display-on-rgb-led-strip-12-320.jpg)


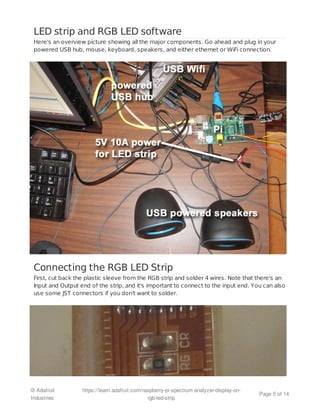
This document provides instructions for building a Raspberry Pi LED spectrum analyzer that visualizes music playing through color changes on an RGB LED strip. The project uses a Raspberry Pi, RGB LED strip, audio processing software, and custom Python code to analyze the frequency spectrum of an audio file in real-time and map the low, mid, and high frequencies to color changes on the LED strip. The instructions guide the reader through connecting the hardware, installing and optimizing software to control the LED strip quickly, and customizing existing RGB light show software to drive the LED visualization.


![[Forward4 Webinar 2016] Building IoT Prototypes w/ Raspberry Pi](https://cdn.slidesharecdn.com/ss_thumbnails/raspberrypiwebinar-171022063713-thumbnail.jpg?width=640&height=640&fit=bounds)


![[Deck] What's New in Spark-Iceberg Integration via DSV2.pptx](https://cdn.slidesharecdn.com/ss_thumbnails/deckwhatsnewinspark-icebergintegrationviadsv2-260210005337-25955b12-thumbnail.jpg?width=640&height=640&fit=bounds)


