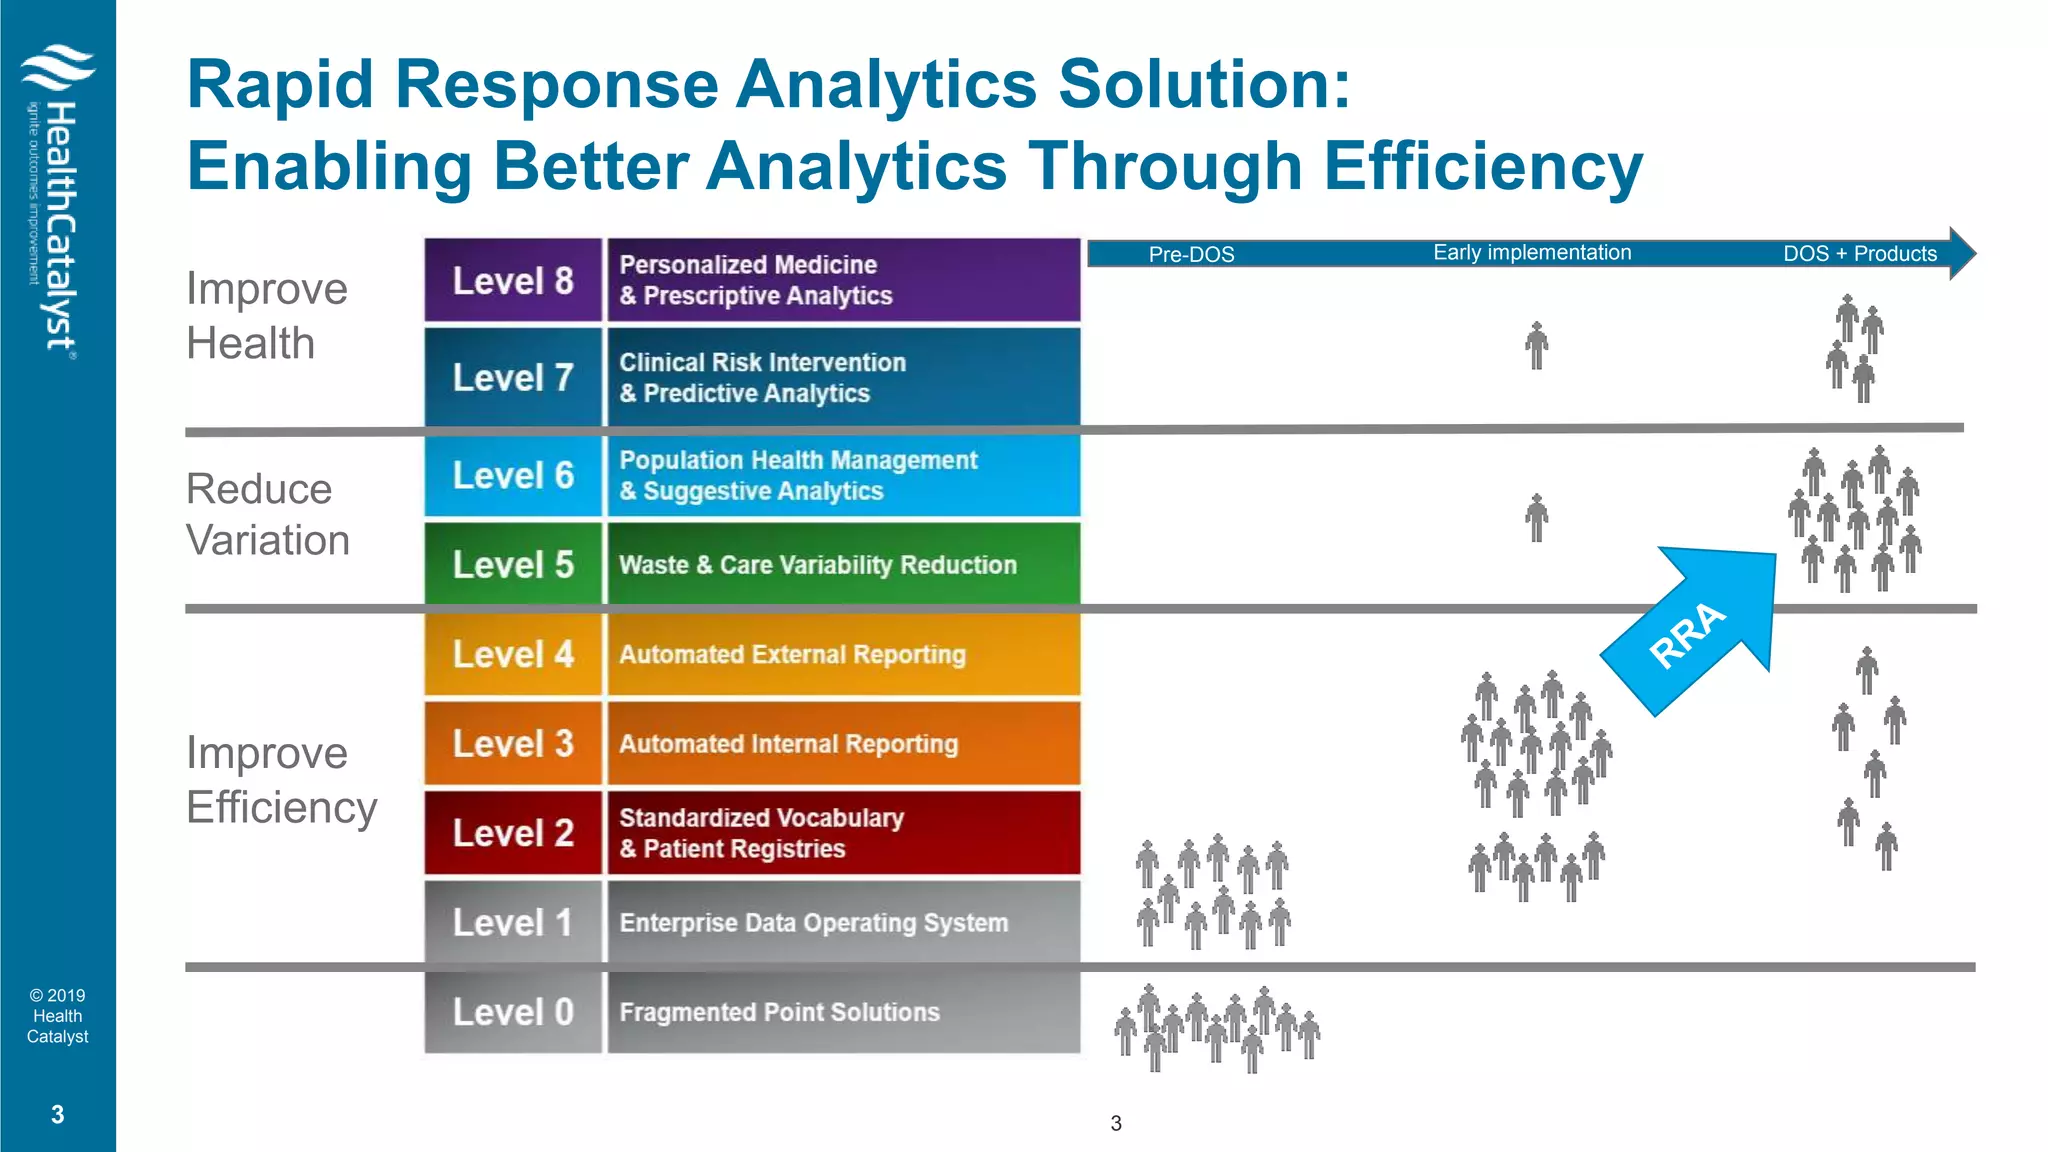
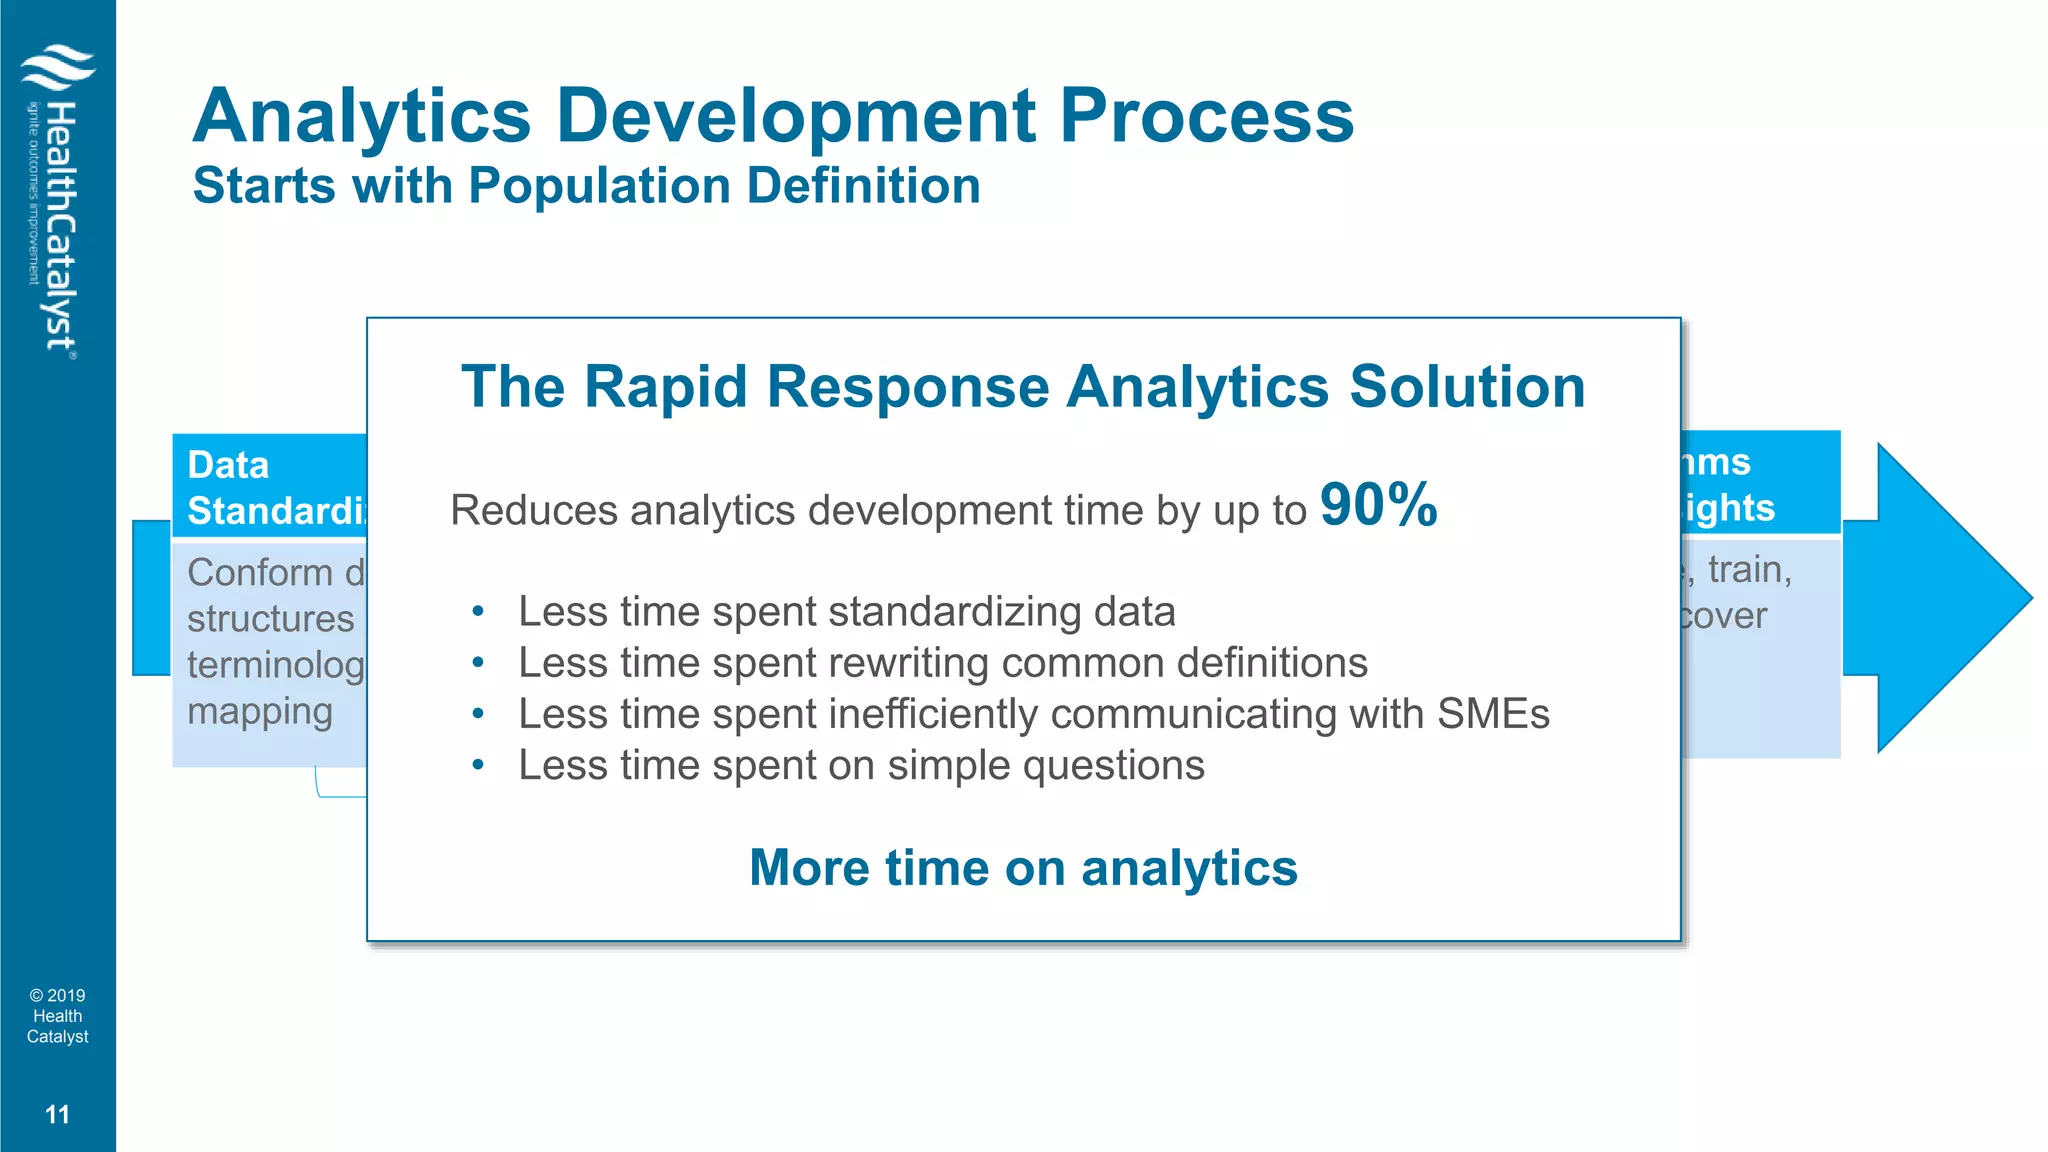
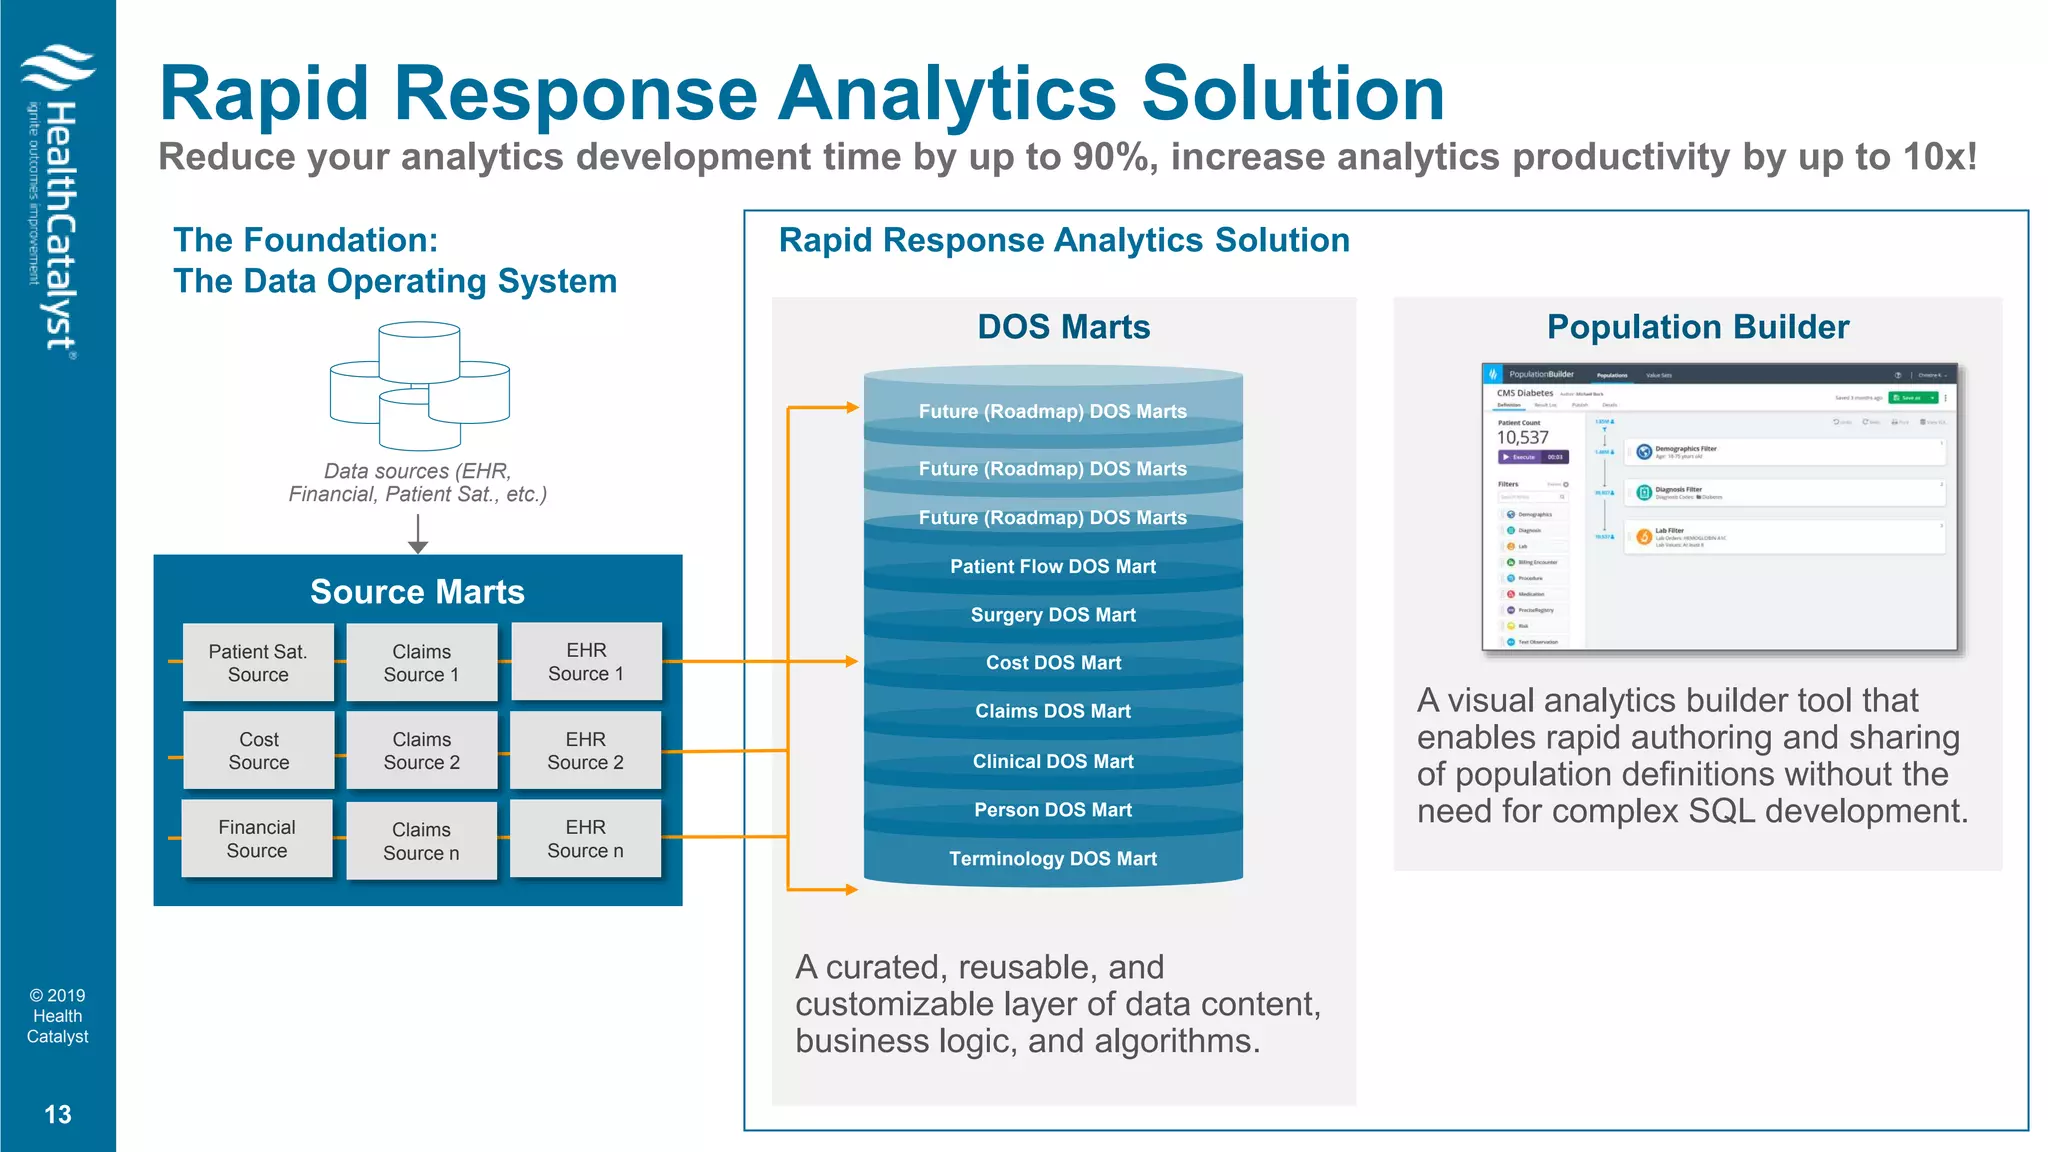
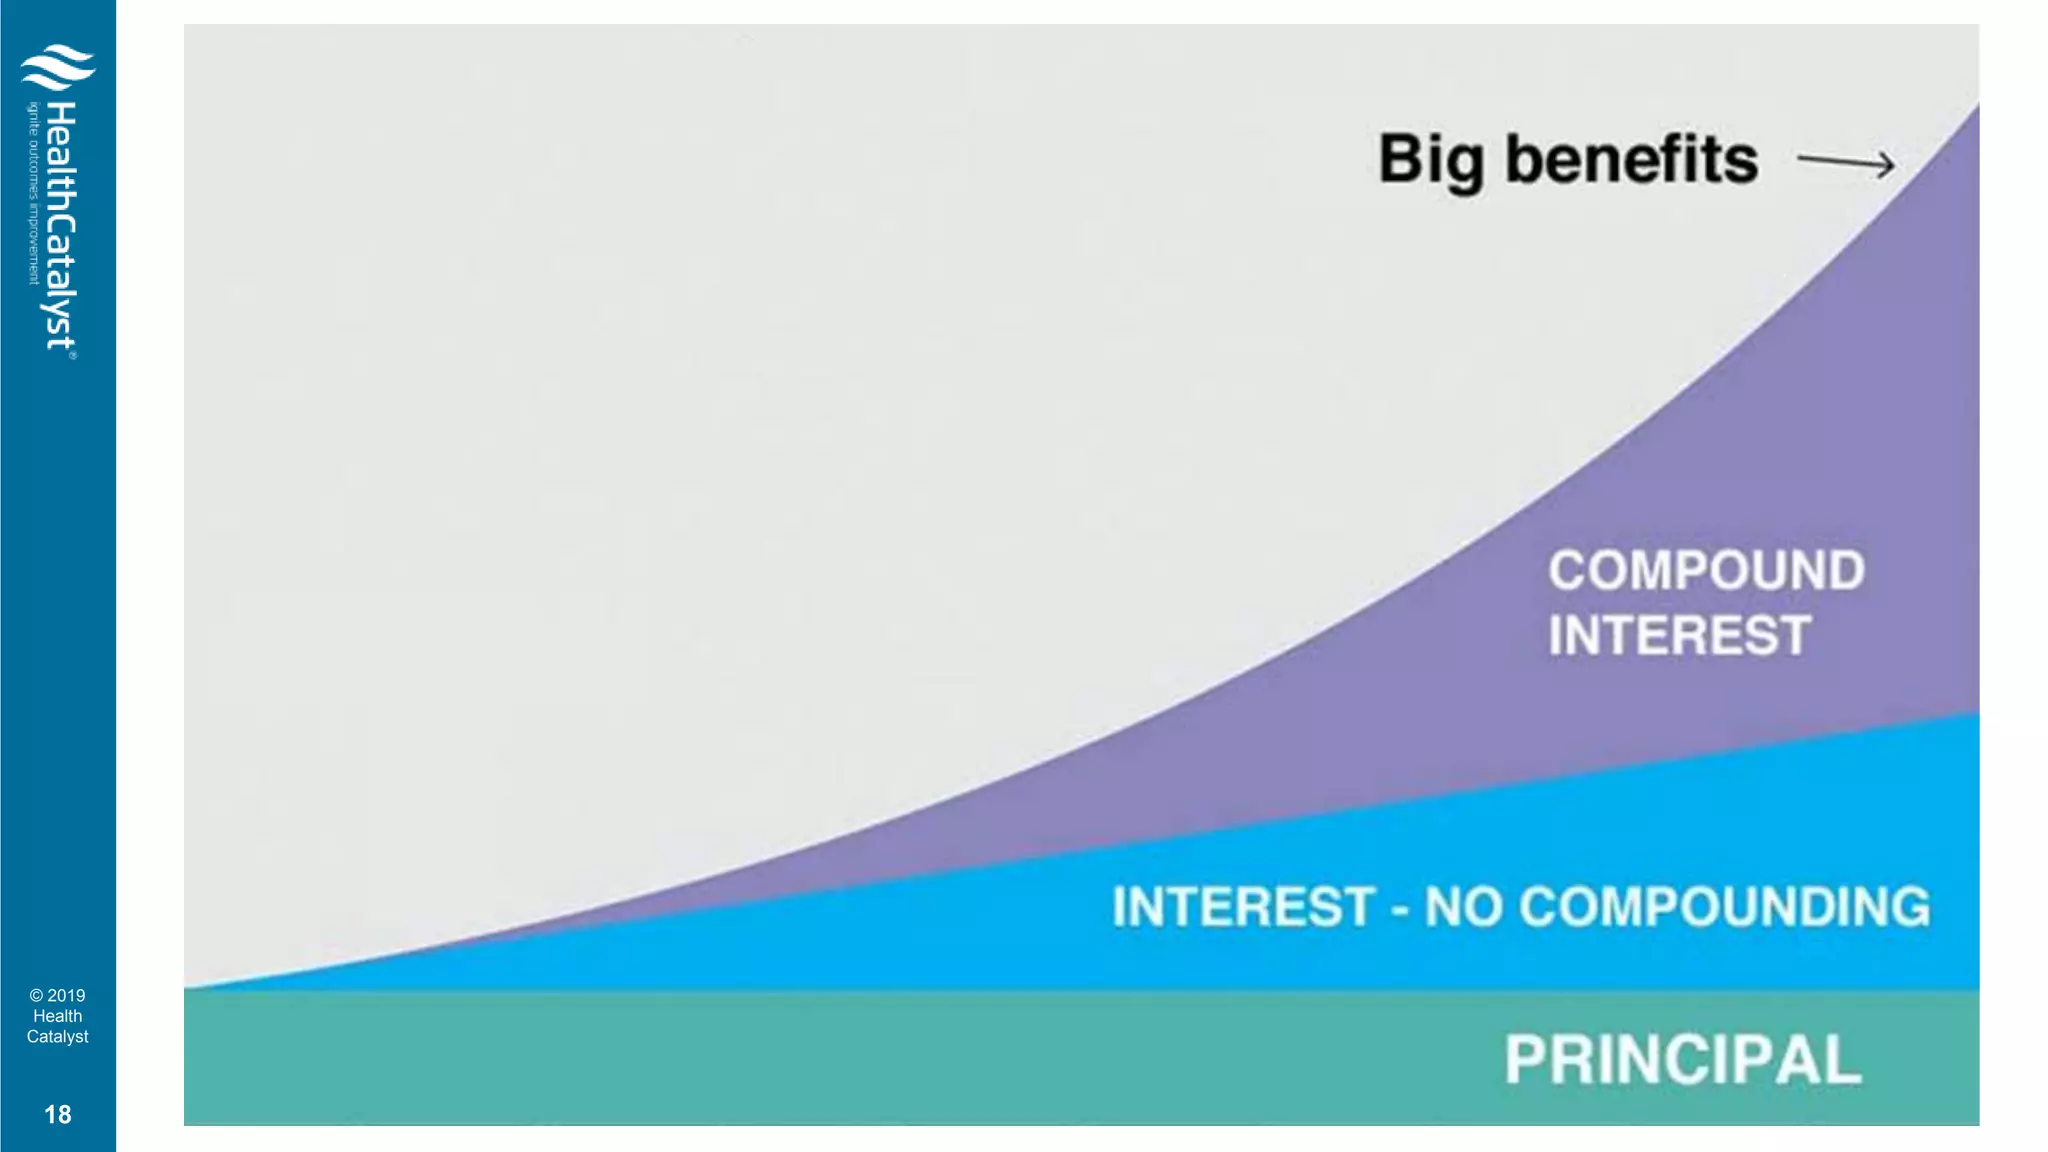
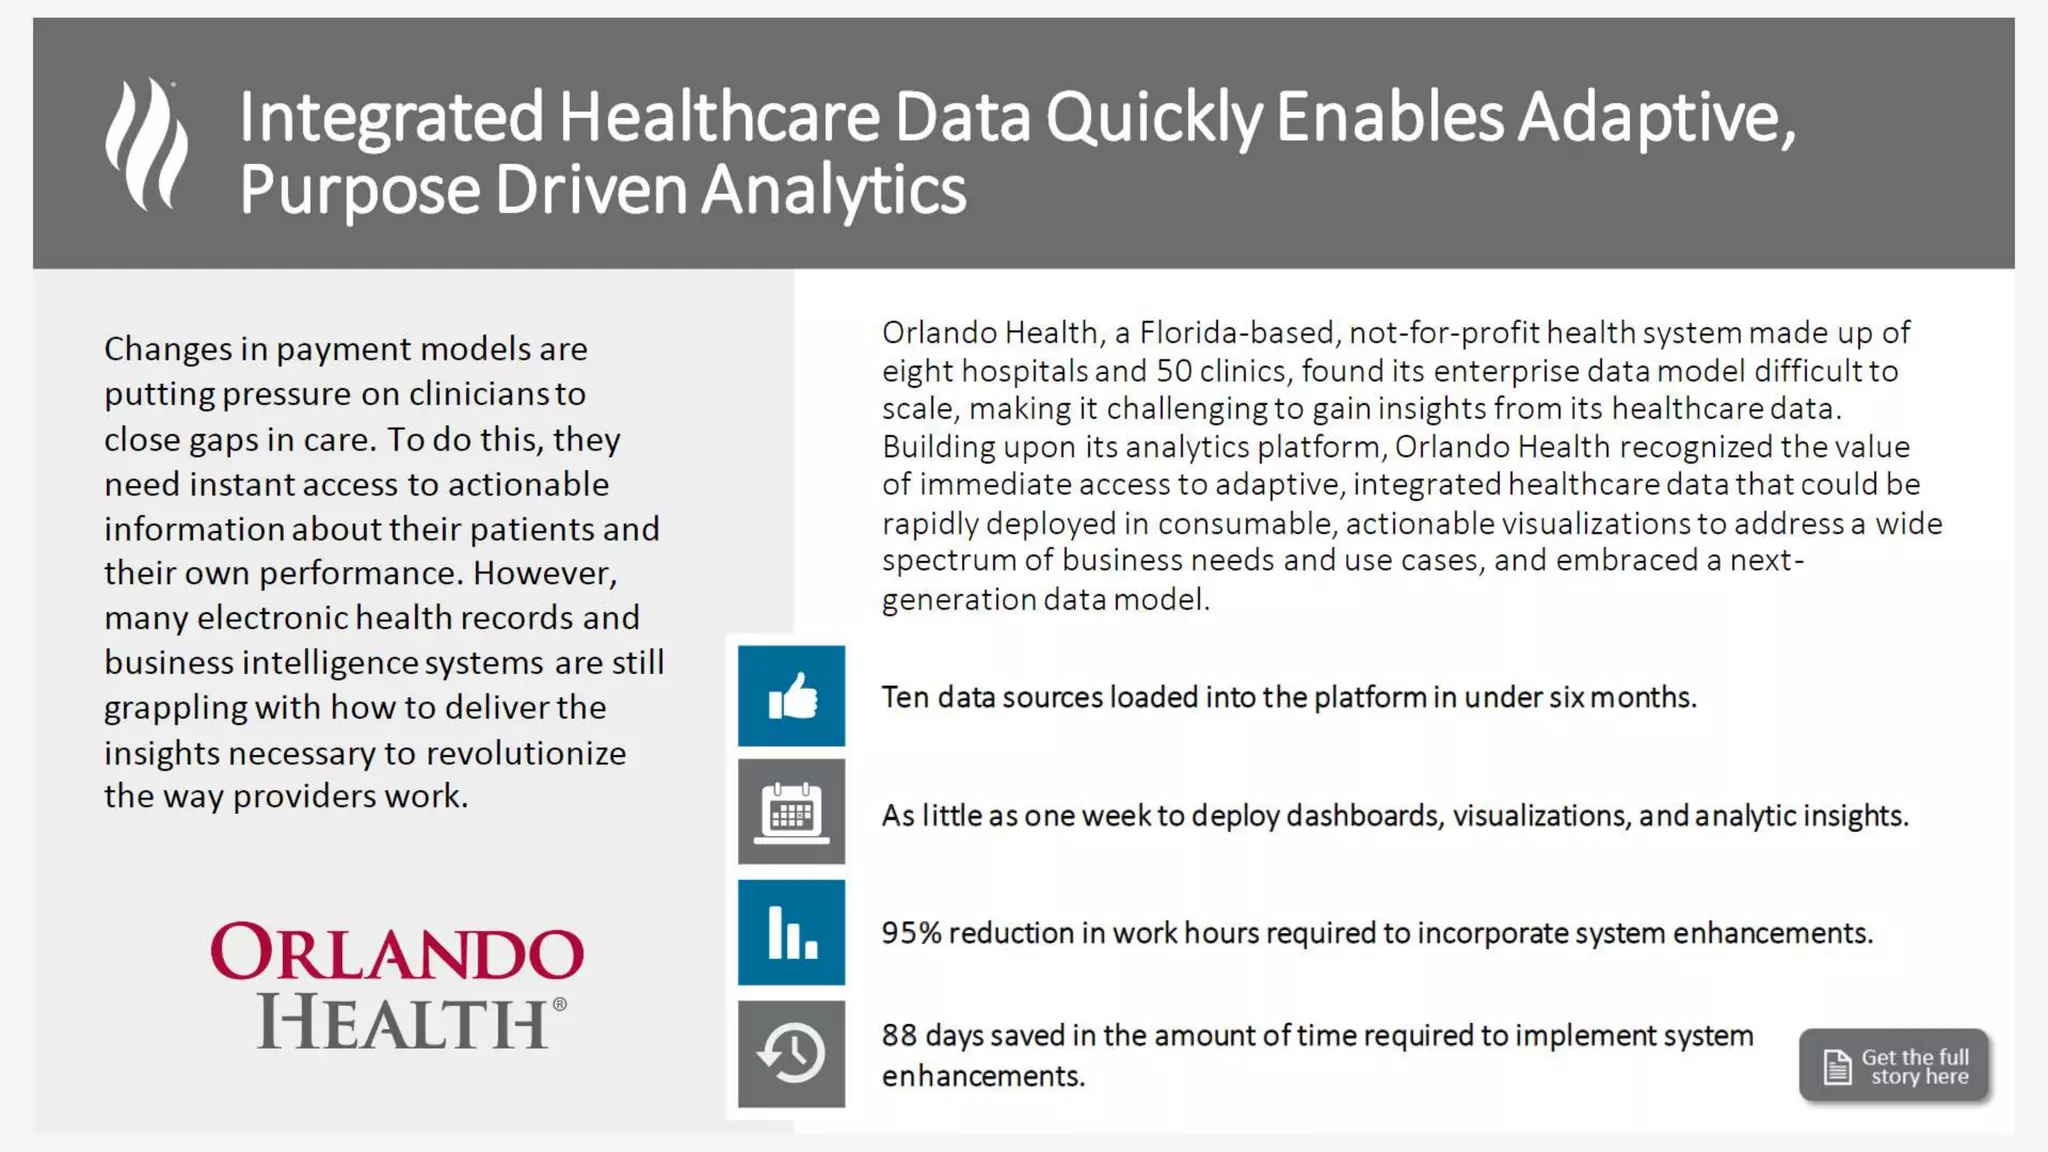
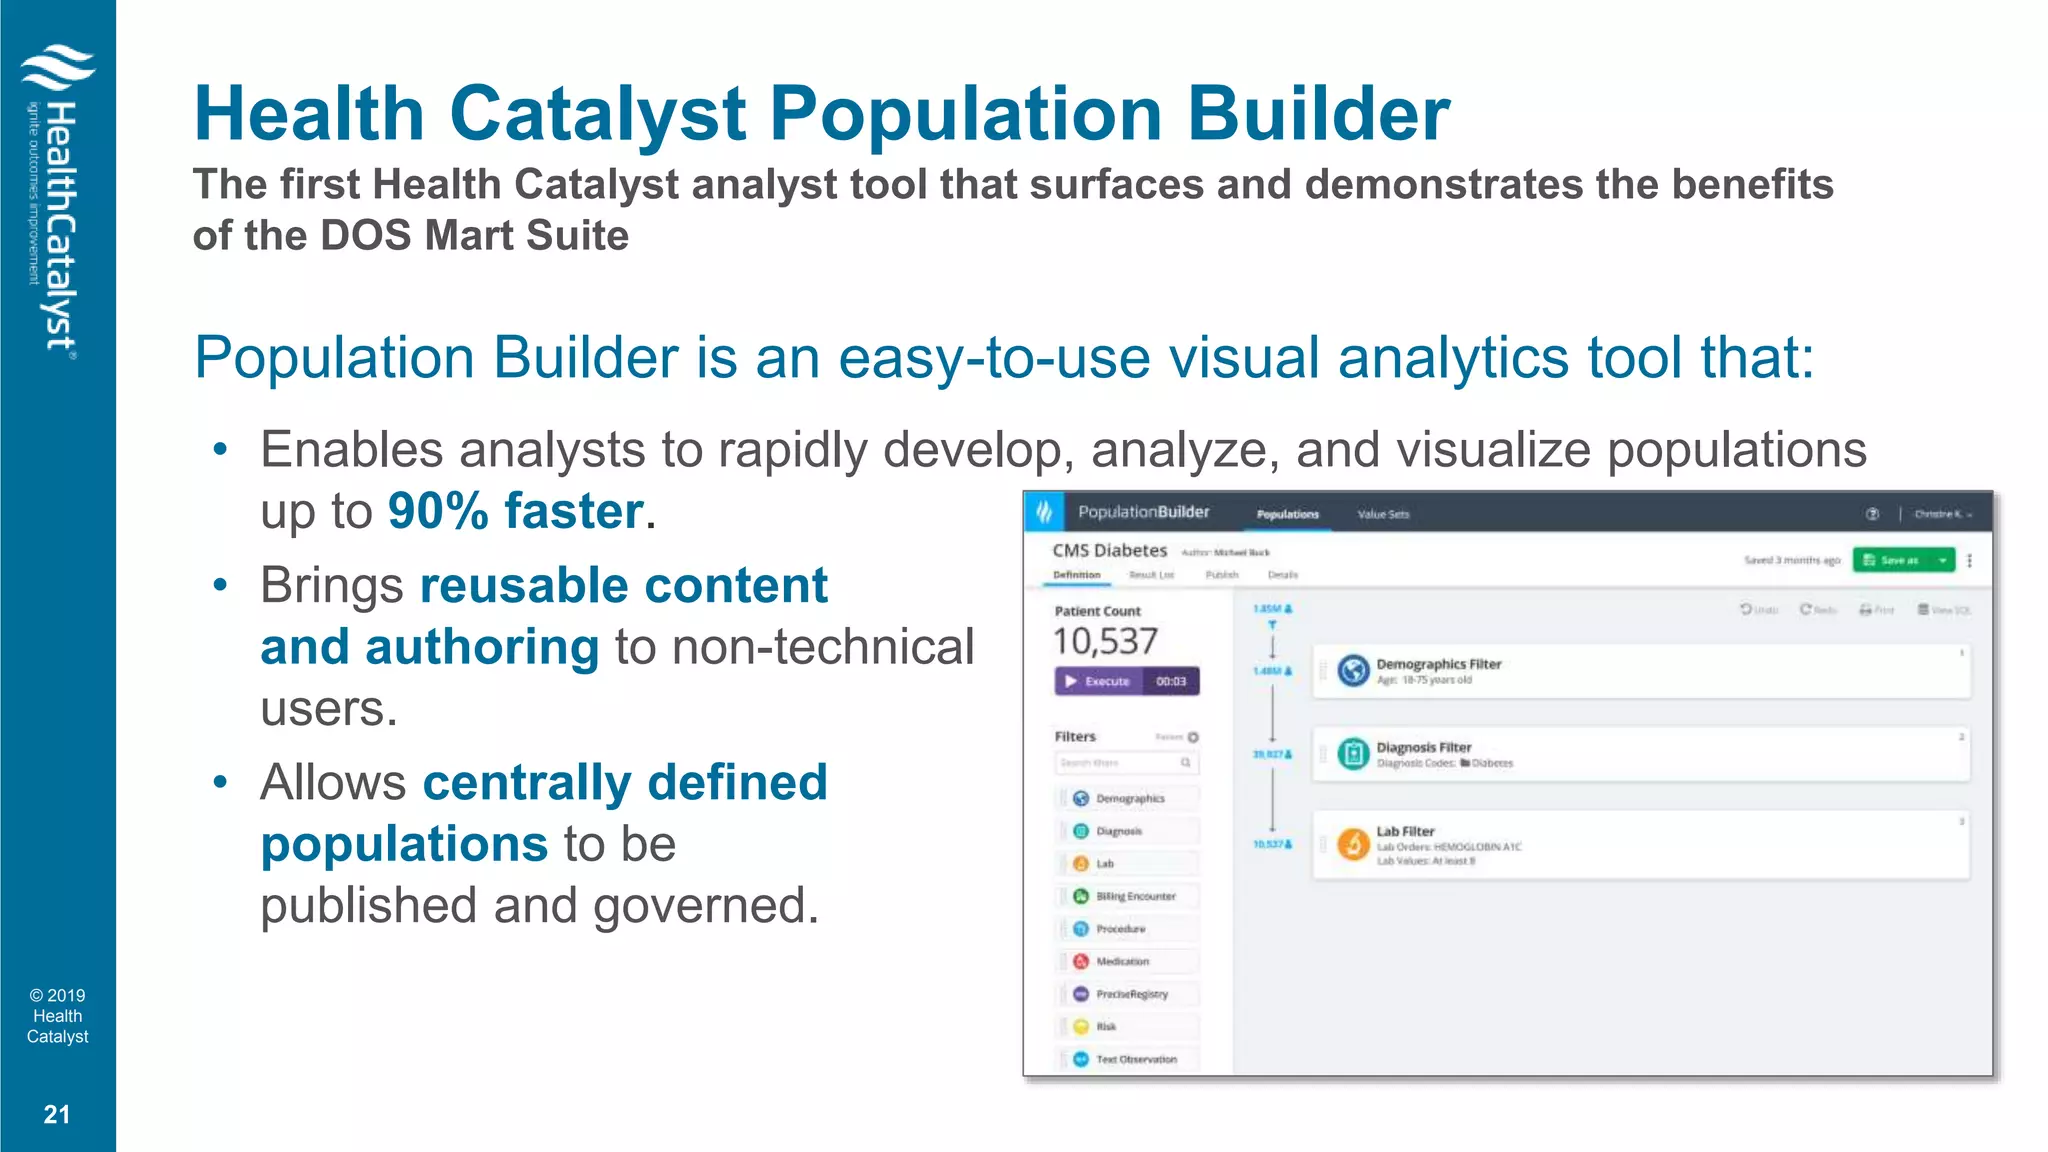
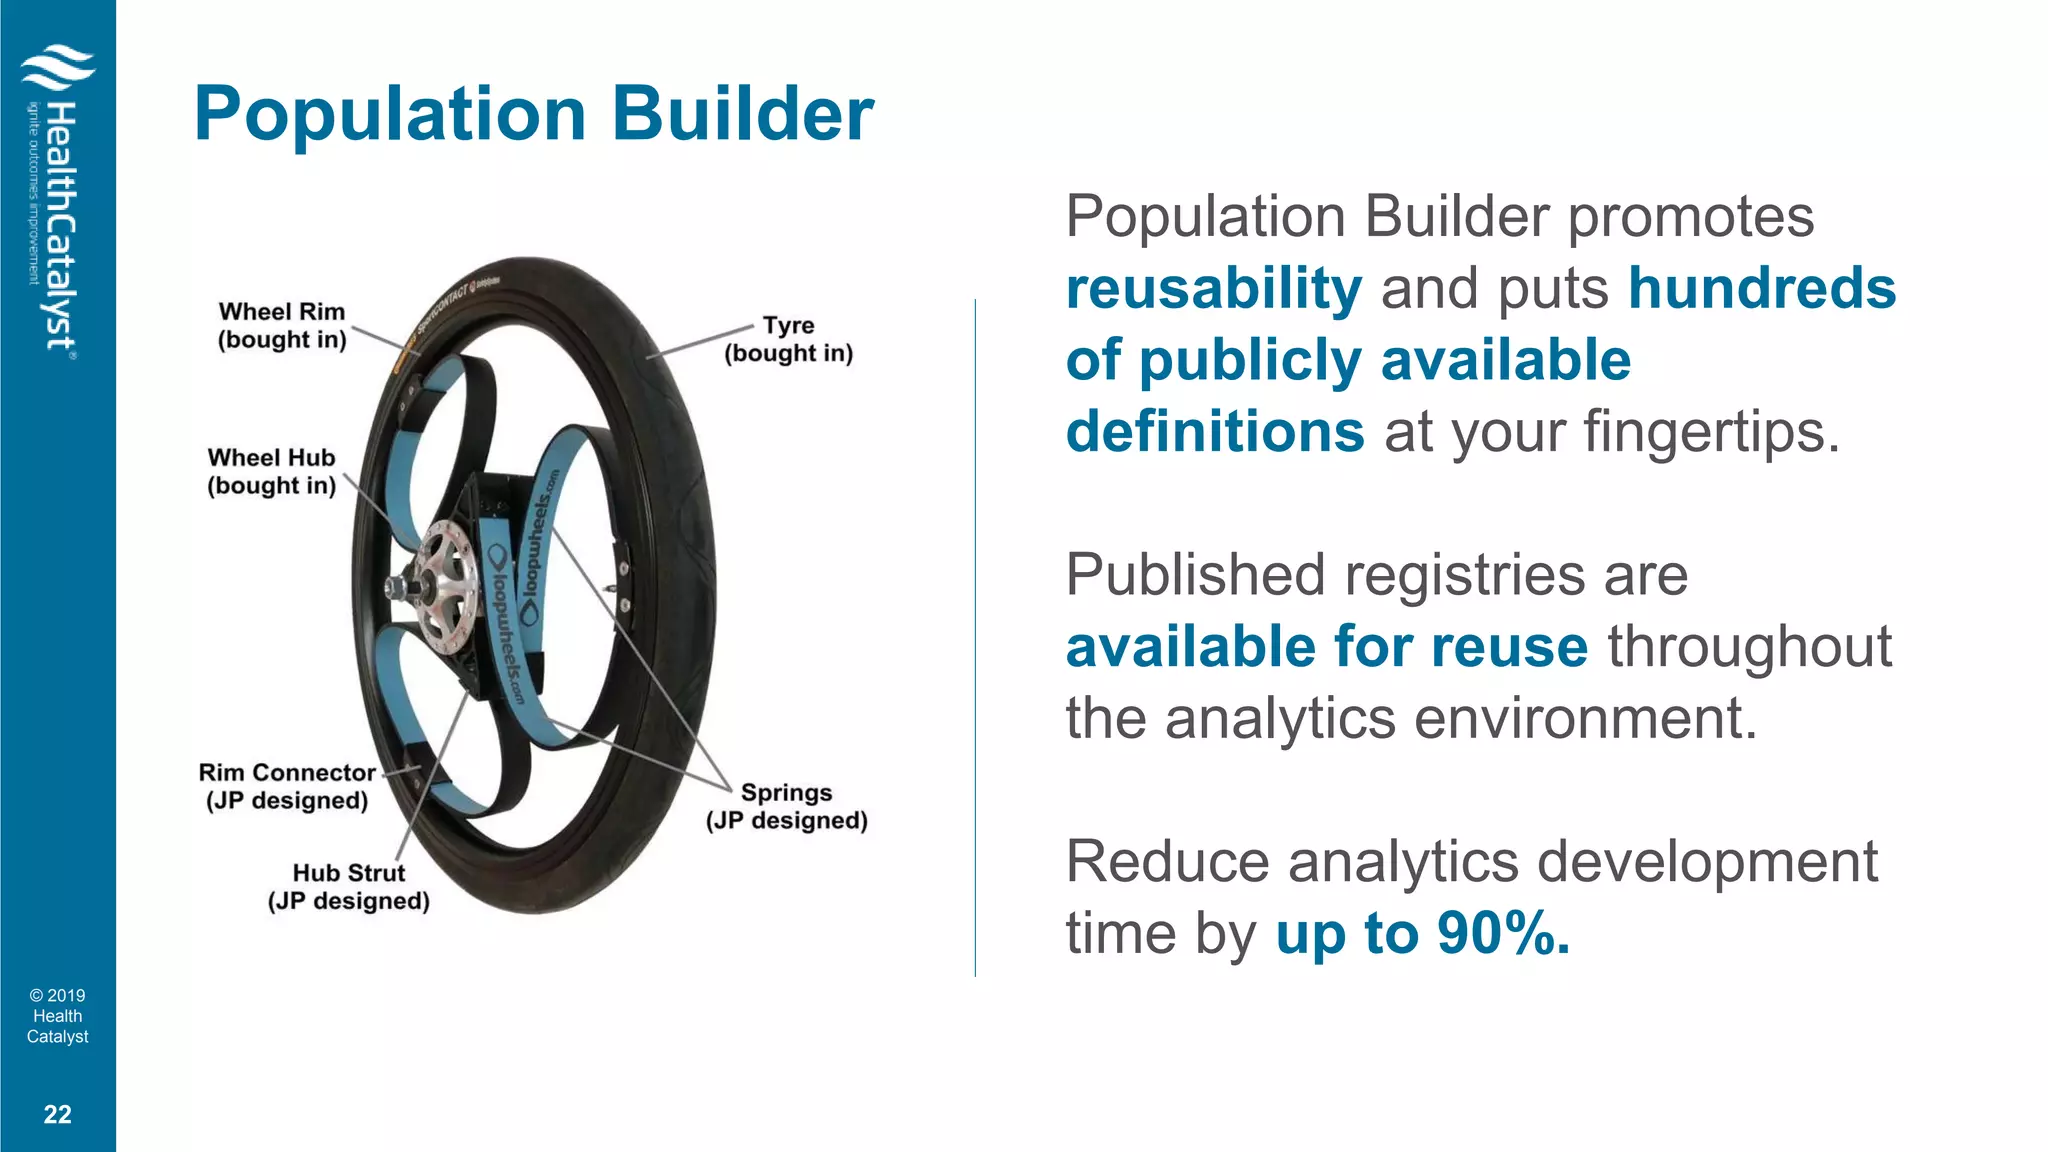
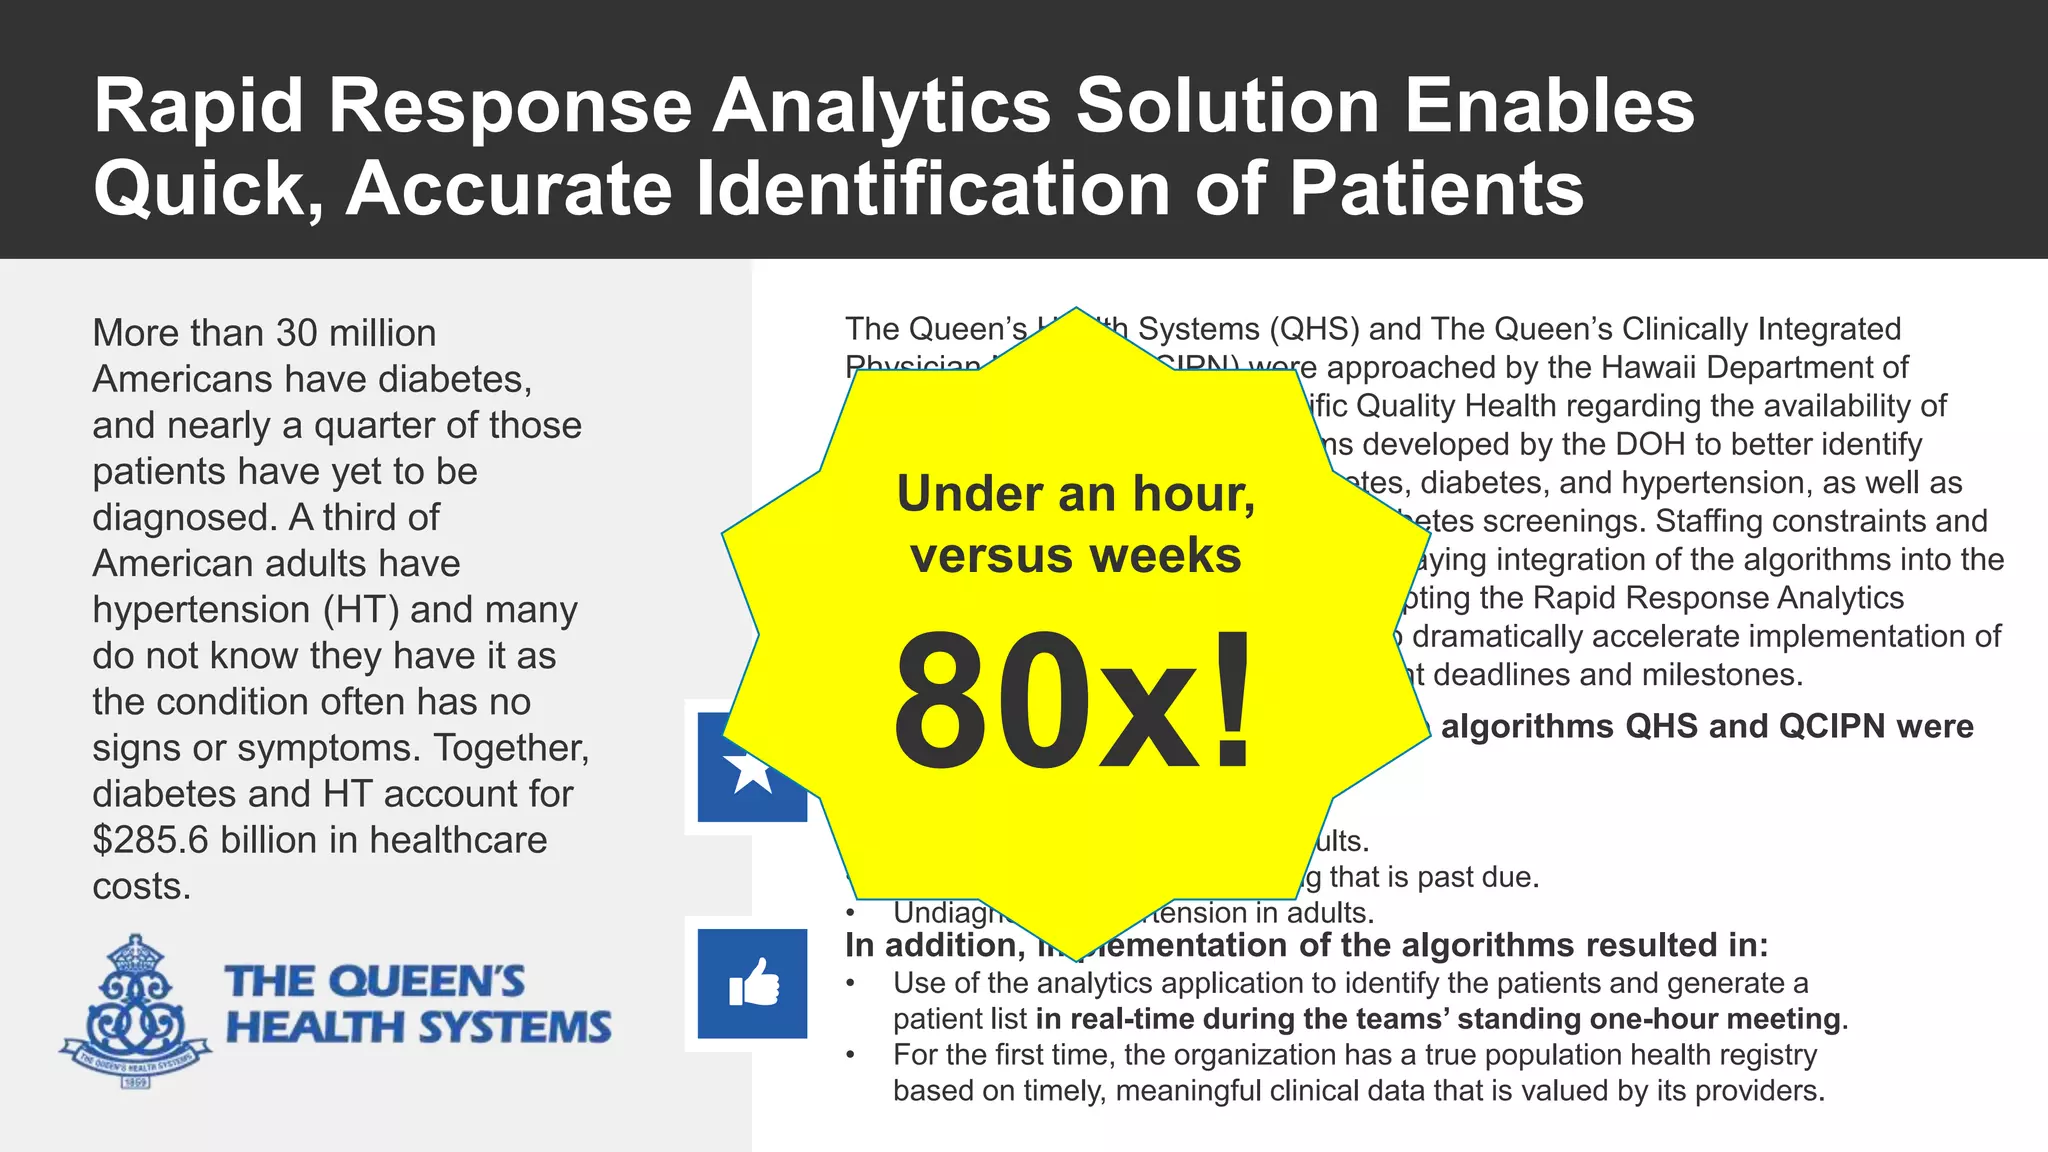
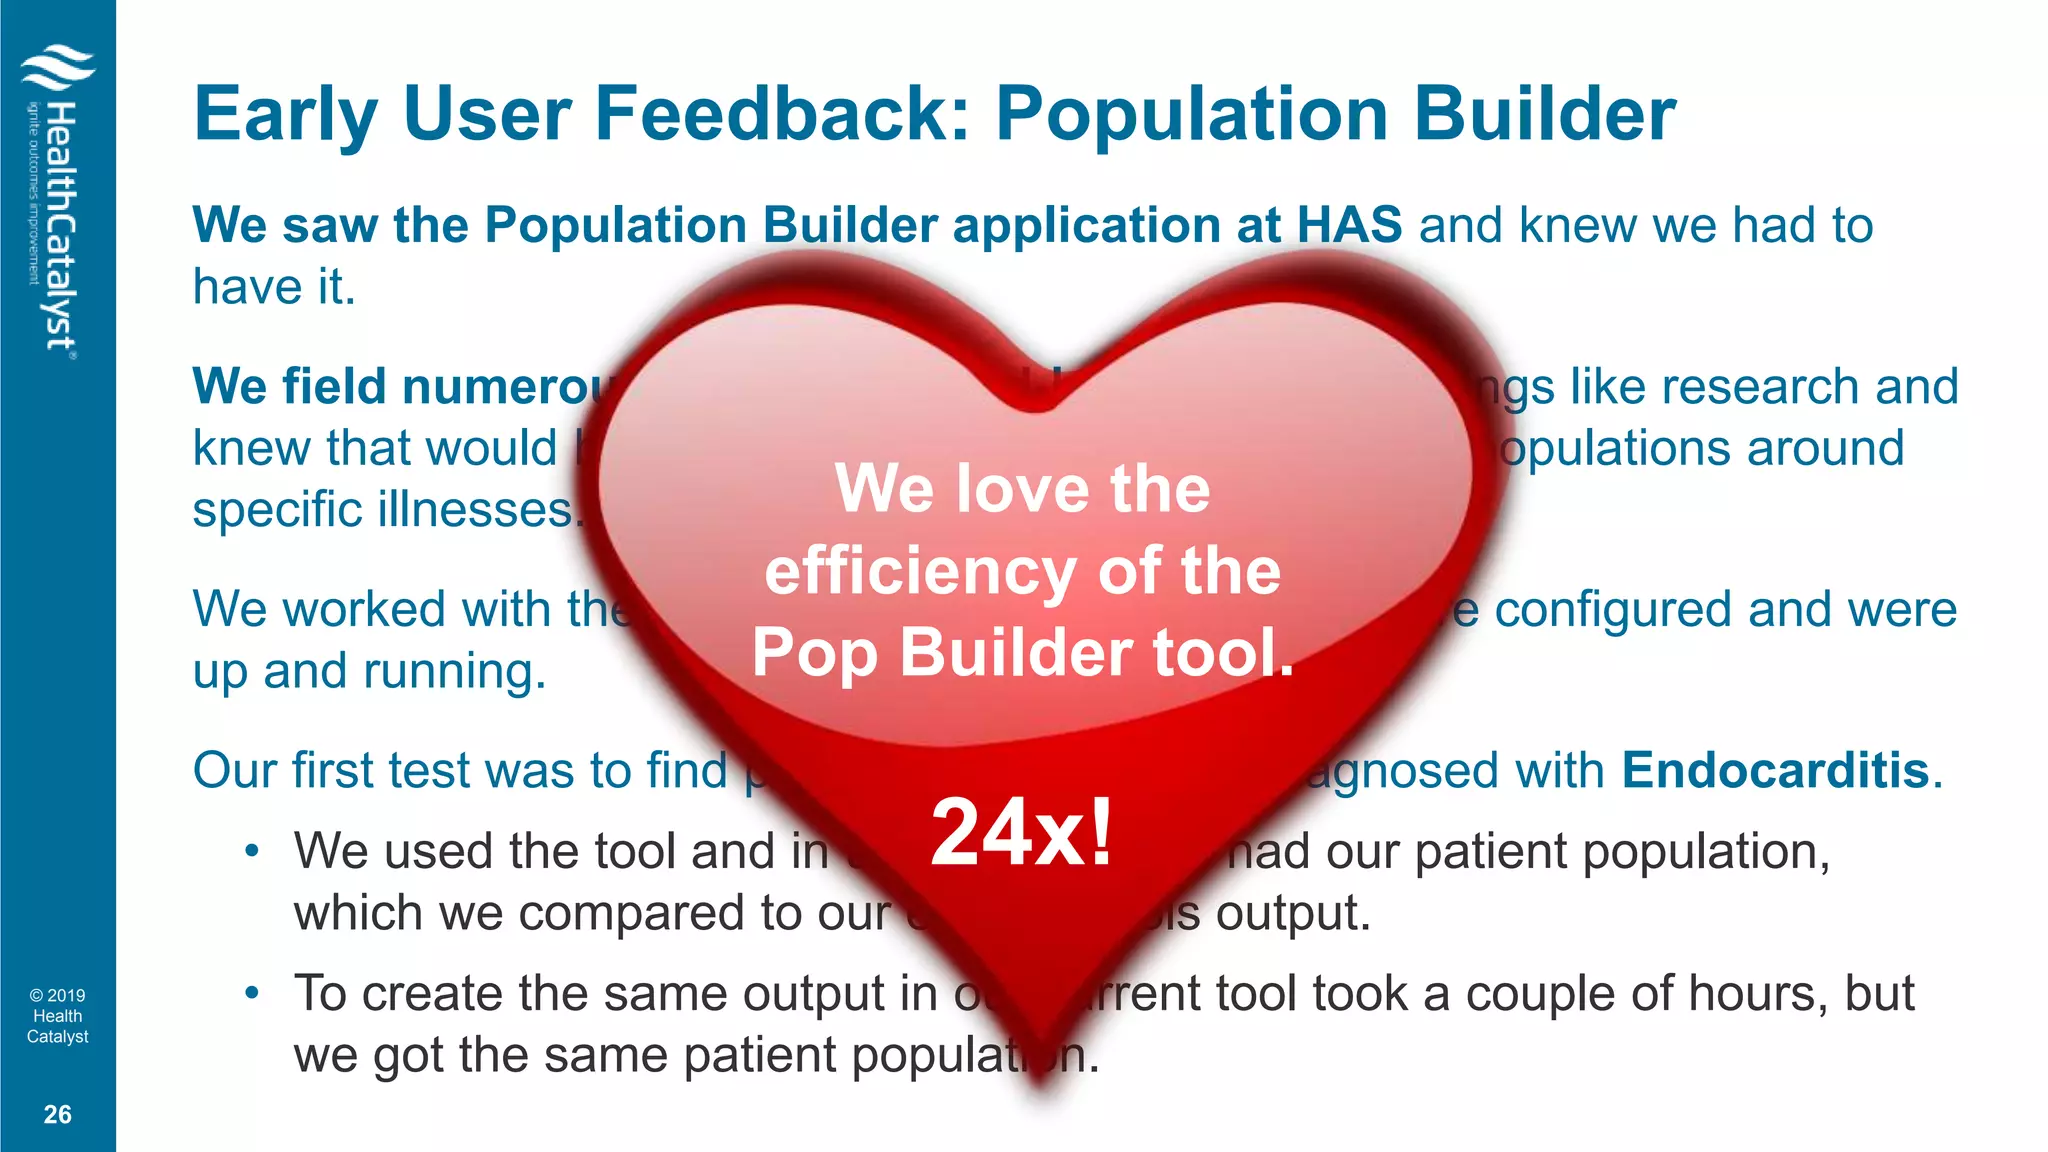
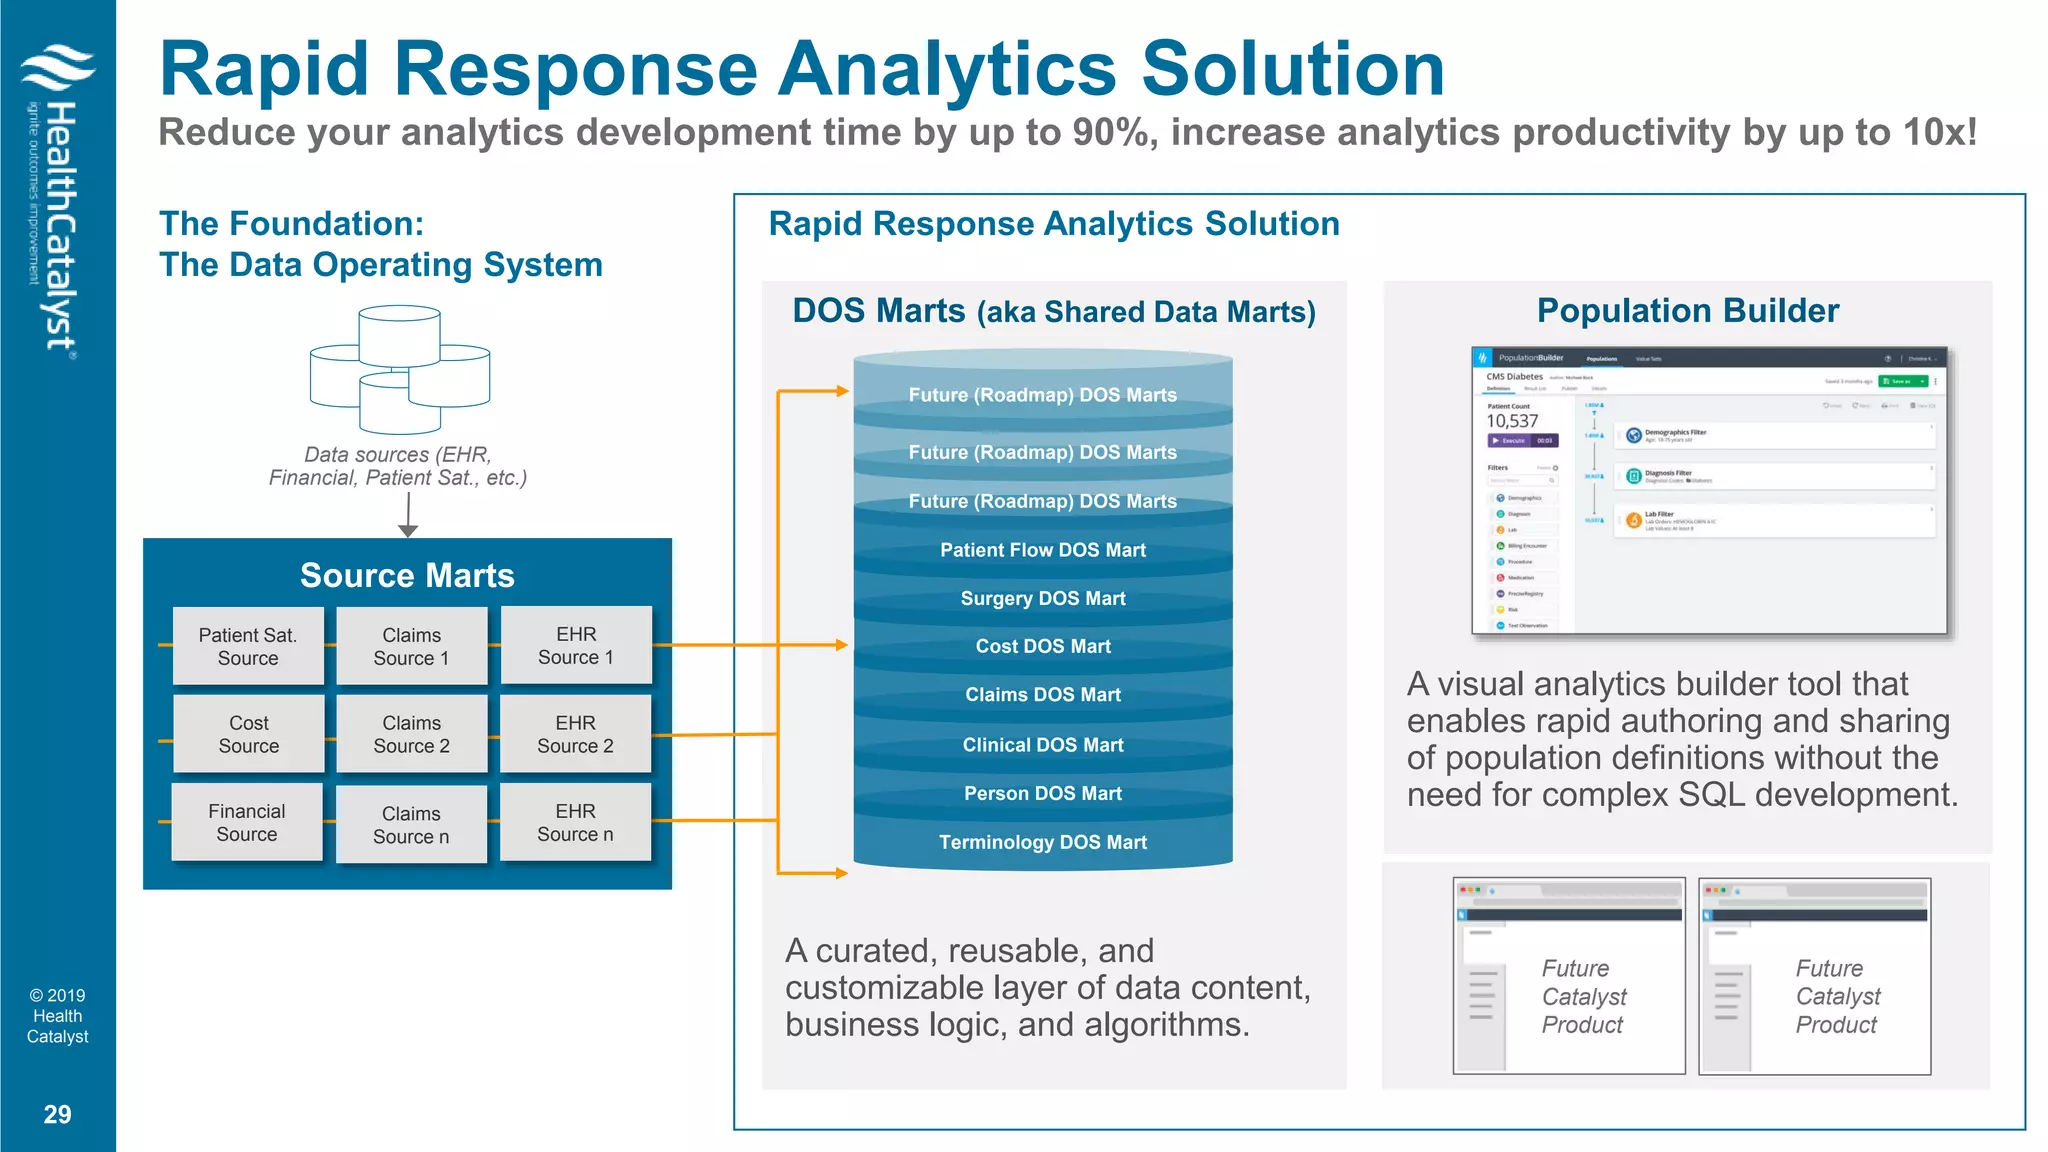
Health Catalyst
Rapid Response Analytics Solution
A data content and software suite to reduce your analytic development
time by up to 90%
Eric Just, SVP, Product Development
(Former Software Developer, Architect, Analytics Team Manager)
© 2019
Health
Catalyst
• Background
• Rapid Response Analytics Solution
• Conclusion
Agenda
2
© 2019
Health
Catalyst
3
Reduce
Variation
Improve
Health
Improve
Efficiency
Pre-DOS Early implementation DOS + Products
Rapid Response Analytics Solution:
Enabling Better Analytics Through Efficiency
3
© 2019
Health
Catalyst
Overall, how well do you agree with the following statement?
“Analytic results in my organization are consistent: if you ask different
analysts you will get similar results.”
• Completely disagree — 19%
• Moderately disagree — 32%
• Neutral — 22%
• Moderately agree — 26%
• Completely agree — 1%
Poll Question #1
4
© 2019
Health
Catalyst
Catalyst’s platform is about time to value, but we have observed
some barriers to sustainability…
• Analysts (and IT staff) are stressed and overworked; no amount of resources
seem to quell the demand.
• Organizations struggle with consistency in analytic results.
• Analytics is increasingly seen as an under-performing investment with
questionable ROI.
• Increasing scrutiny exists about whether Late-Binding is scalable enough.
The Data is Unleashed…Now What?
5
© 2019
Health
Catalyst
The Data is Unleashed…Now What?
At most organizations, the
analytics process still takes
too long.
Development time is lost
with:
• Repeating tasks
• Inefficient communications
• Using specialized resources
for simple things
6
© 2019
Health
Catalyst
• Integrating diagnoses from multiple data
sources
• Identifying which encounters were inpatient
encounters
• Calculating LOS
• Identifying heart failure diagnosis codes
These are all valuable tasks, but we are
asking analysts to reinvent the wheel
each time they define these.
What is Taking So Long?
Repeating tasks
7
Patents filed for new wheel designs
throughout the 20th century.
© 2019
Health
Catalyst
The amount of analyst time at my institution that is lost due to
performing repetitive tasks that could be automated is:
• 0-20% — 2%
• 21-40% — 31%
• 41-60% — 42%
• 61-80% — 23%
• 81-100% — 2%
Poll Question #2
8
© 2019
Health
Catalyst
What is Taking so Long?
Inefficient Communication Cycles
9
AnalystSME
© 2019
Health
Catalyst
What is Taking so Long?
Specialized Resources for Simple Things
10
• How many diabetics did we see
last year?
• Which patients received
valsartan in the last six
months?
• How many patients are
diagnosed with scleroderma?
• How many patients with low
back pain are also being
prescribed opioids?
© 2019
Health
Catalyst
Analytics Development Process
Starts with Population Definition
Data
Standardization
Conform data
structures and
terminology
mapping
Ad-hoc
Analysis
How many
patients…?
What if…?
Cohort
Definition
Inclusion and
exclusion
criteria
Metrics/
Measures
Collect and
calculate data
about
population
Algorithms
and Insights
Analyze, train,
and discover
Rapid Response Analytics Solution
The Rapid Response Analytics Solution
Reduces analytics development time by up to 90%
• Less time spent standardizing data
• Less time spent rewriting common definitions
• Less time spent inefficiently communicating with SMEs
• Less time spent on simple questions
More time on analytics
11
© 2019
Health
Catalyst
• Background
• Rapid Response Analytics Solution
• Conclusion
Agenda
12
© 2019
Health
Catalyst
Source Marts
DOS Marts
Rapid Response Analytics Solution
Reduce your analytics development time by up to 90%, increase analytics productivity by up to 10x!
13
Data sources (EHR,
Financial, Patient Sat., etc.)
Rapid Response Analytics SolutionThe Foundation:
The Data Operating System
Population Builder
A visual analytics builder tool that
enables rapid authoring and sharing
of population definitions without the
need for complex SQL development.
A curated, reusable, and
customizable layer of data content,
business logic, and algorithms.
Terminology DOS Mart
Person DOS Mart
Clinical DOS Mart
Claims DOS Mart
Cost DOS Mart
Surgery DOS Mart
Patient Flow DOS Mart
Future (Roadmap) DOS Marts
Patient Sat.
Source
Claims
Source 1
Claims
Source 2
Claims
Source n
EHR
Source 1
EHR
Source 2
EHR
Source n
Cost
Source
Financial
Source
Future (Roadmap) DOS Marts
© 2019
Health
Catalyst
The Health Catalyst DOS™ Mart Suite
The next generation of data marts delivering content into the Data Operating System
14
Reusable, curated content
leveraging decades of
experience.
Analysts no longer need to reinvent the
wheel.
Results are more consistent.
Analysts can focus on creating value-add
business analytics versus complex SQL
across multiple data sources.Patents filed for new wheel designs
throughout the 20th century.
Terminology DOS Mart
Person DOS Mart
Clinical DOS Mart
Claims DOS Mart
Cost DOS Mart
Surgery DOS Mart
Patient Flow DOS Mart
Future (Roadmap) DOS Marts
© 2019
Health
Catalyst
Balanced Architectural Strategy
Enterprise Data Model: Everything early
bound to single standard definitions.
Late-Binding: Don’t bind definitions
until business use case requires.
Rapid time to value
Proliferation of data objects
Balanced Approach
• Preserve atomic detail in Source Marts.
• Standardized, reusable data marts that focus on high-
value data points and calculations (DOS Marts).
• Downstream analytics can draw from either DOS Marts,
Source Marts or other Subject Area Marts.
15
© 2019
Health
Catalyst
Extensible:
Local definitions are
allowed, while maintaining
upgradeability and
maintainability by Health
Catalyst.
16
DOS Marts™ Design Principles
© 2019
Health
Catalyst
The Health Catalyst DOS™ Mart Suite
Compounded value
17
Clinical, Claims, Cost,
Patient Satisfaction, Surgery,
Patient Flow
Terminology, Person
Readmissions (in development)
5 hours to install versus 60 hours for
readmissions explorer
92% less time!
Leading Wisely
metrics
Improvement SAM
COPD, HF, etc.
Ad-hoc analysis
© 2019
Health
Catalyst
18
© 2019
Health
Catalyst
19
© 2019
Health
Catalyst
Source Marts
DOS Marts
Rapid Response Analytics Solution
Reduce your analytics development time by up to 90%, increase analytics productivity by up to 10x!
20
Data sources (EHR,
Financial, Patient Sat., etc.)
Rapid Response Analytics SolutionThe Foundation:
The Data Operating System
Population Builder
A visual analytics builder tool that
enables rapid authoring and sharing
of population definitions without the
need for complex SQL development.
A curated, reusable, and
customizable layer of data content,
business logic, and algorithms.
Terminology DOS Mart
Person DOS Mart
Clinical DOS Mart
Claims DOS Mart
Cost DOS Mart
Surgery DOS Mart
Patient Flow DOS Mart
Future (Roadmap) DOS Marts
Patient Sat.
Source
Claims
Source 1
Claims
Source 2
Claims
Source n
EHR
Source 1
EHR
Source 2
EHR
Source n
Cost
Source
Financial
Source
Future (Roadmap) DOS Marts
© 2019
Health
Catalyst
Population Builder is an easy-to-use visual analytics tool that:
• Enables analysts to rapidly develop, analyze, and visualize populations
up to 90% faster.
• Brings reusable content
and authoring to non-technical
users.
• Allows centrally defined
populations to be
published and governed.
Health Catalyst Population Builder
The first Health Catalyst analyst tool that surfaces and demonstrates the benefits
of the DOS Mart Suite
21
© 2019
Health
Catalyst
Population Builder
22
Population Builder promotes
reusability and puts hundreds
of publicly available
definitions at your fingertips.
Published registries are
available for reuse throughout
the analytics environment.
Reduce analytics development
time by up to 90%.
© 2019
Health
Catalyst
Population Builder
Improve SME and analyst collaboration
Enable the SME and the analyst to ‘co-pilot’
Population Builder’s easy-to-use interface gives non-technical
users unprecedented access to DOS™ content authoring.
23
© 2019
Health
Catalyst
Population Builder
Give data directly to consumers
Don’t call a surgeon to
administer a BAND-AID.
Ad-hoc analysis puts power in the hands of
data consumers instead of relying on
expensive and overwhelmed analysts.
The result: Analysts increase
effectiveness, operate at the
top of their license.
24
© 2019
Health
Catalyst
Rapid Response Analytics Solution Enables
Quick, Accurate Identification of Patients
More than 30 million
Americans have diabetes,
and nearly a quarter of those
patients have yet to be
diagnosed. A third of
American adults have
hypertension (HT) and many
do not know they have it as
the condition often has no
signs or symptoms. Together,
diabetes and HT account for
$285.6 billion in healthcare
costs.
The Queen’s Health Systems (QHS) and The Queen’s Clinically Integrated
Physician Network (QCIPN) were approached by the Hawaii Department of
Health (DOH) and Mountain-Pacific Quality Health regarding the availability of
grant funds to implement algorithms developed by the DOH to better identify
patients with undiagnosed pre-diabetes, diabetes, and hypertension, as well as
patients with past-due diabetes/pre-diabetes screenings. Staffing constraints and
disparate EMRs created challenges, delaying integration of the algorithms into the
EMR by months or even a year. By adopting the Rapid Response Analytics
Solution, QHS and QCIPN were able to dramatically accelerate implementation of
the custom algorithms, meeting the grant deadlines and milestones.
After successfully implementing the algorithms QHS and QCIPN were
able to identify:
• Undiagnosed diabetes in adults.
• Undiagnosed pre-diabetes in adults.
• Diabetes/pre-diabetes screening that is past due.
• Undiagnosed hypertension in adults.
In addition, implementation of the algorithms resulted in:
• Use of the analytics application to identify the patients and generate a
patient list in real-time during the teams’ standing one-hour meeting.
• For the first time, the organization has a true population health registry
based on timely, meaningful clinical data that is valued by its providers.
Under an hour,
versus weeks
80x!
© 2019
Health
Catalyst
We saw the Population Builder application at HAS and knew we had to
have it.
We field numerous requests for ad-hoc reports for things like research and
knew that would be a great tool to quickly gather patient populations around
specific illnesses.
We worked with the Pop Builder team to get the software configured and were
up and running.
Our first test was to find patients that had been diagnosed with Endocarditis.
• We used the tool and in under 5 minutes had our patient population,
which we compared to our existing tools output.
• To create the same output in our current tool took a couple of hours, but
we got the same patient population.
Early User Feedback: Population Builder
26
We love the
efficiency of the
Pop Builder tool.
24x!
© 2019
Health
Catalyst
• Background
• Rapid Response Analytics Solution
• Conclusion
Agenda
27
© 2019
Health
Catalyst
© 2019
Health
Catalyst
Source Marts
DOS Marts (aka Shared Data Marts)
Rapid Response Analytics Solution
Reduce your analytics development time by up to 90%, increase analytics productivity by up to 10x!
29
Data sources (EHR,
Financial, Patient Sat., etc.)
Rapid Response Analytics SolutionThe Foundation:
The Data Operating System
Population Builder
A visual analytics builder tool that
enables rapid authoring and sharing
of population definitions without the
need for complex SQL development.
Future
Catalyst
Product
Future
Catalyst
Product
A curated, reusable, and
customizable layer of data content,
business logic, and algorithms.
Terminology DOS Mart
Person DOS Mart
Clinical DOS Mart
Claims DOS Mart
Cost DOS Mart
Surgery DOS Mart
Patient Flow DOS Mart
Future (Roadmap) DOS Marts
Patient Sat.
Source
Claims
Source 1
Claims
Source 2
Claims
Source n
EHR
Source 1
EHR
Source 2
EHR
Source n
Cost
Source
Financial
Source
Future (Roadmap) DOS Marts
eric.just@healthcatalyst.com
Thank You!

Rapid Response Analytics Solution Accelerates Analytics ROI

  • 1.
    Health Catalyst Rapid ResponseAnalytics Solution A data content and software suite to reduce your analytic development time by up to 90% Eric Just, SVP, Product Development (Former Software Developer, Architect, Analytics Team Manager)
  • 2.
    © 2019 Health Catalyst • Background •Rapid Response Analytics Solution • Conclusion Agenda 2
  • 3.
    © 2019 Health Catalyst 3 Reduce Variation Improve Health Improve Efficiency Pre-DOS Earlyimplementation DOS + Products Rapid Response Analytics Solution: Enabling Better Analytics Through Efficiency 3
  • 4.
    © 2019 Health Catalyst Overall, howwell do you agree with the following statement? “Analytic results in my organization are consistent: if you ask different analysts you will get similar results.” • Completely disagree — 19% • Moderately disagree — 32% • Neutral — 22% • Moderately agree — 26% • Completely agree — 1% Poll Question #1 4
  • 5.
    © 2019 Health Catalyst Catalyst’s platformis about time to value, but we have observed some barriers to sustainability… • Analysts (and IT staff) are stressed and overworked; no amount of resources seem to quell the demand. • Organizations struggle with consistency in analytic results. • Analytics is increasingly seen as an under-performing investment with questionable ROI. • Increasing scrutiny exists about whether Late-Binding is scalable enough. The Data is Unleashed…Now What? 5
  • 6.
    © 2019 Health Catalyst The Datais Unleashed…Now What? At most organizations, the analytics process still takes too long. Development time is lost with: • Repeating tasks • Inefficient communications • Using specialized resources for simple things 6
  • 7.
    © 2019 Health Catalyst • Integratingdiagnoses from multiple data sources • Identifying which encounters were inpatient encounters • Calculating LOS • Identifying heart failure diagnosis codes These are all valuable tasks, but we are asking analysts to reinvent the wheel each time they define these. What is Taking So Long? Repeating tasks 7 Patents filed for new wheel designs throughout the 20th century.
  • 8.
    © 2019 Health Catalyst The amountof analyst time at my institution that is lost due to performing repetitive tasks that could be automated is: • 0-20% — 2% • 21-40% — 31% • 41-60% — 42% • 61-80% — 23% • 81-100% — 2% Poll Question #2 8
  • 9.
    © 2019 Health Catalyst What isTaking so Long? Inefficient Communication Cycles 9 AnalystSME
  • 10.
    © 2019 Health Catalyst What isTaking so Long? Specialized Resources for Simple Things 10 • How many diabetics did we see last year? • Which patients received valsartan in the last six months? • How many patients are diagnosed with scleroderma? • How many patients with low back pain are also being prescribed opioids?
  • 11.
    © 2019 Health Catalyst Analytics DevelopmentProcess Starts with Population Definition Data Standardization Conform data structures and terminology mapping Ad-hoc Analysis How many patients…? What if…? Cohort Definition Inclusion and exclusion criteria Metrics/ Measures Collect and calculate data about population Algorithms and Insights Analyze, train, and discover Rapid Response Analytics Solution The Rapid Response Analytics Solution Reduces analytics development time by up to 90% • Less time spent standardizing data • Less time spent rewriting common definitions • Less time spent inefficiently communicating with SMEs • Less time spent on simple questions More time on analytics 11
  • 12.
    © 2019 Health Catalyst • Background •Rapid Response Analytics Solution • Conclusion Agenda 12
  • 13.
    © 2019 Health Catalyst Source Marts DOSMarts Rapid Response Analytics Solution Reduce your analytics development time by up to 90%, increase analytics productivity by up to 10x! 13 Data sources (EHR, Financial, Patient Sat., etc.) Rapid Response Analytics SolutionThe Foundation: The Data Operating System Population Builder A visual analytics builder tool that enables rapid authoring and sharing of population definitions without the need for complex SQL development. A curated, reusable, and customizable layer of data content, business logic, and algorithms. Terminology DOS Mart Person DOS Mart Clinical DOS Mart Claims DOS Mart Cost DOS Mart Surgery DOS Mart Patient Flow DOS Mart Future (Roadmap) DOS Marts Patient Sat. Source Claims Source 1 Claims Source 2 Claims Source n EHR Source 1 EHR Source 2 EHR Source n Cost Source Financial Source Future (Roadmap) DOS Marts Future (Roadmap) DOS Marts
  • 14.
    © 2019 Health Catalyst The HealthCatalyst DOS™ Mart Suite The next generation of data marts delivering content into the Data Operating System 14 Reusable, curated content leveraging decades of experience. Analysts no longer need to reinvent the wheel. Results are more consistent. Analysts can focus on creating value-add business analytics versus complex SQL across multiple data sources.Patents filed for new wheel designs throughout the 20th century. Terminology DOS Mart Person DOS Mart Clinical DOS Mart Claims DOS Mart Cost DOS Mart Surgery DOS Mart Patient Flow DOS Mart Future (Roadmap) DOS Marts Future (Roadmap) DOS Marts Future (Roadmap) DOS Marts
  • 15.
    © 2019 Health Catalyst Balanced ArchitecturalStrategy Enterprise Data Model: Everything early bound to single standard definitions. Late-Binding: Don’t bind definitions until business use case requires. Rapid time to value Proliferation of data objects Balanced Approach • Preserve atomic detail in Source Marts. • Standardized, reusable data marts that focus on high- value data points and calculations (DOS Marts). • Downstream analytics can draw from either DOS Marts, Source Marts or other Subject Area Marts. 15
  • 16.
    © 2019 Health Catalyst Extensible: Local definitionsare allowed, while maintaining upgradeability and maintainability by Health Catalyst. 16 DOS Marts™ Design Principles
  • 17.
    © 2019 Health Catalyst The HealthCatalyst DOS™ Mart Suite Compounded value 17 Clinical, Claims, Cost, Patient Satisfaction, Surgery, Patient Flow Terminology, Person Readmissions (in development) 5 hours to install versus 60 hours for readmissions explorer 92% less time! Leading Wisely metrics Improvement SAM COPD, HF, etc. Ad-hoc analysis
  • 18.
  • 19.
  • 20.
    © 2019 Health Catalyst Source Marts DOSMarts Rapid Response Analytics Solution Reduce your analytics development time by up to 90%, increase analytics productivity by up to 10x! 20 Data sources (EHR, Financial, Patient Sat., etc.) Rapid Response Analytics SolutionThe Foundation: The Data Operating System Population Builder A visual analytics builder tool that enables rapid authoring and sharing of population definitions without the need for complex SQL development. A curated, reusable, and customizable layer of data content, business logic, and algorithms. Terminology DOS Mart Person DOS Mart Clinical DOS Mart Claims DOS Mart Cost DOS Mart Surgery DOS Mart Patient Flow DOS Mart Future (Roadmap) DOS Marts Patient Sat. Source Claims Source 1 Claims Source 2 Claims Source n EHR Source 1 EHR Source 2 EHR Source n Cost Source Financial Source Future (Roadmap) DOS Marts Future (Roadmap) DOS Marts
  • 21.
    © 2019 Health Catalyst Population Builderis an easy-to-use visual analytics tool that: • Enables analysts to rapidly develop, analyze, and visualize populations up to 90% faster. • Brings reusable content and authoring to non-technical users. • Allows centrally defined populations to be published and governed. Health Catalyst Population Builder The first Health Catalyst analyst tool that surfaces and demonstrates the benefits of the DOS Mart Suite 21
  • 22.
    © 2019 Health Catalyst Population Builder 22 PopulationBuilder promotes reusability and puts hundreds of publicly available definitions at your fingertips. Published registries are available for reuse throughout the analytics environment. Reduce analytics development time by up to 90%.
  • 23.
    © 2019 Health Catalyst Population Builder ImproveSME and analyst collaboration Enable the SME and the analyst to ‘co-pilot’ Population Builder’s easy-to-use interface gives non-technical users unprecedented access to DOS™ content authoring. 23
  • 24.
    © 2019 Health Catalyst Population Builder Givedata directly to consumers Don’t call a surgeon to administer a BAND-AID. Ad-hoc analysis puts power in the hands of data consumers instead of relying on expensive and overwhelmed analysts. The result: Analysts increase effectiveness, operate at the top of their license. 24
  • 25.
    © 2019 Health Catalyst Rapid ResponseAnalytics Solution Enables Quick, Accurate Identification of Patients More than 30 million Americans have diabetes, and nearly a quarter of those patients have yet to be diagnosed. A third of American adults have hypertension (HT) and many do not know they have it as the condition often has no signs or symptoms. Together, diabetes and HT account for $285.6 billion in healthcare costs. The Queen’s Health Systems (QHS) and The Queen’s Clinically Integrated Physician Network (QCIPN) were approached by the Hawaii Department of Health (DOH) and Mountain-Pacific Quality Health regarding the availability of grant funds to implement algorithms developed by the DOH to better identify patients with undiagnosed pre-diabetes, diabetes, and hypertension, as well as patients with past-due diabetes/pre-diabetes screenings. Staffing constraints and disparate EMRs created challenges, delaying integration of the algorithms into the EMR by months or even a year. By adopting the Rapid Response Analytics Solution, QHS and QCIPN were able to dramatically accelerate implementation of the custom algorithms, meeting the grant deadlines and milestones. After successfully implementing the algorithms QHS and QCIPN were able to identify: • Undiagnosed diabetes in adults. • Undiagnosed pre-diabetes in adults. • Diabetes/pre-diabetes screening that is past due. • Undiagnosed hypertension in adults. In addition, implementation of the algorithms resulted in: • Use of the analytics application to identify the patients and generate a patient list in real-time during the teams’ standing one-hour meeting. • For the first time, the organization has a true population health registry based on timely, meaningful clinical data that is valued by its providers. Under an hour, versus weeks 80x!
  • 26.
    © 2019 Health Catalyst We sawthe Population Builder application at HAS and knew we had to have it. We field numerous requests for ad-hoc reports for things like research and knew that would be a great tool to quickly gather patient populations around specific illnesses. We worked with the Pop Builder team to get the software configured and were up and running. Our first test was to find patients that had been diagnosed with Endocarditis. • We used the tool and in under 5 minutes had our patient population, which we compared to our existing tools output. • To create the same output in our current tool took a couple of hours, but we got the same patient population. Early User Feedback: Population Builder 26 We love the efficiency of the Pop Builder tool. 24x!
  • 27.
    © 2019 Health Catalyst • Background •Rapid Response Analytics Solution • Conclusion Agenda 27
  • 28.
  • 29.
    © 2019 Health Catalyst Source Marts DOSMarts (aka Shared Data Marts) Rapid Response Analytics Solution Reduce your analytics development time by up to 90%, increase analytics productivity by up to 10x! 29 Data sources (EHR, Financial, Patient Sat., etc.) Rapid Response Analytics SolutionThe Foundation: The Data Operating System Population Builder A visual analytics builder tool that enables rapid authoring and sharing of population definitions without the need for complex SQL development. Future Catalyst Product Future Catalyst Product A curated, reusable, and customizable layer of data content, business logic, and algorithms. Terminology DOS Mart Person DOS Mart Clinical DOS Mart Claims DOS Mart Cost DOS Mart Surgery DOS Mart Patient Flow DOS Mart Future (Roadmap) DOS Marts Patient Sat. Source Claims Source 1 Claims Source 2 Claims Source n EHR Source 1 EHR Source 2 EHR Source n Cost Source Financial Source Future (Roadmap) DOS Marts Future (Roadmap) DOS Marts
  • 30.