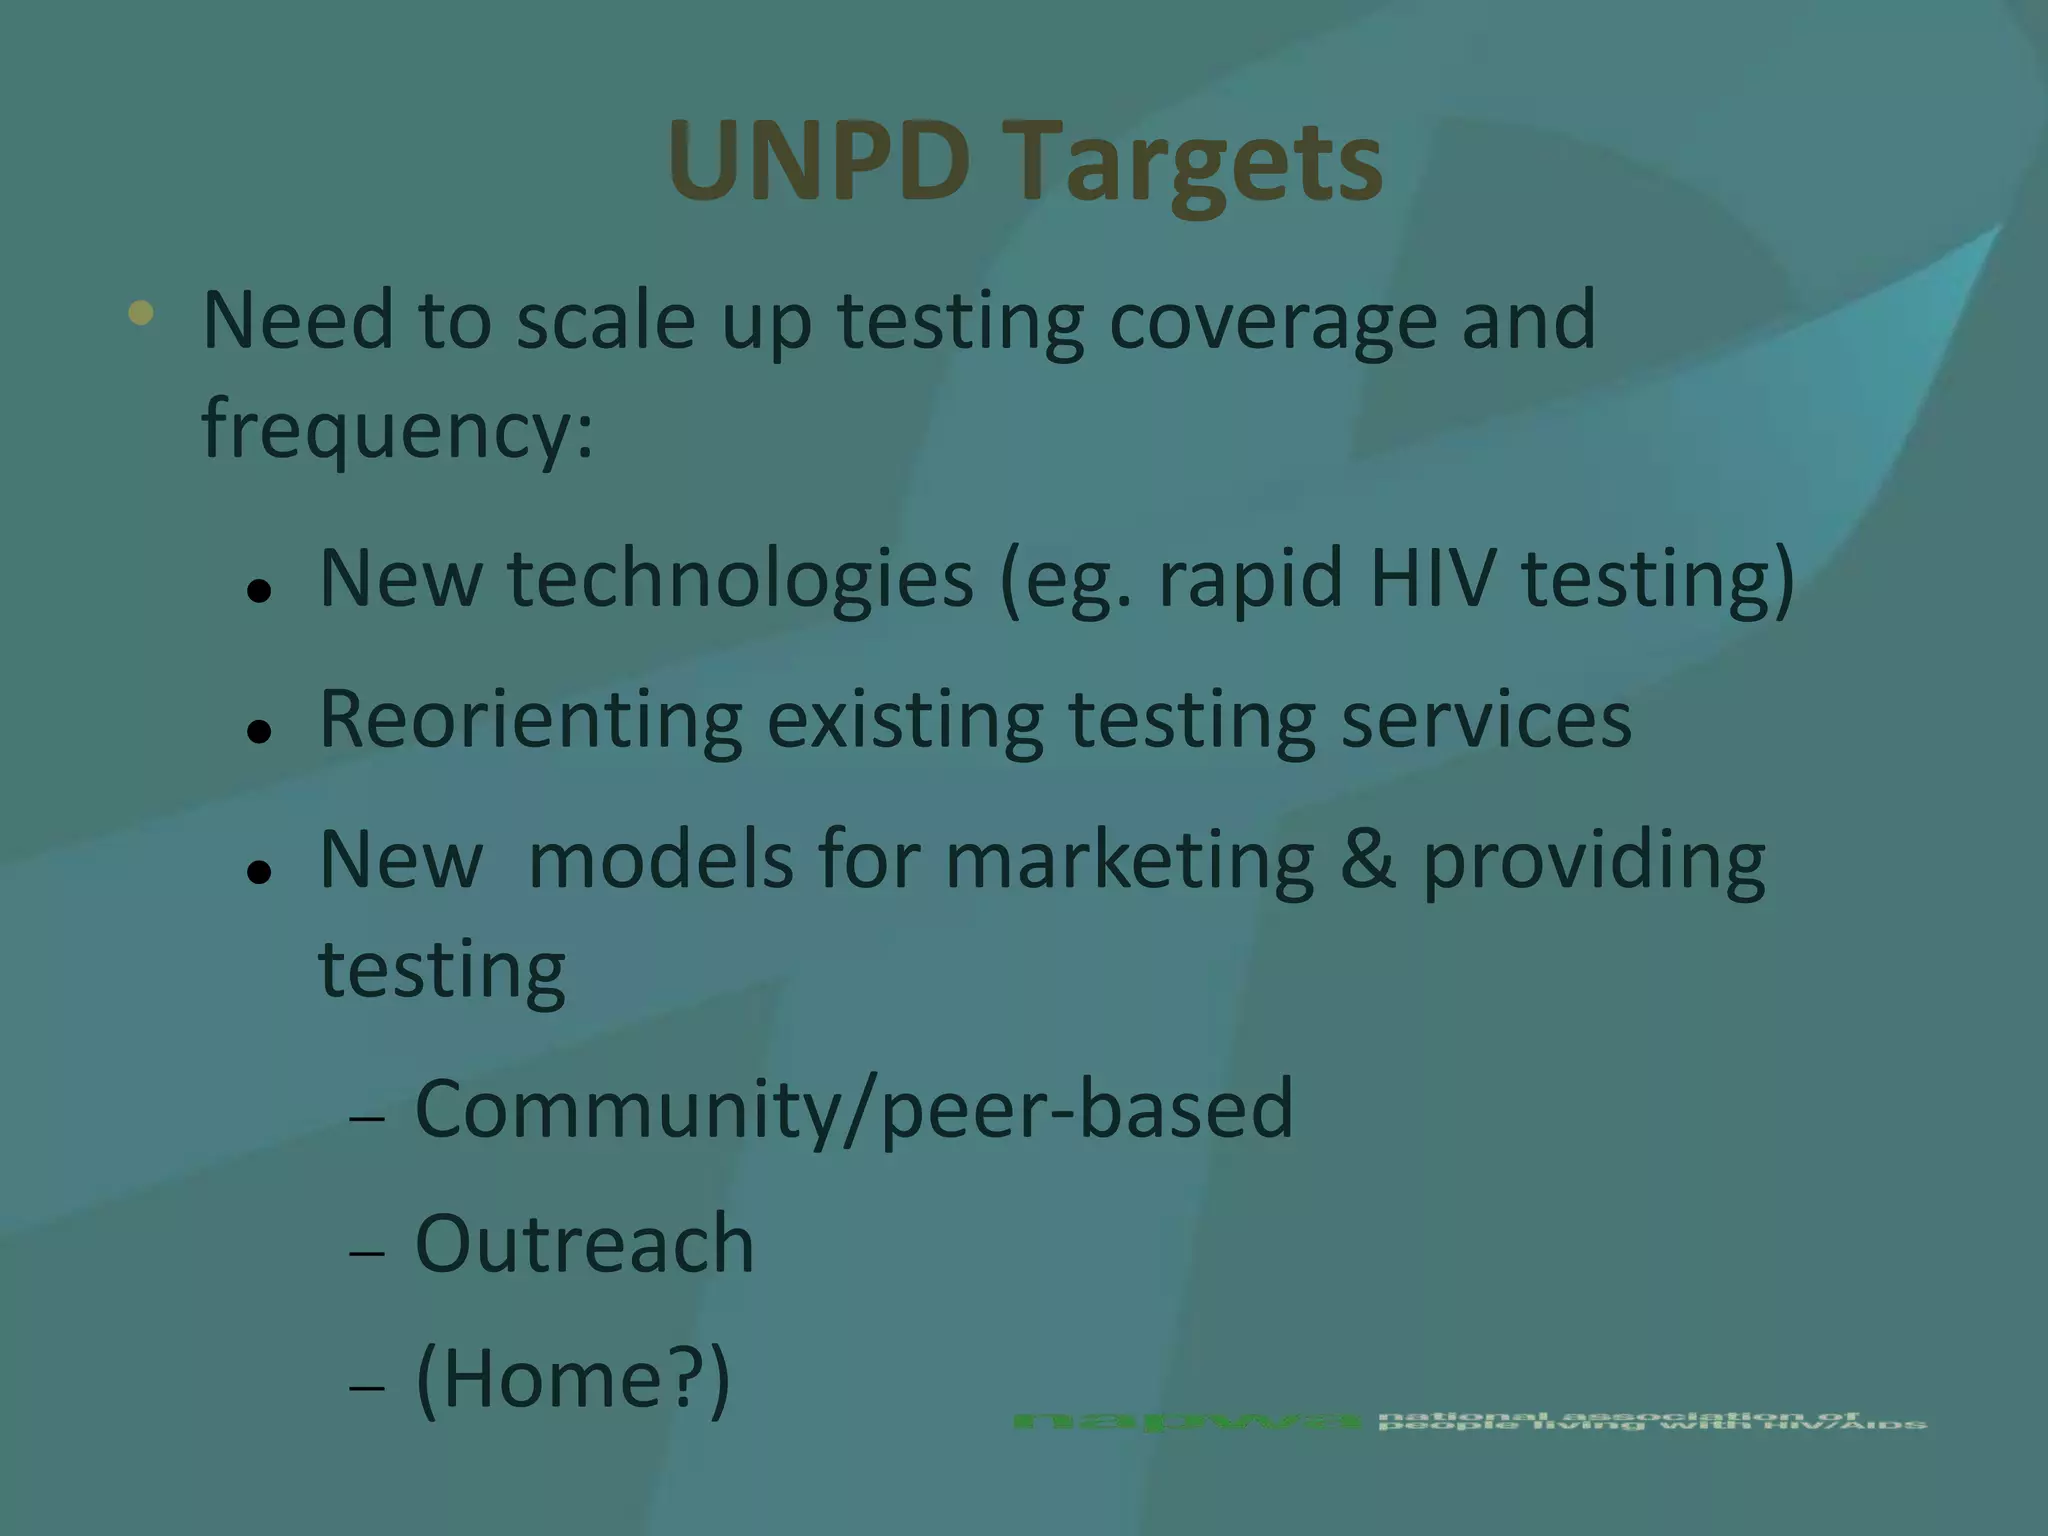
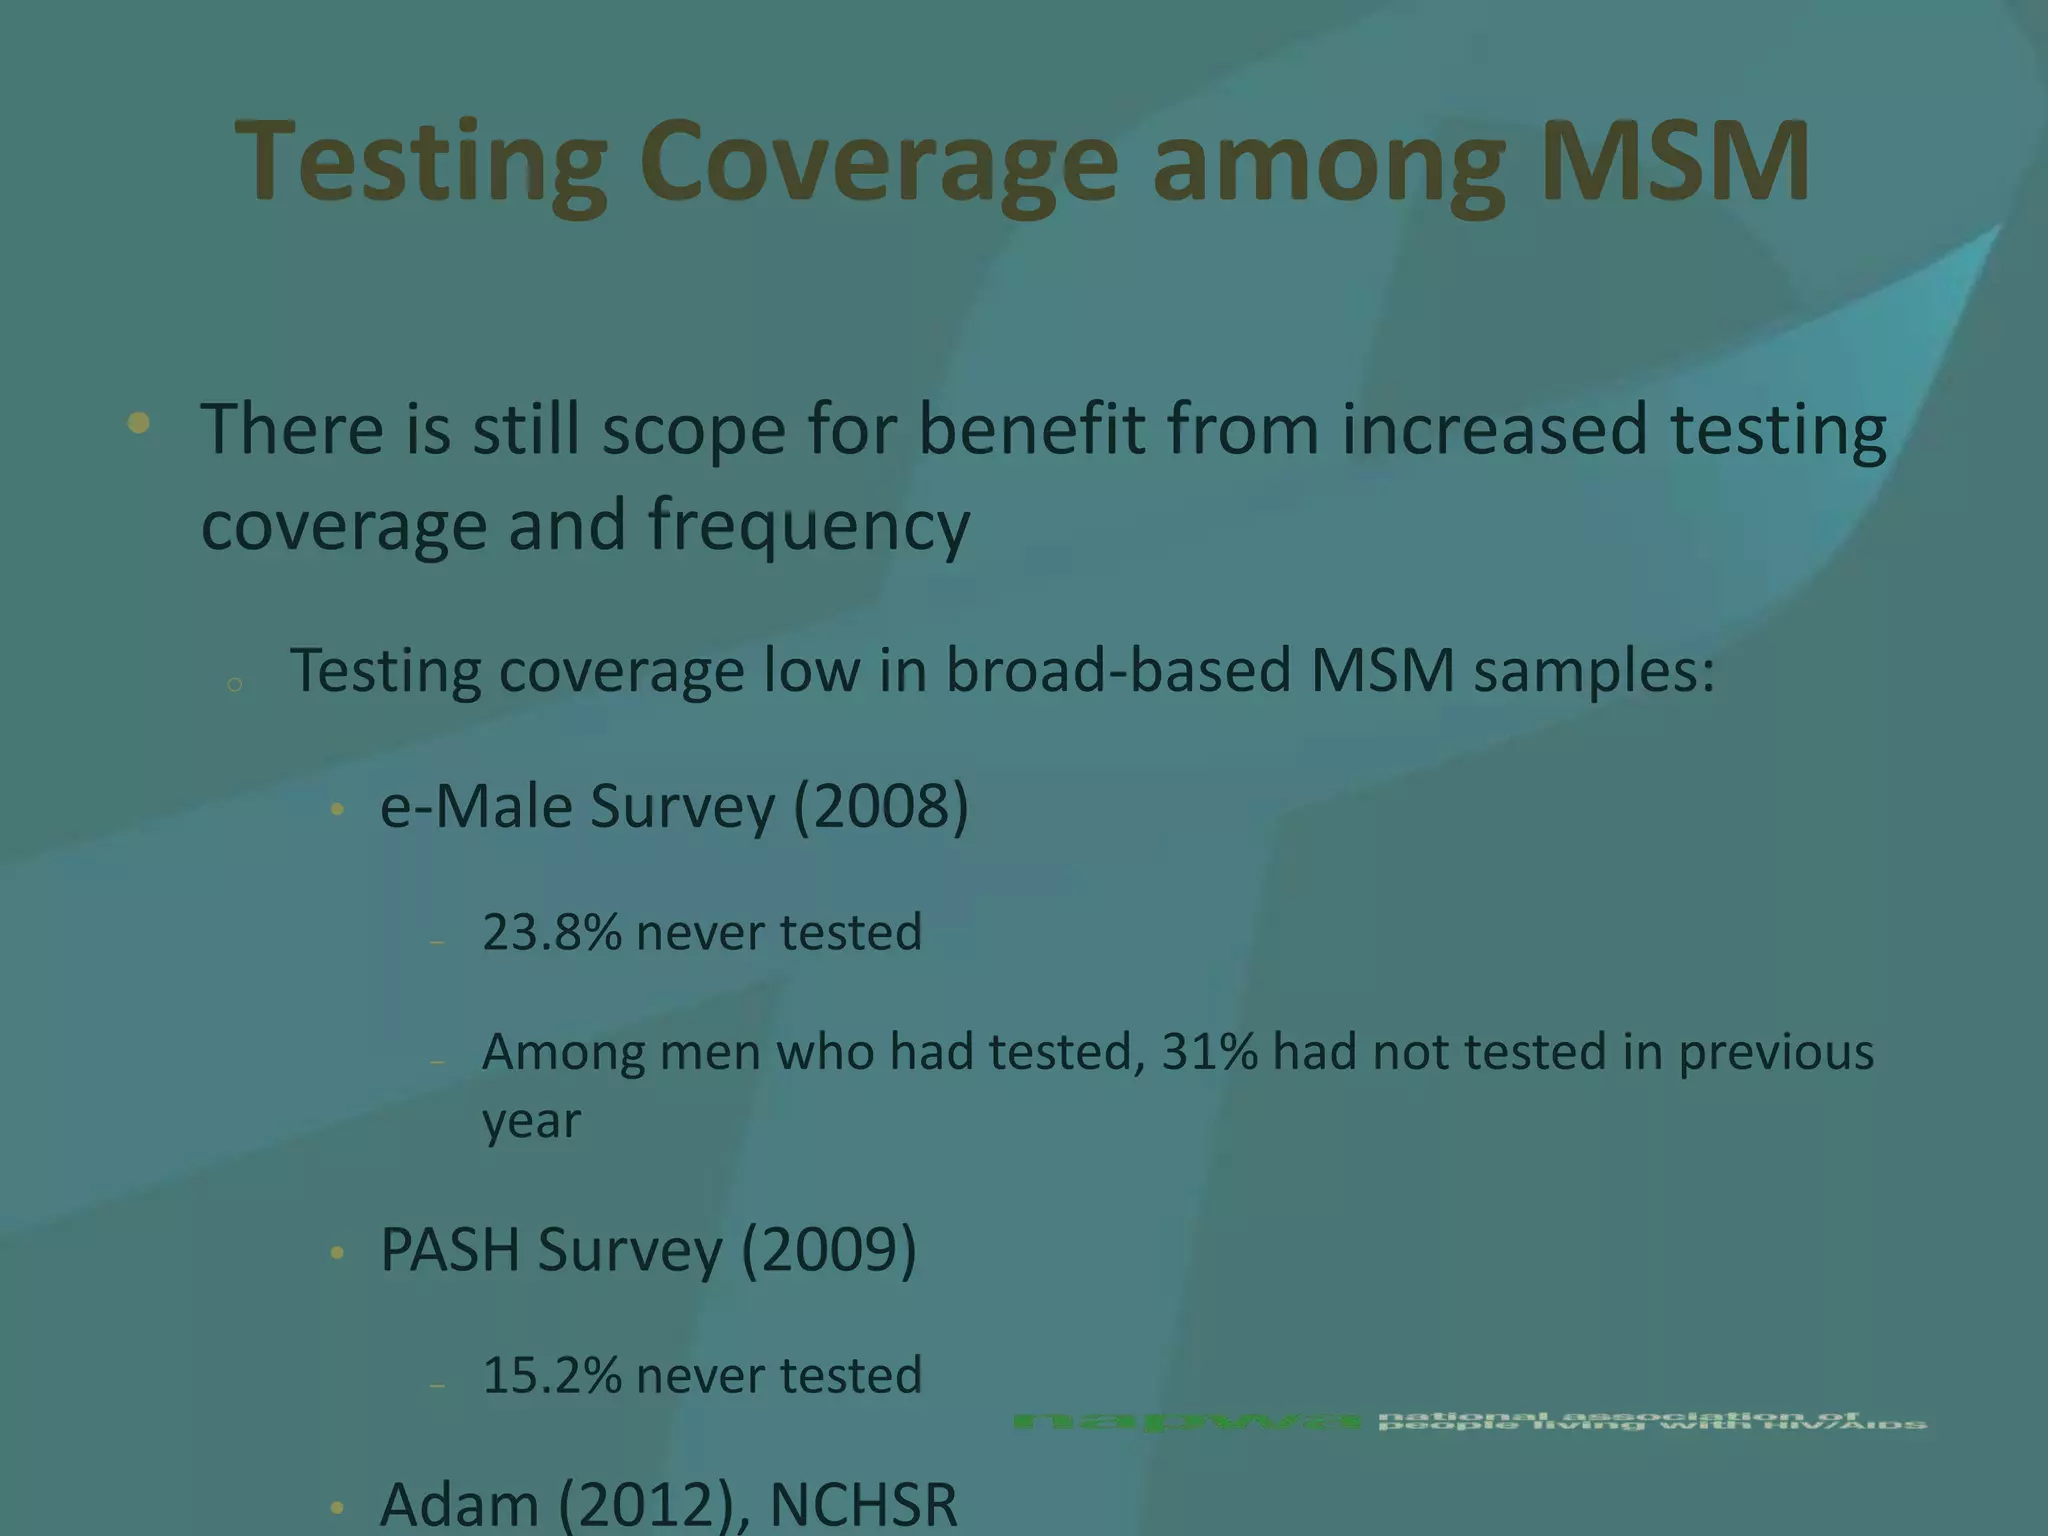
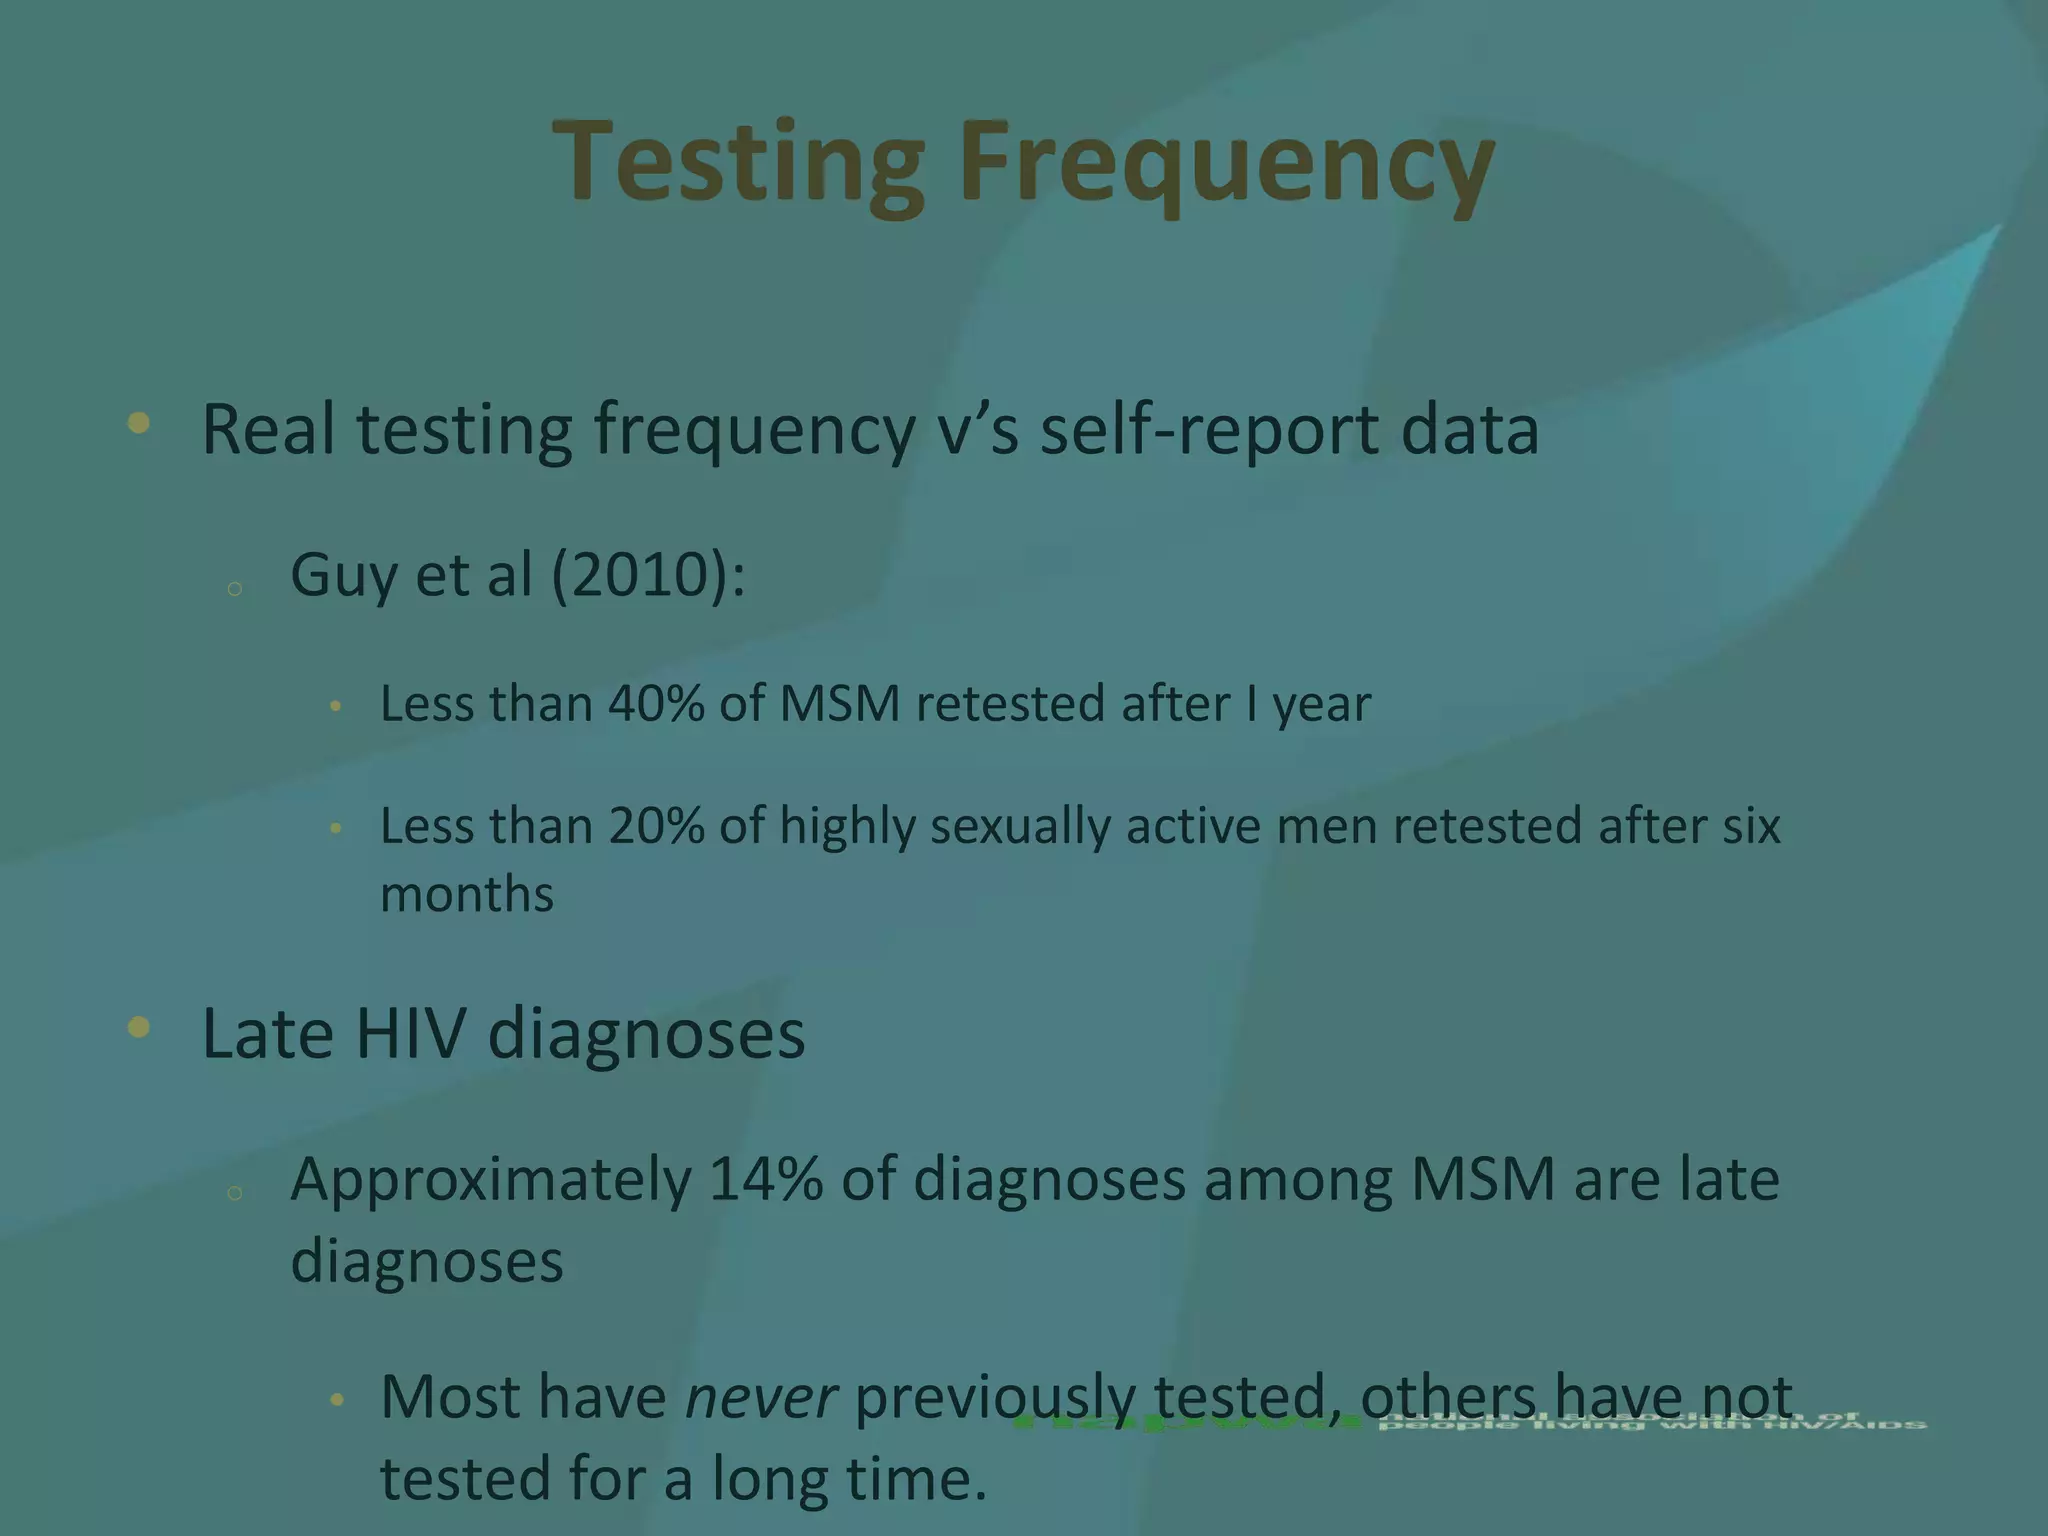
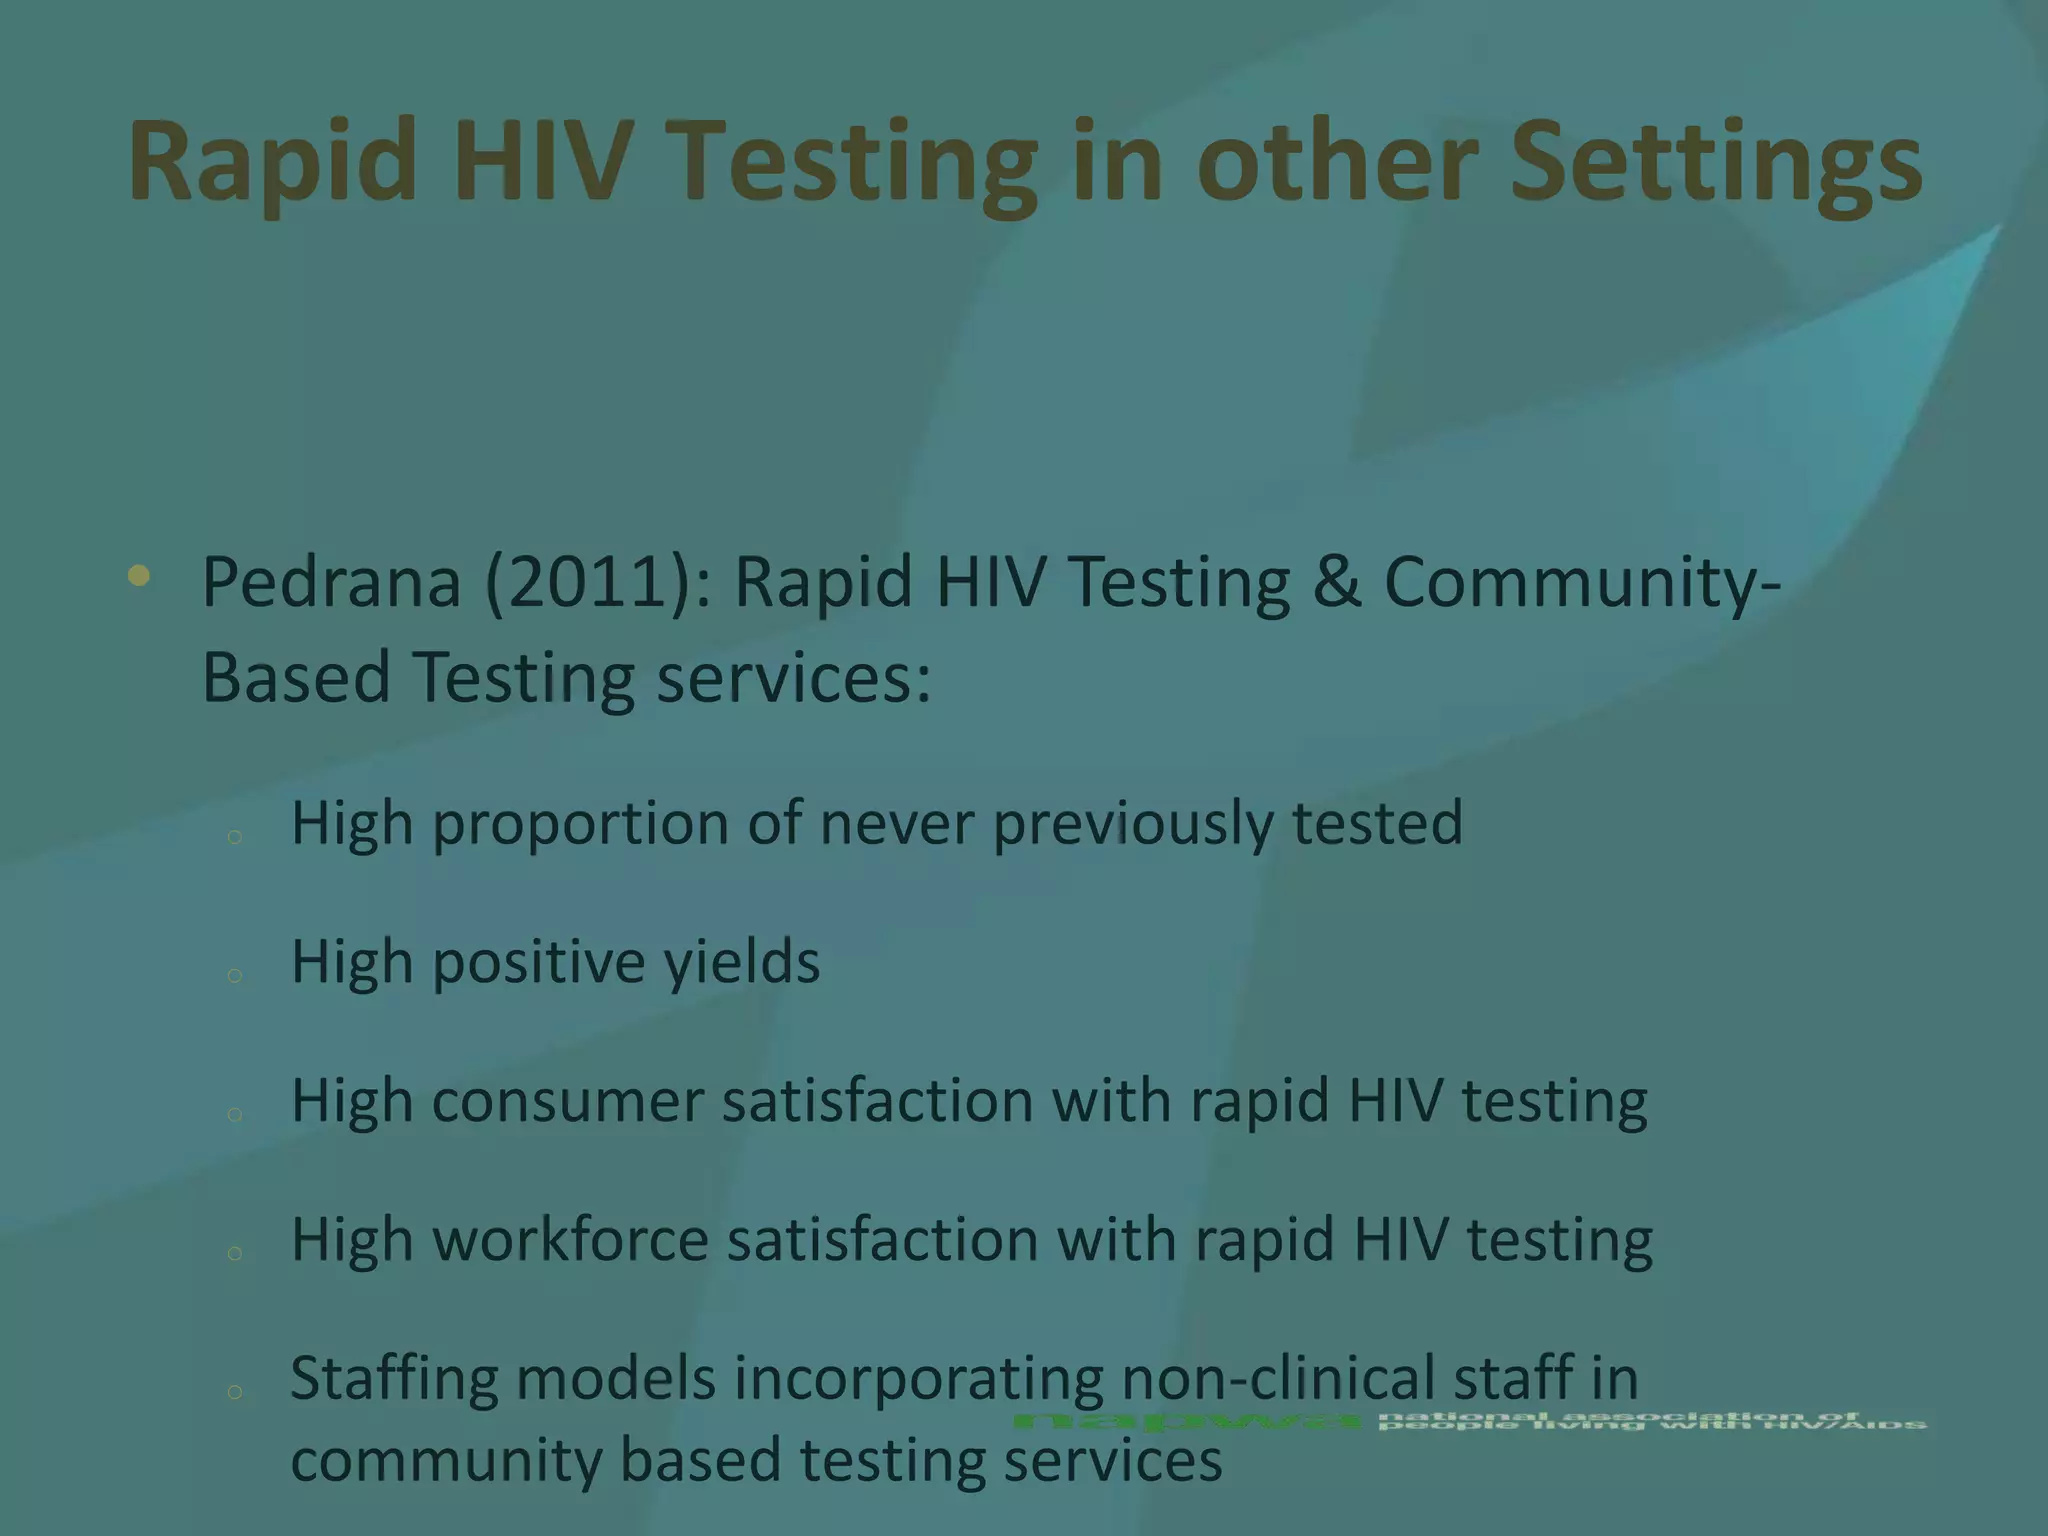
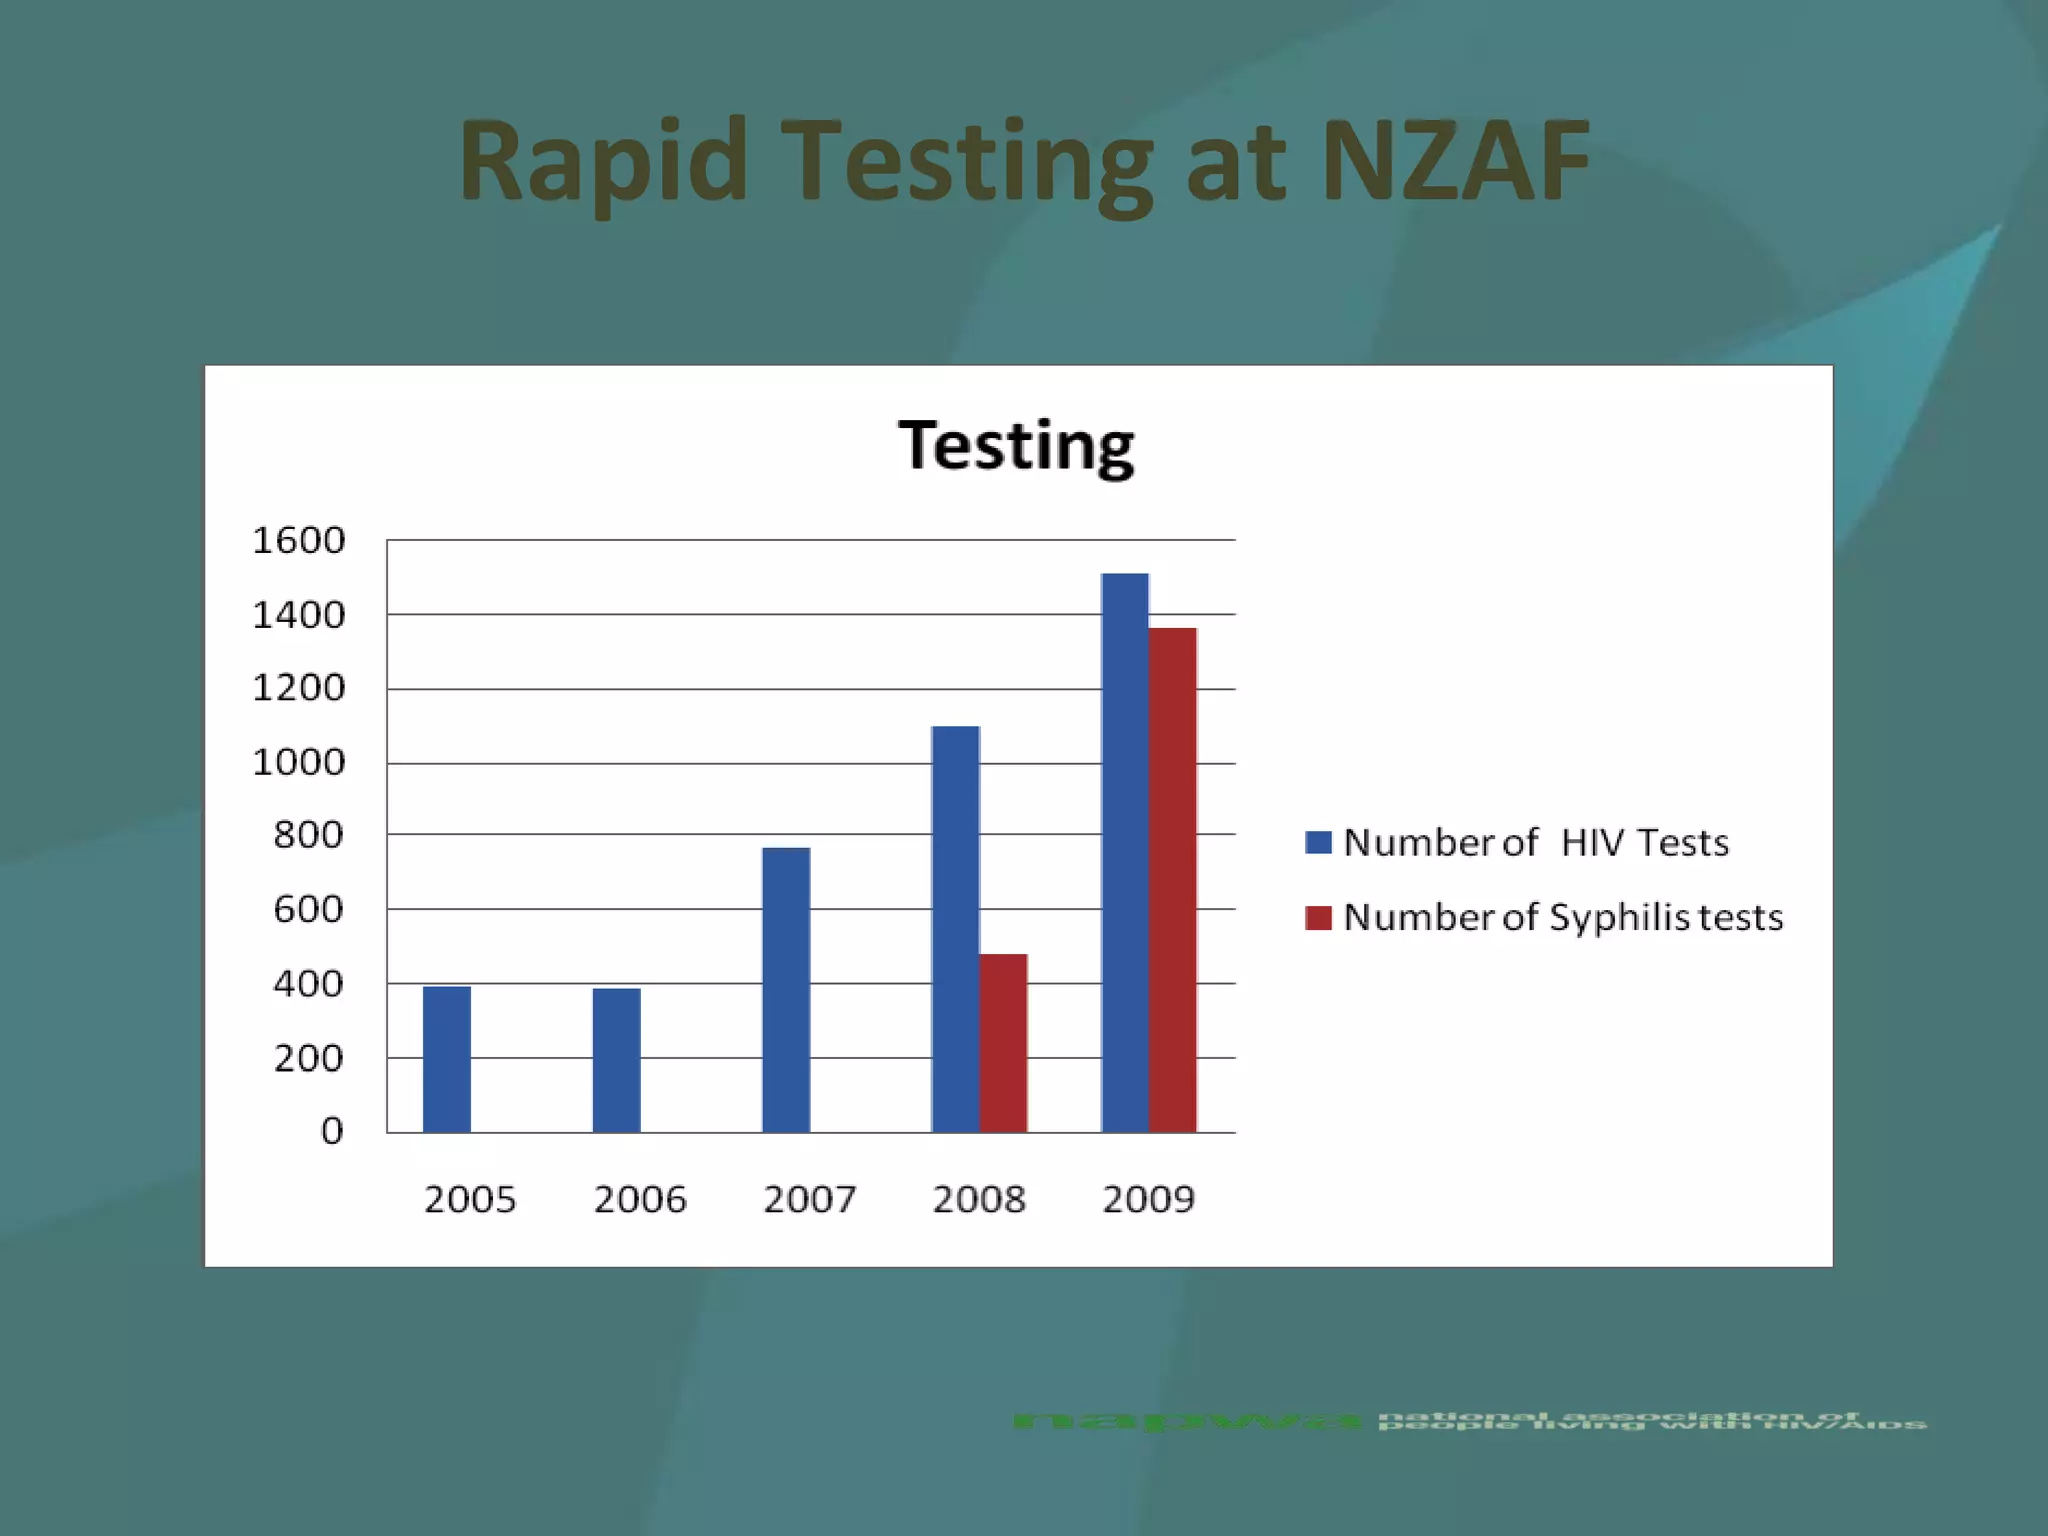
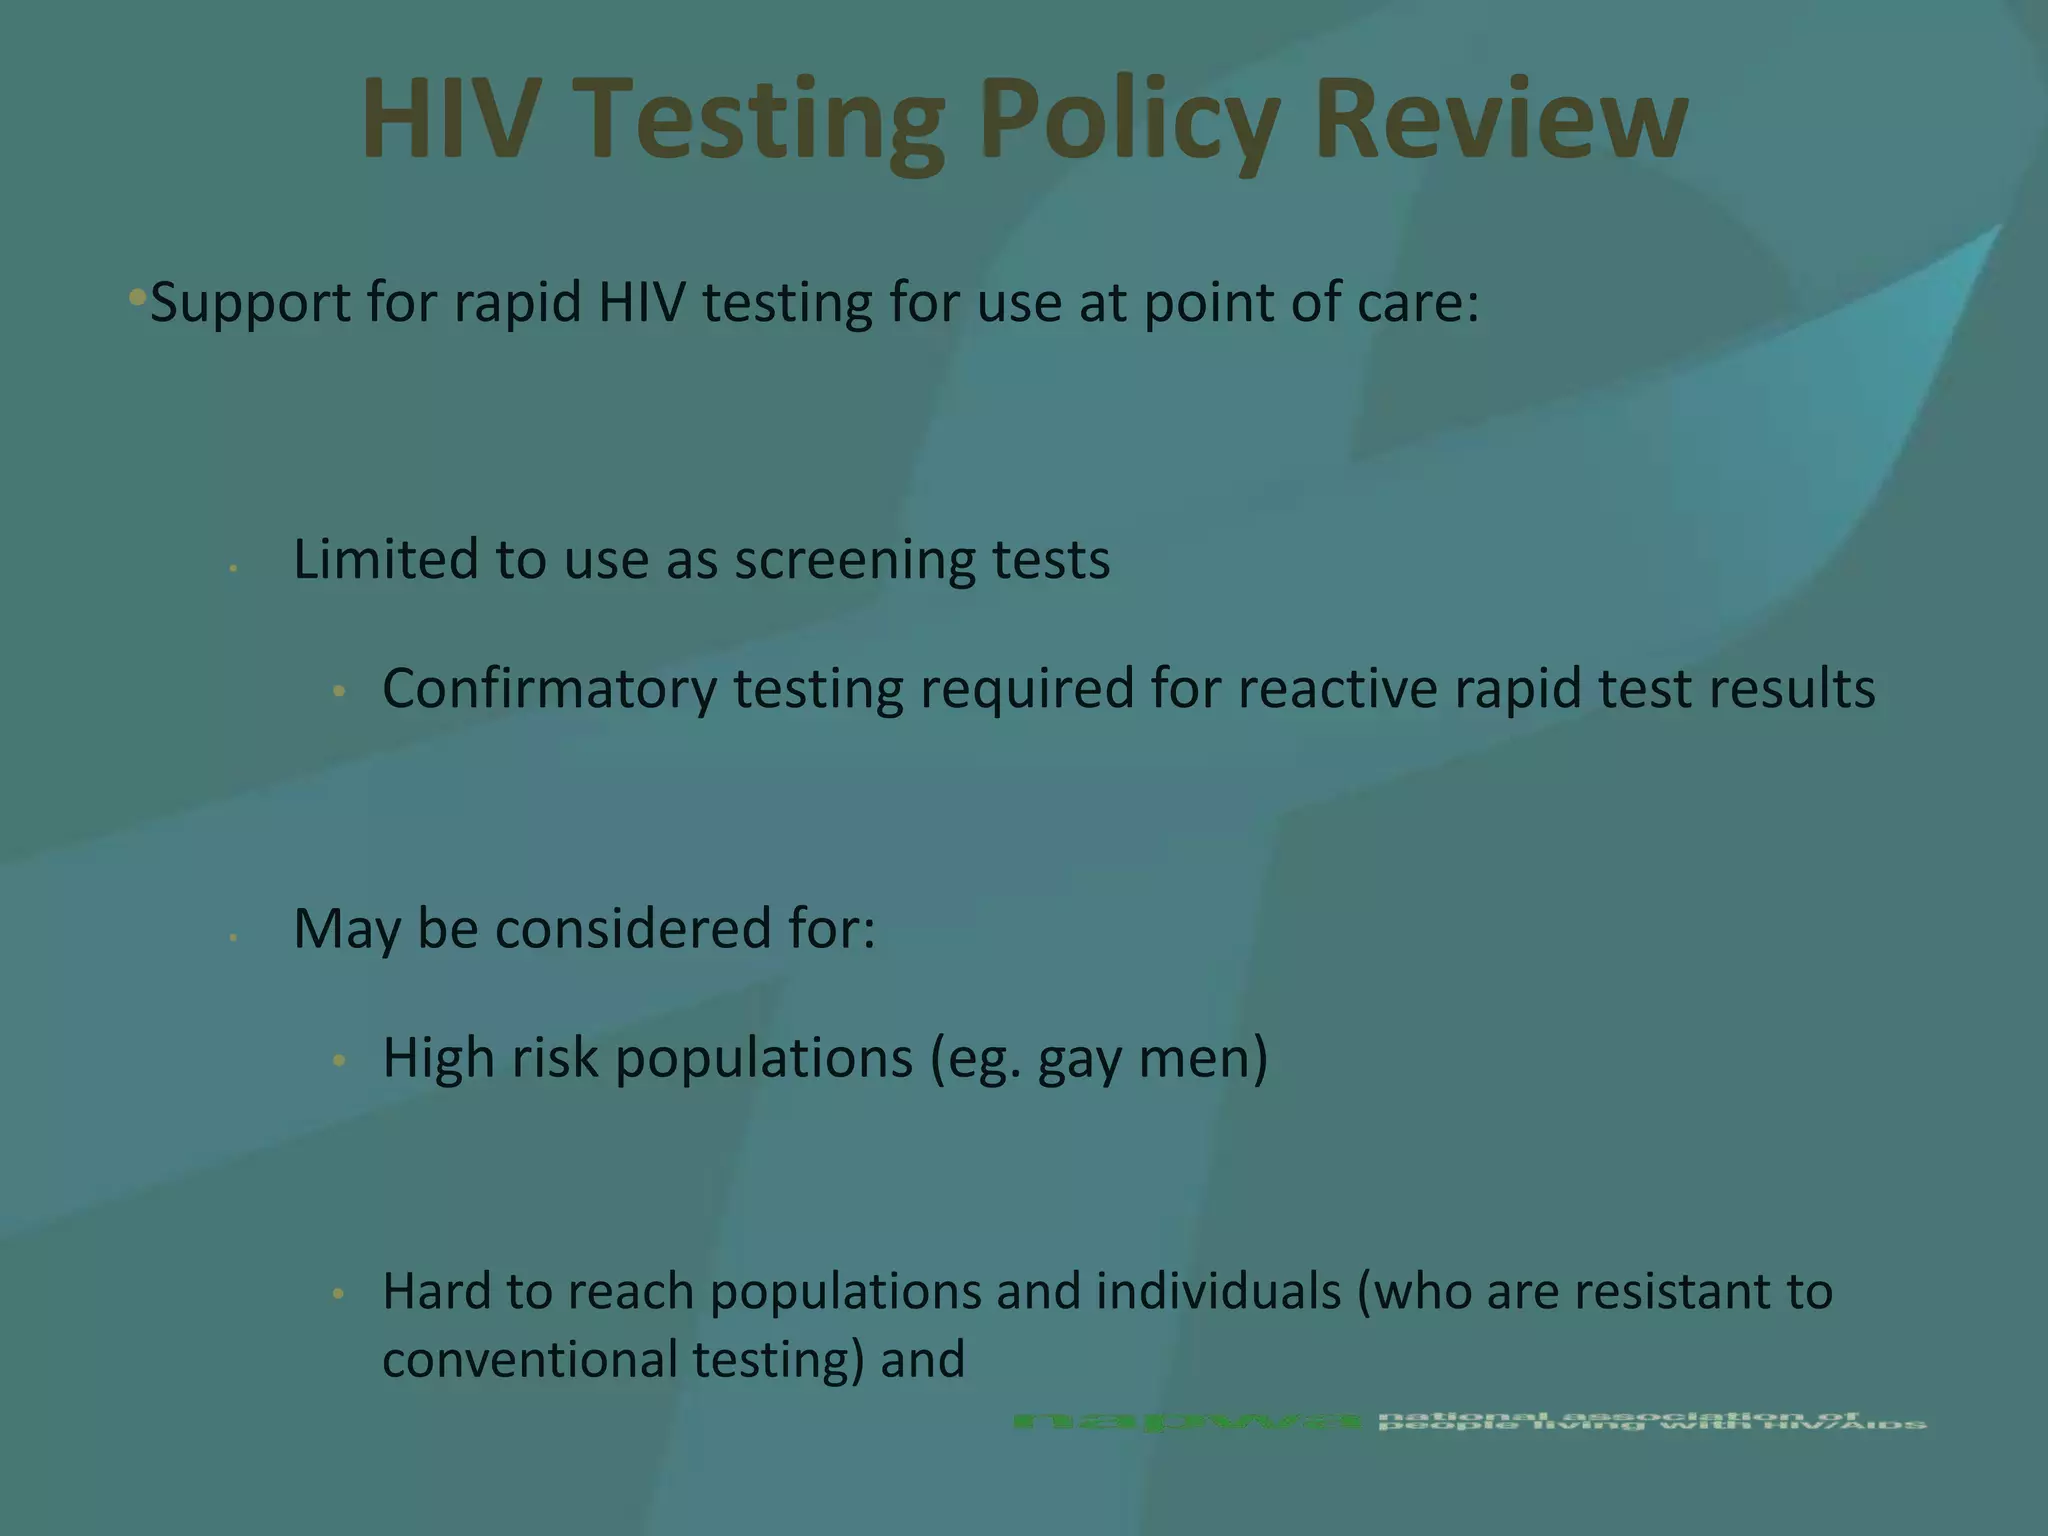
Rapid HIV Testing
                  &
          Scaling Up Testing

Phillip Keen
phillip@napwa.org.au
May 2012
Overview
• Why rapid HIV testing?


• Where to now on rapid HIV testing


• National HIV Testing Policy Review


• Scaling up testing
UNPD Targets
• Need to scale up testing coverage and
  frequency:
      New technologies (eg. rapid HIV testing)
      Reorienting existing testing services
      New models for marketing & providing
       testing
         Community/peer-based
         Outreach
         (Home?)
Testing Coverage among MSM

• There is still scope for benefit from increased testing
  coverage and frequency
   o   Testing coverage low in broad-based MSM samples:
        •   e-Male Survey (2008)
             –   23.8% never tested

             –   Among men who had tested, 31% had not tested in previous
                 year

        •   PASH Survey (2009)
             –   15.2% never tested

        •   Adam (2012), NCHSR
Testing Frequency

• Real testing frequency v’s self-report data
   o   Guy et al (2010):
        •   Less than 40% of MSM retested after I year

        •   Less than 20% of highly sexually active men retested after six
            months

• Late HIV diagnoses
   o   Approximately 14% of diagnoses among MSM are late
       diagnoses
        •   Most have never previously tested, others have not
            tested for a long time.
Rapid HIV Testing in other Settings


• Pedrana (2011): Rapid HIV Testing & Community-
  Based Testing services:
  o   High proportion of never previously tested

  o   High positive yields

  o   High consumer satisfaction with rapid HIV testing

  o   High workforce satisfaction with rapid HIV testing

  o   Staffing models incorporating non-clinical staff in
      community based testing services
Rapid Testing at NZAF
HIV Testing Policy Review
•Support for rapid HIV testing for use at point of care:


    •   Limited to use as screening tests

         •   Confirmatory testing required for reactive rapid test results


    •   May be considered for:

         •   High risk populations (eg. gay men)


         •   Hard to reach populations and individuals (who are resistant to
             conventional testing) and
False Positives to True Positives

                                              Test Specificity

        Positive Yield                    99.5%                   99.8%

           1.5%                            1:3                    1:7.5
      (MSM in VPCNSS)
                                   (5 FP per 1000 tests)   (2 FP per 1000 tests)

           1.0%
   (Males @MSHC, 2009)                     1:2                     1:5

           0.1%
  (Females @MSHC, 2009)                    5:1                     2:1

            0.025%
(All females tested in Victoria,           20:1                    8:1
             2004)
Community based testing
• Scope for non-clinical staff to administer rapid
  tests:


  •   If State/Territory health department endorses organisation


  •   Staff must attend accredited training and achieve certification


  •   Service must have access to clinical support and
      venepuncture, and a relationship with a laboratory approved by
      the National Association of Testing Authorities (NATA)
What Now?

• Policy support for rapid testing at POC, but:


• No TGA licensed tests


• No Medicare funding for rapid test kits or
  procedures
Community Organisations
• What models for rapid testing make sense locally?
   •   Establish a new community based testing service?

        •   What planning needed?

        •   Partner with other services to offer rapid testing?

        •   Incorporate peer-based workers to some parts of testing
            services?


• Identify services well-placed to introduce rapid HIV testing
  and start talking to them


• Liaison with funders and other stakeholders to plan for the
HIV Educators & Counsellors
• Peer Educators & TreatAware Officers:
• Community Awareness about rapid HIV testing
    •   Limitations and benefits of rapid testing


• Participate in rapid testing service delivery
         •   Very different role for most

         •   What selection & training?


• Counsellors:
• Different issues in context of rapid HIV testing – e.g. anxiety while
Reorienting Services
• Opening hours


• Location


• One-stop testing
      Providing results by phone/email
Marketing
• Increasing HIV testing rates will be needed to
  reach new HIV Prevention and Targets


• Introducing rapid HIV testing represents an
  opportunity to re-frame HIV testing
Home Testing

• Home testing was not supported in the recent
 Australian HIV Testing Policy review


• UK: House of Lords Select Committee on HIV
 in the UK recommendations:
  o   Legalise home testing

  o   Establish a quality control system

  o   THT supports the above
Home Testing

• USA:
     Orasure application to FDA for home sales
     Study of home users found 93% sensitivity
      v's 99.3% when used by trained testers
     Expert panel unanimously supported
      approving home sales
     FDA decision expected soon
Outreach Testing

• Was not considered in detail in policy review


• Outreach testing trial may start soon in
  Sydney


• Community HIV sector doesn't have a well-
  developed position on outreach testing.
Thanks
Clinical Staff
• Should rapid testing be introduced?


• New procedures


• Training & staffing – clinicians or nurses?


• Relationship with NATA-approved laboratory
Policymakers
• Planning
  •   How and where should rapid testing be introduced to complement
      existing testing services?


  •   NSW Health Model - Point of Care Testing Working Group:

       •   ASHM

       •   Clinical & social research

       •   Community orgs

       •   Sexual health clinic director

       •   Counsellor
Policymakers II
• Funding

•   Public sexual health clinics and specialist community based testing
    services may be best placed to offer rapid HIV testing - but
    State/Territory funding covers most costs of public sexual health
    clinics and would need to for new community based testing services


• Cost barriers to introducing rapid testing in all
    settings until there is Medicare funding
         •   Public clinics: Currently some HIV testing costs recouped from
             Medicare
Policymakers III

• Funding support for trials of rapid HIV testing


• Trials are underway in public sexual health
  settings
     •   Test performance (sensitivity, specificity, NPV & PPV)

     •   Acceptability to clients

     •   Feasibility issues in clinics

     •   Any impact on testing frequency?
Researchers

• Tracking changes in testing patterns in the
  context of rapid testing


• Understanding the impact of rapid HIV testing
  on gay men’s sexual cultures
CD4 at start of cART (closest CD4
     with 6 months prior)
                Prior to 1 Jan
                    2006
                                     1 Jan 2006
                                      onwards            Overall
      Total         1882                 427              2309
      Mean               327.9                324.0          327.1
      SD                 242.4                193.5          234.1
      Median             288.5                  294             290
      25th                 150                  200             160
      75th                 450                  422             445
                n (%)            n (%)                n (%)
      250-349   347 (18.4)       101 (23.6)           448 (19.4)
      <250      787 (41.8)       161 (37.7)           948 (41.1)
      >=350     748 (39.7)       165 (38.6)           913 (39.5)
CD4 Decline Following
          Seroconversion
• CASCADE Study (Europe n. = 18,495)
        CD4 Level      Median time following
                         Seroconversion
           500              1.19 years

           350              4.19 years

           200              7.93 years
Treatments Uptake Needed

• Rapid increases in treatments uptake occurred
  1996-1998 (20% > 70%)

    Year      Estimated    Proportion    Population   Additional
              Population    on ARVs     not on ARVs   needed if
                                                        90%

    2010        21,391        70%          6,417        4,278


    2011        22,391        70%          6,717       4,478
Challenges
• Costs of access
• Costs of multiple medications / management
  interventions
• Complexity of access to prescriber / dispensing
  arrangements
• Dr concerns re adherence
• Dr concerns re lifelong treatment commitments
• Concern re impact of side effects
• Other Patient barriers
Increased cost sharing
• 1. Lower rates of drug treatment / selective Rx
• 2. Diminished adherence among existing pts
• 3. More frequent discontinuation of therapy
• 4. Affect likelihood of pt to seek care
• Summary point
• For each 10% increase in cost
  sharing, prescription drug spending decreases
Issues – Pt involvement

• 35% started treatment within a year of
  diagnosis
• Majority waiting more than a year btwn
  diagnosis and initiating
• Reasons
• 47% - Dr’s decision to wait*
• 27% - Pt Unsure about starting
• *Age split: Under 50 – 52% / Over 50 - 18%
Issues - Access

• Access has costs
• PBS drugs have pt contributions $35.40 /
  $5.80 per script
• Safety net $1281.30 / $324.00
• Pt experience survey – PCR (ABS) 2009
• 9.7 % delay or reject filling a script (general
  pop)
HIV population
• 30% live below poverty line
• 40% rely on a govt benefit
• Chronic disease management increasingly
  complex within the ageing population
• Medicare not covering cost of most non
  medical treatments, or increasingly newer
  procedures
Issues - Access

• Chronic Illness
• - regardless of income levels spending up to
  30% of household income on medications
• Plhiv (Futures 6) (n = 1100)
• - 42% report major source of income as Govt
  support
• 31% report living below poverty line levels
Issues - Access
• BGF Survey (2010)
• PLHIV respondents struggling to access
  treatment
• 46% - HIV medications
• 60% - Other prescribed medications
• Hardship requires people to make decisions
  between care and basic living expenses
Patient Concerns

• Concern about side effects
• Lifelong treatment
• Lack of readiness
• Pt perception ARV are bad for you
• Dislike of taking (Reminder)
• Commencing Rx means health has declined
• Impact on lifestyle
Issues – Pt Attitudes

• 70%(ATLIS) to 80% (Futures) of treating
  population believe that ARVs mean better
  prospects for themselves
• 39% (ATLIS) & 30% (Futures)- Negative beliefs
  such as “harmful” and impacts outweighing
  benefit to QOL.
• Reminder of status / fear of disclosure
  (includes access issues to care / drugs)
Psychological barriers
“Commencing was terrifying. I was scared and the night before I
started I was a mess. Initial physical reaction was minimal so that was
a relief. Changing meds is also a scary thought which I am trying to
avoid” (ARCSHS Tracking Changes, 2011)


“I had thought it would be difficult for me to commence meds since this
would be an acknowledgment of the progression of my HIV. However
since starting my meds I have found that a lot of small irritating
conditions have cleared up and my overall health is significantly
improved. I'm just grateful every day that the meds exist!” (ARCSHS
Tracking Changes, 2011)
What are the outcomes

• Therapeutic Treatment coverage and
  maintenance will improve individual health
• Secondary prevention impacts will follow
• Dynamics across other Strategies and within
  the BBVSS framework benefits shared
• As fast as knowledge is acquired it must be
  applied (NHMRC Research Translation goal)
ROI

• Base policy options on evidence base of
  current data + the value of treatments to
  community
• Environment of community acceptability with
  drive to resolve barriers or disincentives for
  individuals
• National Strategy could be adapted to this
  expansive vision
Economic analysis

• NSW – 50% Gay + men initiated Treatment at
  diagnosis then minimum 10 % - up to 22% of
  new infections would be averted
• $14,000 annually on HIV therapy
• One infection over a lifetime costs Govt
  $700,000
• Data build to show nationally if a program
  targets people who would otherwise have not
  received therapy, it would be cost effective,
Success of Test and Treat in San Francisco? Reduced Time to Virologic
           Suppression, Decreased Community Viral Load,
              and Fewer New HIV Infections, 2004-2009
               M Das, P Chu, G-M Santos, S Scheer, W McFarland, E Vittinghoff, G Colfax
   Minimum, Most Recent, Maximum CVL and Newly
         Diagnosed and Reported HIV cases
Where can we do more?
   Testing
   Treatments uptake
   Community Mobilisation
   PrEP + PEP
   Targeting Primary Infection

   Targeting Late HIV
   Diagnoses
   Specific actions to reduce
   heterosexual transmissions
HIV diagnoses, 2006 --
2010, by HIV exposure
       category


               Source: State and Territory health authorities
Newly diagnosed HIV among men who report an exposure other than
  sex with men, 2001 – 2010, by year and HIV exposure category

          80


          60


 Num be r 40


          20


           0
                                  Y ear


                                          Source: State and Territory health authorities
Newly diagnosed HIV among women, 2001 – 2010, by year
              and HIV exposure category


                                 Source: State and Territory health authorities
Reducing Heterosexual
             Transmissions
• Diagnosing
  o   Expand ASHM mentoring project
  o   Clinical markers (eg oral candidiasis)
  o   Populations focus – people from high prevalence
      countries & partners
  o   Clusters (swingers)


• Serodiscordant couples
Peer base

• Community information
• Informed by community
• Drivers / influence
• Nuances
• Sophisticated (Persistence/ Resilience)
• Strength of peer ownership / partnership
• Acceptability / thresholds of tolerance &
Community Mobilisation

• Gay community
   o   High profile social marketing initiatives to suggest a period
       of concerted community action

   o   Seek support from gay community leadership


• Disproportionate contributions to new diagnoses
  from:
   o   Men in serodicordant relationships

   o   Sexually adventurous men
Targeting Late HIV Diagnoses

• NAPWA believes there is scope to reduce late
  HIV diagnoses among MSM, heterosexuals
  and CALD.
CD4+ cell count at HIV diagnosis,
2001 – 2010, by year

                     Click to edit the outline
                      text format
                         Second Outline
                          Level
                            Third Outline
                            Level
                                Fourth Outline
                                 Level
                                        Fifth
                                        Outline
                                        Level
                            Source: State and Territory health authorities
What proportion of ‘late’ HIV
   diagnoses are MSM?
Late HIV Diagnoses Actions

• Reduce structural and psychological barriers
  to testing


• Encourage primary health services to offer
  testing to populations at increased risk.
  o   Low caseload GPs in areas of high HIV prevalence
      – offer testing to MSM
  o   GPs and community health services working with
      CALD populations at increased risk
Need data for targets

• Variable treatment patterns across sub groups
• Attitudes and beliefs are wide ranging and
  complex
• Motivations and drivers critical
• Campaigns need to be diverse and different
  mediums – websites, blogs and social media
Should we expect an initial
     increase in HIV Diagnoses?
    Population             Undiagnosed Click to edit the outline
                                           Undiagnosed
       Size                   (10%)    text format
                                               (20%)

     22,391 (1)                 2,239            Second Outline
                                                      4,478
                                                  Level
                                                       Third Outline
•
                                                       Level
    (1) Estimate of the number of people living with HIV in Australia as at
    31/12/2010 plus 1,000 (estimated number of new diagnoses in 2011)
                                                           Fourth Outline
•                                                           Level
    The estimates of the proportion of the PLHIV population that are
    undiagnosed are from Mapping HIV Outcomes: Geographical and clinical
                                                                  Fifth
    forecasts of numbers of people living with HIV in Australia (NCHECR/NAPWA,
    2010)
                                                                  Outline
•   If testing coverage and frequency increase, there may be anLevel
                                                                  initial spike in
A package

• Targets disease prevention


• Targets access inequities


• Targets continuity of care
Targets are a package

• They bring other dynamics and roll on effects
• National HIV strategy links
• The momentum brings energy and focus
• Forward to future yrs and see results
• Health and well being of a population is what
  fosters other secondary benefits, such as
  prevention and broader BBVSS health
  maintenance
Setting Targets

• Set targets based on the number of people it
  will positively affect.
• Planning should be optimistic and lead with
  positive frameworks for what you can do and
  what potentials there are to truly transform
Targets and Reduced Diagnoses
Exposure Category   2010 Diagnoses   50% Reduction
                                        Click to edit theReduction
                                                       80%
                                                           outline
MSM + MSM & IDU          621
                                         text format
                                          (311)            124

  Heterosexual           289                Second Outline
                                          145

       IDU               25                 Level
                                           13

  All Categories        1,043                    Third Outline
                                                 Level
  • An 80% reduction in MSM diagnoses and a 50% reduction
                                               Fourth Outline
     in heterosexual, IDU and other categories would result in
                                                Level
     approximately 335 annual diagnoses, which is a 68%
     reduction overall on the 1,043 diagnoses in 2010.
                                                   Fifth
                                                      Outline
                                                      Level
Opportunities
• Emerging combination prevention options offer the best
  chance in thirty years to drive infections down


• We have to seize the moment – ‘wait and see’ isn’t an option


• Signing up to ambitious (but not unrealistic) 2015 targets will
  provide the galvanising factor
Thanks
End here?

• End?
• Jo, following slides are in case you want to
  keep them and move them back up into the
  presentation
Implications

• Targeted sub groups may require varied
  interventions
• Health maintenance not just understood as
  clinical benefits
• Must be peer driven and focused
• Need to measure national against state
  analysis
Treatments Uptake
• Reducing barriers to treatment
   o   Dispensing arrangements

   o   Co-payments

        •   Difficulties obtaining medication and co-payments
            associated with stopping ARVs (ARCSHS Tracking
            Changes, 2011)


• ATRAS and other Medicare Ineligibles


• Addressing Psychological barriers to initiating treatment
Self reporting

• Actual utilisation vs self reported levels
• - Both testing – but also treating, and
  maintenance

Rapid HIV Testing & Scaling Up Testing

  • 1.
    Rapid HIV Testing & Scaling Up Testing Phillip Keen phillip@napwa.org.au May 2012
  • 2.
    Overview • Why rapidHIV testing? • Where to now on rapid HIV testing • National HIV Testing Policy Review • Scaling up testing
  • 3.
    UNPD Targets • Needto scale up testing coverage and frequency:  New technologies (eg. rapid HIV testing)  Reorienting existing testing services  New models for marketing & providing testing Community/peer-based Outreach (Home?)
  • 4.
    Testing Coverage amongMSM • There is still scope for benefit from increased testing coverage and frequency o Testing coverage low in broad-based MSM samples: • e-Male Survey (2008) – 23.8% never tested – Among men who had tested, 31% had not tested in previous year • PASH Survey (2009) – 15.2% never tested • Adam (2012), NCHSR
  • 5.
    Testing Frequency • Realtesting frequency v’s self-report data o Guy et al (2010): • Less than 40% of MSM retested after I year • Less than 20% of highly sexually active men retested after six months • Late HIV diagnoses o Approximately 14% of diagnoses among MSM are late diagnoses • Most have never previously tested, others have not tested for a long time.
  • 6.
    Rapid HIV Testingin other Settings • Pedrana (2011): Rapid HIV Testing & Community- Based Testing services: o High proportion of never previously tested o High positive yields o High consumer satisfaction with rapid HIV testing o High workforce satisfaction with rapid HIV testing o Staffing models incorporating non-clinical staff in community based testing services
  • 7.
  • 8.
    HIV Testing PolicyReview •Support for rapid HIV testing for use at point of care: • Limited to use as screening tests • Confirmatory testing required for reactive rapid test results • May be considered for: • High risk populations (eg. gay men) • Hard to reach populations and individuals (who are resistant to conventional testing) and
  • 9.
    False Positives toTrue Positives Test Specificity Positive Yield 99.5% 99.8% 1.5% 1:3 1:7.5 (MSM in VPCNSS) (5 FP per 1000 tests) (2 FP per 1000 tests) 1.0% (Males @MSHC, 2009) 1:2 1:5 0.1% (Females @MSHC, 2009) 5:1 2:1 0.025% (All females tested in Victoria, 20:1 8:1 2004)
  • 10.
    Community based testing •Scope for non-clinical staff to administer rapid tests: • If State/Territory health department endorses organisation • Staff must attend accredited training and achieve certification • Service must have access to clinical support and venepuncture, and a relationship with a laboratory approved by the National Association of Testing Authorities (NATA)
  • 12.
    What Now? • Policysupport for rapid testing at POC, but: • No TGA licensed tests • No Medicare funding for rapid test kits or procedures
  • 13.
    Community Organisations • Whatmodels for rapid testing make sense locally? • Establish a new community based testing service? • What planning needed? • Partner with other services to offer rapid testing? • Incorporate peer-based workers to some parts of testing services? • Identify services well-placed to introduce rapid HIV testing and start talking to them • Liaison with funders and other stakeholders to plan for the
  • 14.
    HIV Educators &Counsellors • Peer Educators & TreatAware Officers: • Community Awareness about rapid HIV testing • Limitations and benefits of rapid testing • Participate in rapid testing service delivery • Very different role for most • What selection & training? • Counsellors: • Different issues in context of rapid HIV testing – e.g. anxiety while
  • 15.
    Reorienting Services • Openinghours • Location • One-stop testing  Providing results by phone/email
  • 16.
    Marketing • Increasing HIVtesting rates will be needed to reach new HIV Prevention and Targets • Introducing rapid HIV testing represents an opportunity to re-frame HIV testing
  • 23.
    Home Testing • Hometesting was not supported in the recent Australian HIV Testing Policy review • UK: House of Lords Select Committee on HIV in the UK recommendations: o Legalise home testing o Establish a quality control system o THT supports the above
  • 24.
    Home Testing • USA:  Orasure application to FDA for home sales  Study of home users found 93% sensitivity v's 99.3% when used by trained testers  Expert panel unanimously supported approving home sales  FDA decision expected soon
  • 25.
    Outreach Testing • Wasnot considered in detail in policy review • Outreach testing trial may start soon in Sydney • Community HIV sector doesn't have a well- developed position on outreach testing.
  • 26.
  • 27.
    Clinical Staff • Shouldrapid testing be introduced? • New procedures • Training & staffing – clinicians or nurses? • Relationship with NATA-approved laboratory
  • 28.
    Policymakers • Planning • How and where should rapid testing be introduced to complement existing testing services? • NSW Health Model - Point of Care Testing Working Group: • ASHM • Clinical & social research • Community orgs • Sexual health clinic director • Counsellor
  • 29.
    Policymakers II • Funding • Public sexual health clinics and specialist community based testing services may be best placed to offer rapid HIV testing - but State/Territory funding covers most costs of public sexual health clinics and would need to for new community based testing services • Cost barriers to introducing rapid testing in all settings until there is Medicare funding • Public clinics: Currently some HIV testing costs recouped from Medicare
  • 30.
    Policymakers III • Fundingsupport for trials of rapid HIV testing • Trials are underway in public sexual health settings • Test performance (sensitivity, specificity, NPV & PPV) • Acceptability to clients • Feasibility issues in clinics • Any impact on testing frequency?
  • 31.
    Researchers • Tracking changesin testing patterns in the context of rapid testing • Understanding the impact of rapid HIV testing on gay men’s sexual cultures
  • 32.
    CD4 at startof cART (closest CD4 with 6 months prior) Prior to 1 Jan 2006 1 Jan 2006 onwards Overall Total 1882 427 2309 Mean 327.9 324.0 327.1 SD 242.4 193.5 234.1 Median 288.5 294 290 25th 150 200 160 75th 450 422 445 n (%) n (%) n (%) 250-349 347 (18.4) 101 (23.6) 448 (19.4) <250 787 (41.8) 161 (37.7) 948 (41.1) >=350 748 (39.7) 165 (38.6) 913 (39.5)
  • 33.
    CD4 Decline Following Seroconversion • CASCADE Study (Europe n. = 18,495) CD4 Level Median time following Seroconversion 500 1.19 years 350 4.19 years 200 7.93 years
  • 34.
    Treatments Uptake Needed •Rapid increases in treatments uptake occurred 1996-1998 (20% > 70%) Year Estimated Proportion Population Additional Population on ARVs not on ARVs needed if 90% 2010 21,391 70% 6,417 4,278 2011 22,391 70% 6,717 4,478
  • 35.
    Challenges • Costs ofaccess • Costs of multiple medications / management interventions • Complexity of access to prescriber / dispensing arrangements • Dr concerns re adherence • Dr concerns re lifelong treatment commitments • Concern re impact of side effects • Other Patient barriers
  • 36.
    Increased cost sharing •1. Lower rates of drug treatment / selective Rx • 2. Diminished adherence among existing pts • 3. More frequent discontinuation of therapy • 4. Affect likelihood of pt to seek care • Summary point • For each 10% increase in cost sharing, prescription drug spending decreases
  • 37.
    Issues – Ptinvolvement • 35% started treatment within a year of diagnosis • Majority waiting more than a year btwn diagnosis and initiating • Reasons • 47% - Dr’s decision to wait* • 27% - Pt Unsure about starting • *Age split: Under 50 – 52% / Over 50 - 18%
  • 38.
    Issues - Access •Access has costs • PBS drugs have pt contributions $35.40 / $5.80 per script • Safety net $1281.30 / $324.00 • Pt experience survey – PCR (ABS) 2009 • 9.7 % delay or reject filling a script (general pop)
  • 39.
    HIV population • 30%live below poverty line • 40% rely on a govt benefit • Chronic disease management increasingly complex within the ageing population • Medicare not covering cost of most non medical treatments, or increasingly newer procedures
  • 40.
    Issues - Access •Chronic Illness • - regardless of income levels spending up to 30% of household income on medications • Plhiv (Futures 6) (n = 1100) • - 42% report major source of income as Govt support • 31% report living below poverty line levels
  • 41.
    Issues - Access •BGF Survey (2010) • PLHIV respondents struggling to access treatment • 46% - HIV medications • 60% - Other prescribed medications • Hardship requires people to make decisions between care and basic living expenses
  • 42.
    Patient Concerns • Concernabout side effects • Lifelong treatment • Lack of readiness • Pt perception ARV are bad for you • Dislike of taking (Reminder) • Commencing Rx means health has declined • Impact on lifestyle
  • 43.
    Issues – PtAttitudes • 70%(ATLIS) to 80% (Futures) of treating population believe that ARVs mean better prospects for themselves • 39% (ATLIS) & 30% (Futures)- Negative beliefs such as “harmful” and impacts outweighing benefit to QOL. • Reminder of status / fear of disclosure (includes access issues to care / drugs)
  • 44.
    Psychological barriers “Commencing wasterrifying. I was scared and the night before I started I was a mess. Initial physical reaction was minimal so that was a relief. Changing meds is also a scary thought which I am trying to avoid” (ARCSHS Tracking Changes, 2011) “I had thought it would be difficult for me to commence meds since this would be an acknowledgment of the progression of my HIV. However since starting my meds I have found that a lot of small irritating conditions have cleared up and my overall health is significantly improved. I'm just grateful every day that the meds exist!” (ARCSHS Tracking Changes, 2011)
  • 45.
    What are theoutcomes • Therapeutic Treatment coverage and maintenance will improve individual health • Secondary prevention impacts will follow • Dynamics across other Strategies and within the BBVSS framework benefits shared • As fast as knowledge is acquired it must be applied (NHMRC Research Translation goal)
  • 46.
    ROI • Base policyoptions on evidence base of current data + the value of treatments to community • Environment of community acceptability with drive to resolve barriers or disincentives for individuals • National Strategy could be adapted to this expansive vision
  • 47.
    Economic analysis • NSW– 50% Gay + men initiated Treatment at diagnosis then minimum 10 % - up to 22% of new infections would be averted • $14,000 annually on HIV therapy • One infection over a lifetime costs Govt $700,000 • Data build to show nationally if a program targets people who would otherwise have not received therapy, it would be cost effective,
  • 48.
    Success of Testand Treat in San Francisco? Reduced Time to Virologic Suppression, Decreased Community Viral Load, and Fewer New HIV Infections, 2004-2009 M Das, P Chu, G-M Santos, S Scheer, W McFarland, E Vittinghoff, G Colfax Minimum, Most Recent, Maximum CVL and Newly Diagnosed and Reported HIV cases
  • 49.
    Where can wedo more? Testing Treatments uptake Community Mobilisation PrEP + PEP Targeting Primary Infection Targeting Late HIV Diagnoses Specific actions to reduce heterosexual transmissions
  • 50.
    HIV diagnoses, 2006-- 2010, by HIV exposure category Source: State and Territory health authorities
  • 51.
    Newly diagnosed HIVamong men who report an exposure other than sex with men, 2001 – 2010, by year and HIV exposure category 80 60 Num be r 40 20 0 Y ear Source: State and Territory health authorities
  • 52.
    Newly diagnosed HIVamong women, 2001 – 2010, by year and HIV exposure category Source: State and Territory health authorities
  • 53.
    Reducing Heterosexual Transmissions • Diagnosing o Expand ASHM mentoring project o Clinical markers (eg oral candidiasis) o Populations focus – people from high prevalence countries & partners o Clusters (swingers) • Serodiscordant couples
  • 54.
    Peer base • Communityinformation • Informed by community • Drivers / influence • Nuances • Sophisticated (Persistence/ Resilience) • Strength of peer ownership / partnership • Acceptability / thresholds of tolerance &
  • 55.
    Community Mobilisation • Gaycommunity o High profile social marketing initiatives to suggest a period of concerted community action o Seek support from gay community leadership • Disproportionate contributions to new diagnoses from: o Men in serodicordant relationships o Sexually adventurous men
  • 56.
    Targeting Late HIVDiagnoses • NAPWA believes there is scope to reduce late HIV diagnoses among MSM, heterosexuals and CALD.
  • 57.
    CD4+ cell countat HIV diagnosis, 2001 – 2010, by year  Click to edit the outline text format  Second Outline Level Third Outline Level  Fourth Outline Level Fifth Outline Level Source: State and Territory health authorities
  • 58.
    What proportion of‘late’ HIV diagnoses are MSM?
  • 59.
    Late HIV DiagnosesActions • Reduce structural and psychological barriers to testing • Encourage primary health services to offer testing to populations at increased risk. o Low caseload GPs in areas of high HIV prevalence – offer testing to MSM o GPs and community health services working with CALD populations at increased risk
  • 60.
    Need data fortargets • Variable treatment patterns across sub groups • Attitudes and beliefs are wide ranging and complex • Motivations and drivers critical • Campaigns need to be diverse and different mediums – websites, blogs and social media
  • 61.
    Should we expectan initial increase in HIV Diagnoses? Population Undiagnosed Click to edit the outline  Undiagnosed Size (10%) text format (20%) 22,391 (1) 2,239  Second Outline 4,478 Level Third Outline • Level (1) Estimate of the number of people living with HIV in Australia as at 31/12/2010 plus 1,000 (estimated number of new diagnoses in 2011)  Fourth Outline • Level The estimates of the proportion of the PLHIV population that are undiagnosed are from Mapping HIV Outcomes: Geographical and clinical Fifth forecasts of numbers of people living with HIV in Australia (NCHECR/NAPWA, 2010) Outline • If testing coverage and frequency increase, there may be anLevel initial spike in
  • 62.
    A package • Targetsdisease prevention • Targets access inequities • Targets continuity of care
  • 63.
    Targets are apackage • They bring other dynamics and roll on effects • National HIV strategy links • The momentum brings energy and focus • Forward to future yrs and see results • Health and well being of a population is what fosters other secondary benefits, such as prevention and broader BBVSS health maintenance
  • 64.
    Setting Targets • Settargets based on the number of people it will positively affect. • Planning should be optimistic and lead with positive frameworks for what you can do and what potentials there are to truly transform
  • 65.
    Targets and ReducedDiagnoses Exposure Category 2010 Diagnoses 50% Reduction  Click to edit theReduction 80% outline MSM + MSM & IDU 621 text format (311) 124 Heterosexual 289 Second Outline  145 IDU 25 Level 13 All Categories 1,043 Third Outline Level • An 80% reduction in MSM diagnoses and a 50% reduction  Fourth Outline in heterosexual, IDU and other categories would result in Level approximately 335 annual diagnoses, which is a 68% reduction overall on the 1,043 diagnoses in 2010. Fifth Outline Level
  • 66.
    Opportunities • Emerging combinationprevention options offer the best chance in thirty years to drive infections down • We have to seize the moment – ‘wait and see’ isn’t an option • Signing up to ambitious (but not unrealistic) 2015 targets will provide the galvanising factor
  • 67.
  • 68.
    End here? • End? •Jo, following slides are in case you want to keep them and move them back up into the presentation
  • 69.
    Implications • Targeted subgroups may require varied interventions • Health maintenance not just understood as clinical benefits • Must be peer driven and focused • Need to measure national against state analysis
  • 70.
    Treatments Uptake • Reducingbarriers to treatment o Dispensing arrangements o Co-payments • Difficulties obtaining medication and co-payments associated with stopping ARVs (ARCSHS Tracking Changes, 2011) • ATRAS and other Medicare Ineligibles • Addressing Psychological barriers to initiating treatment
  • 71.
    Self reporting • Actualutilisation vs self reported levels • - Both testing – but also treating, and maintenance