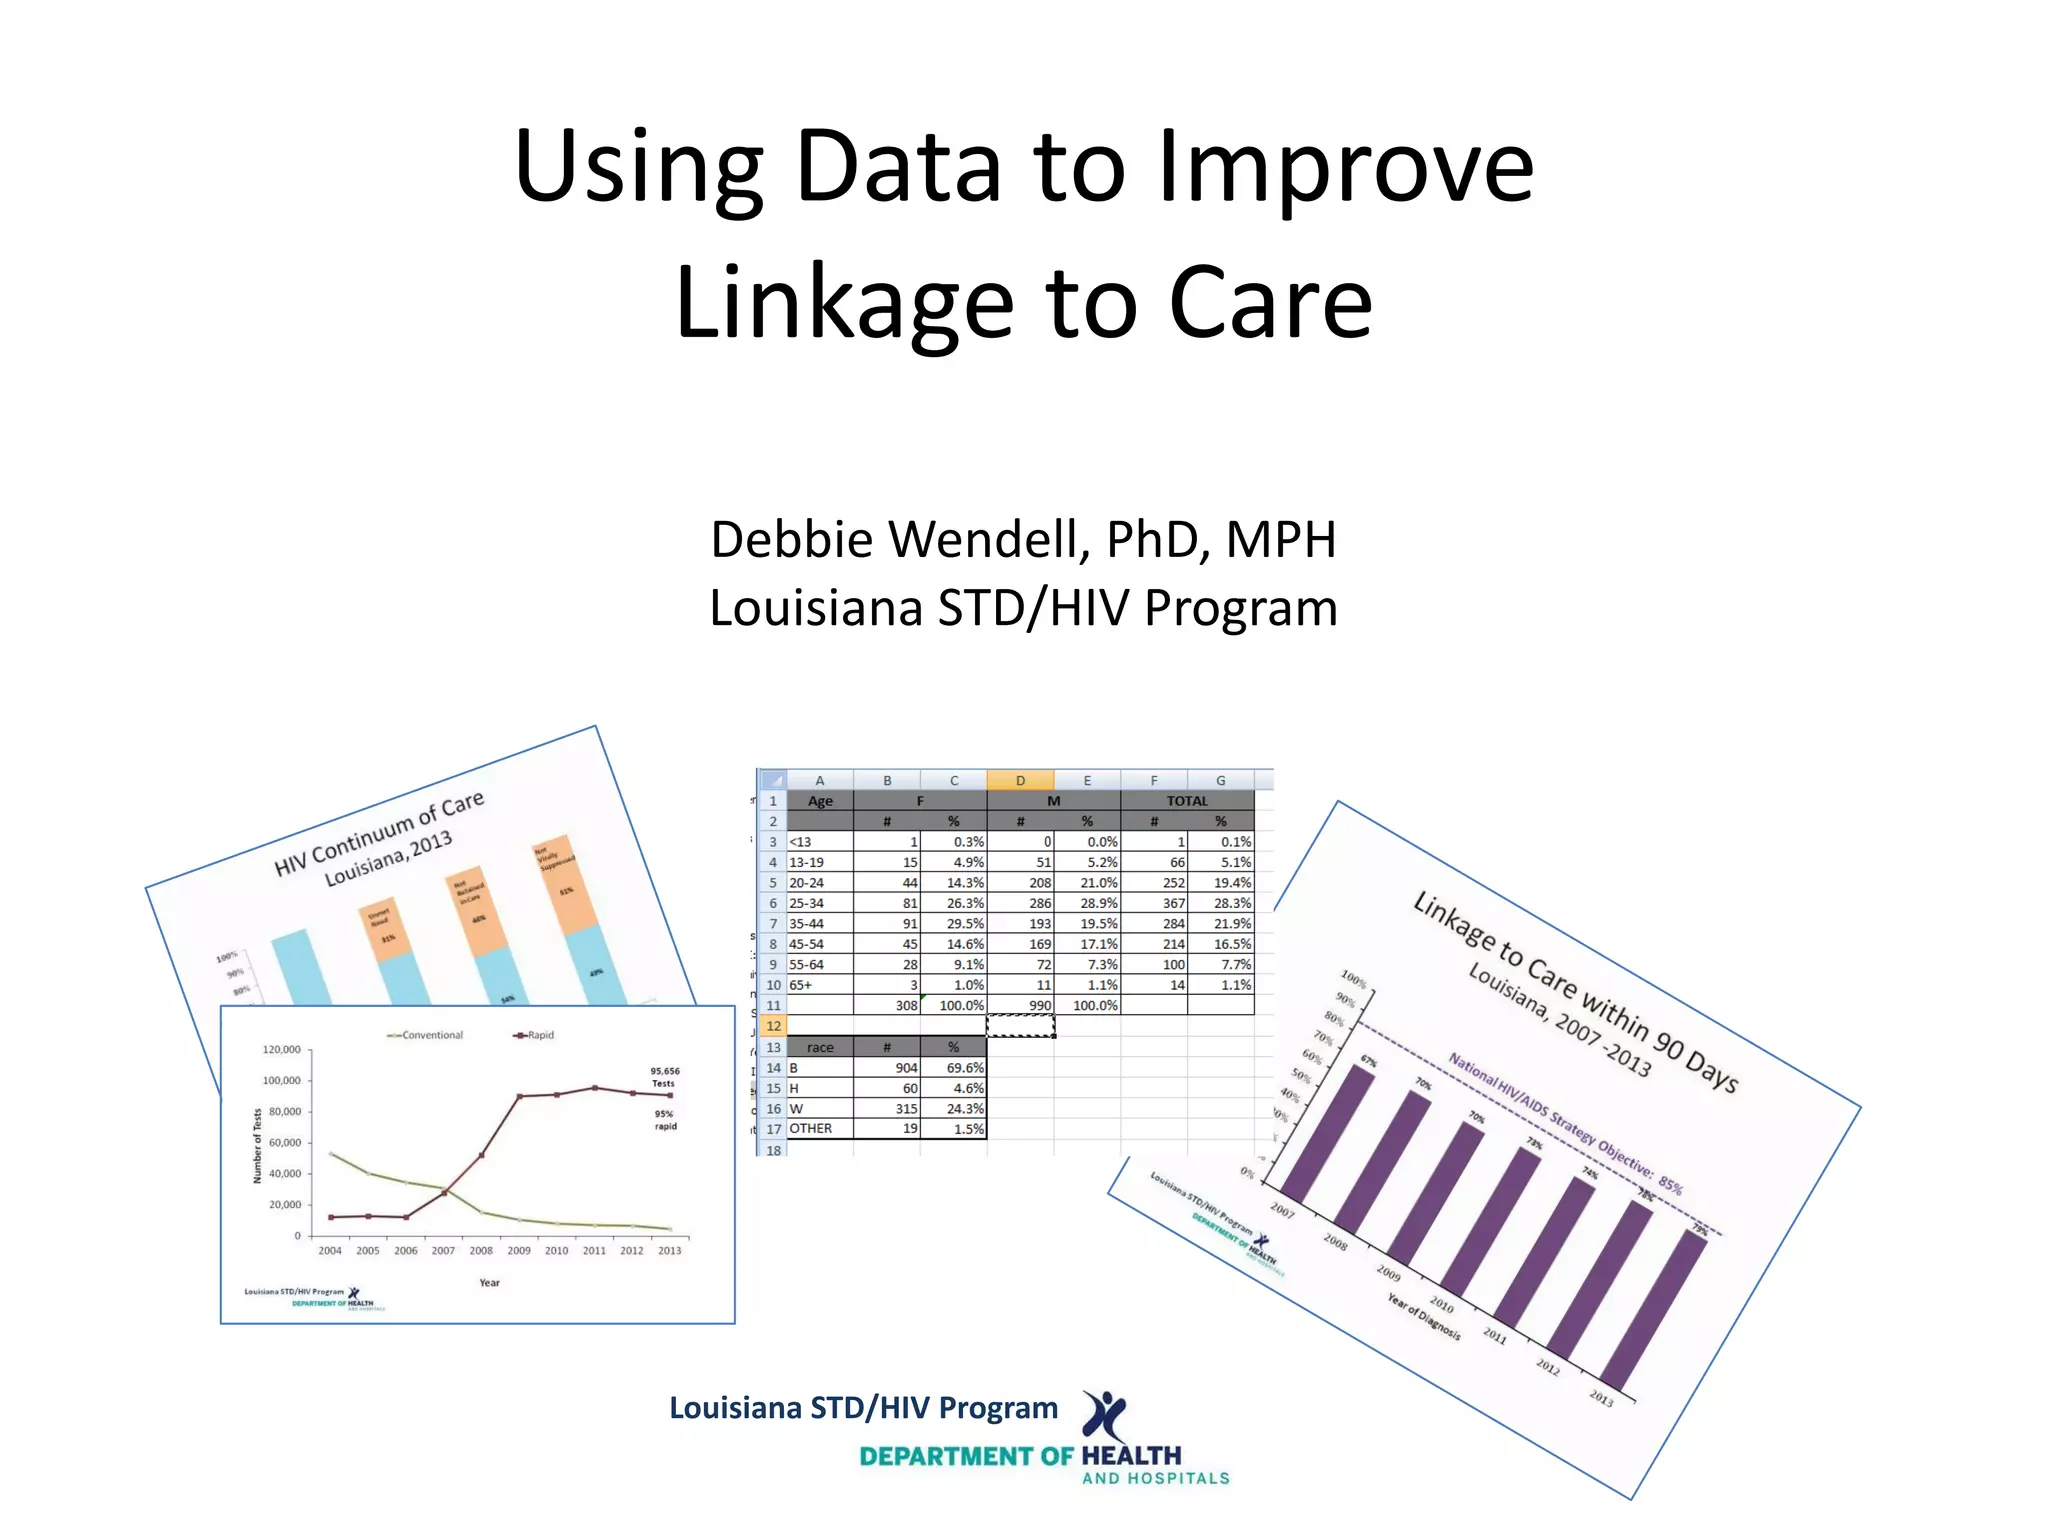
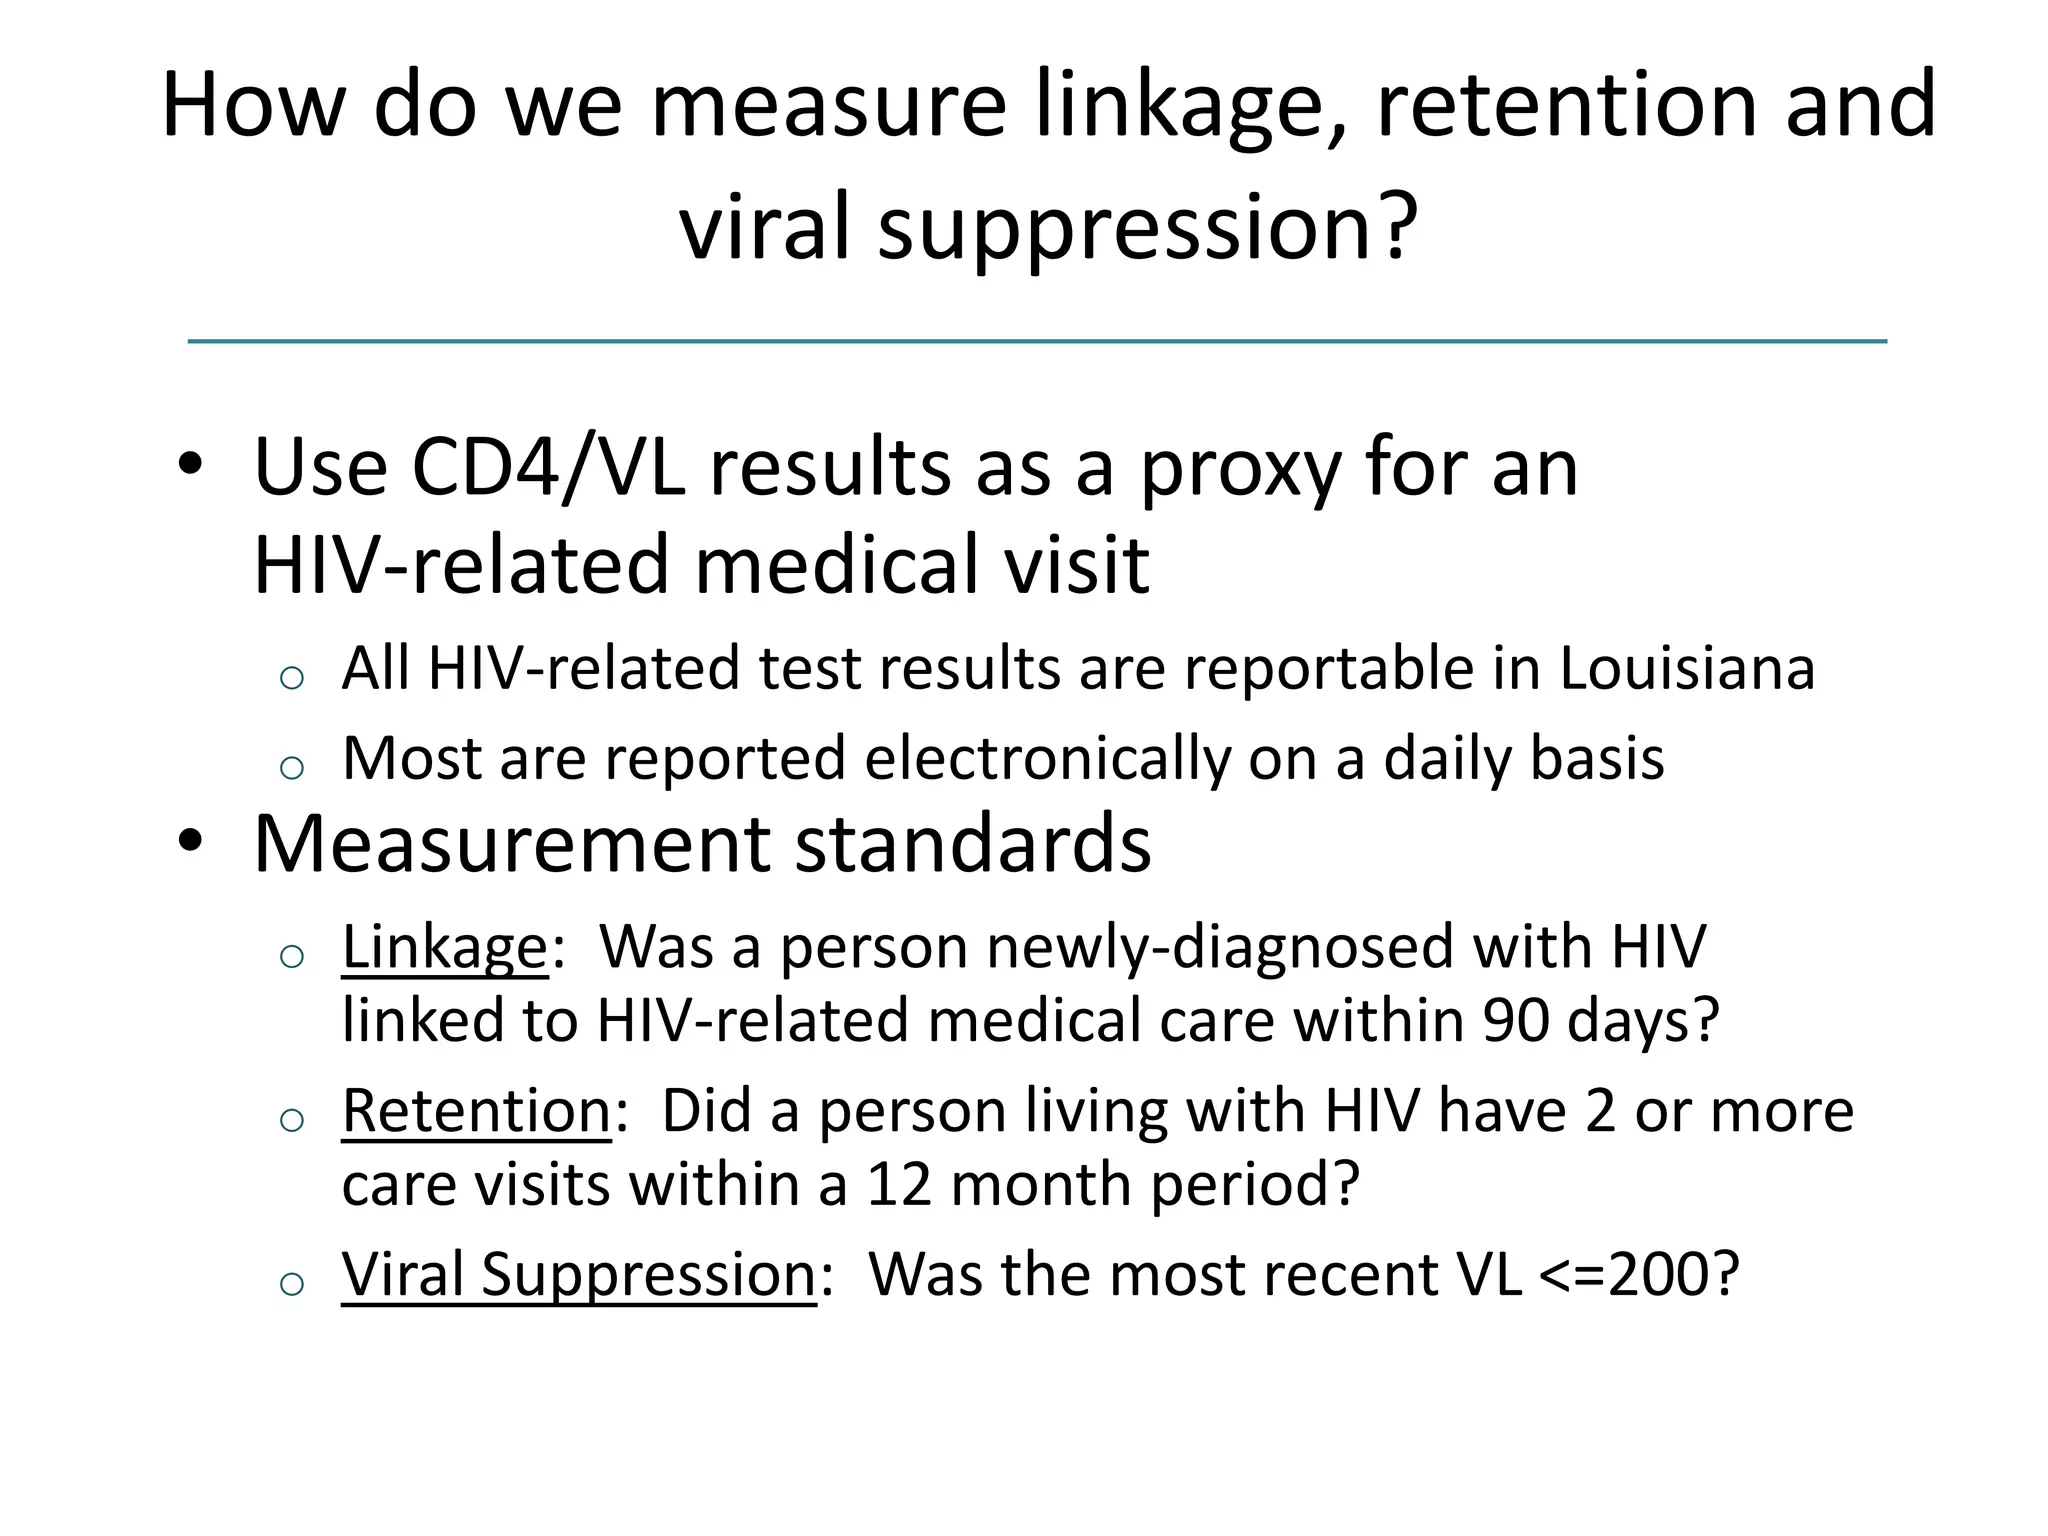
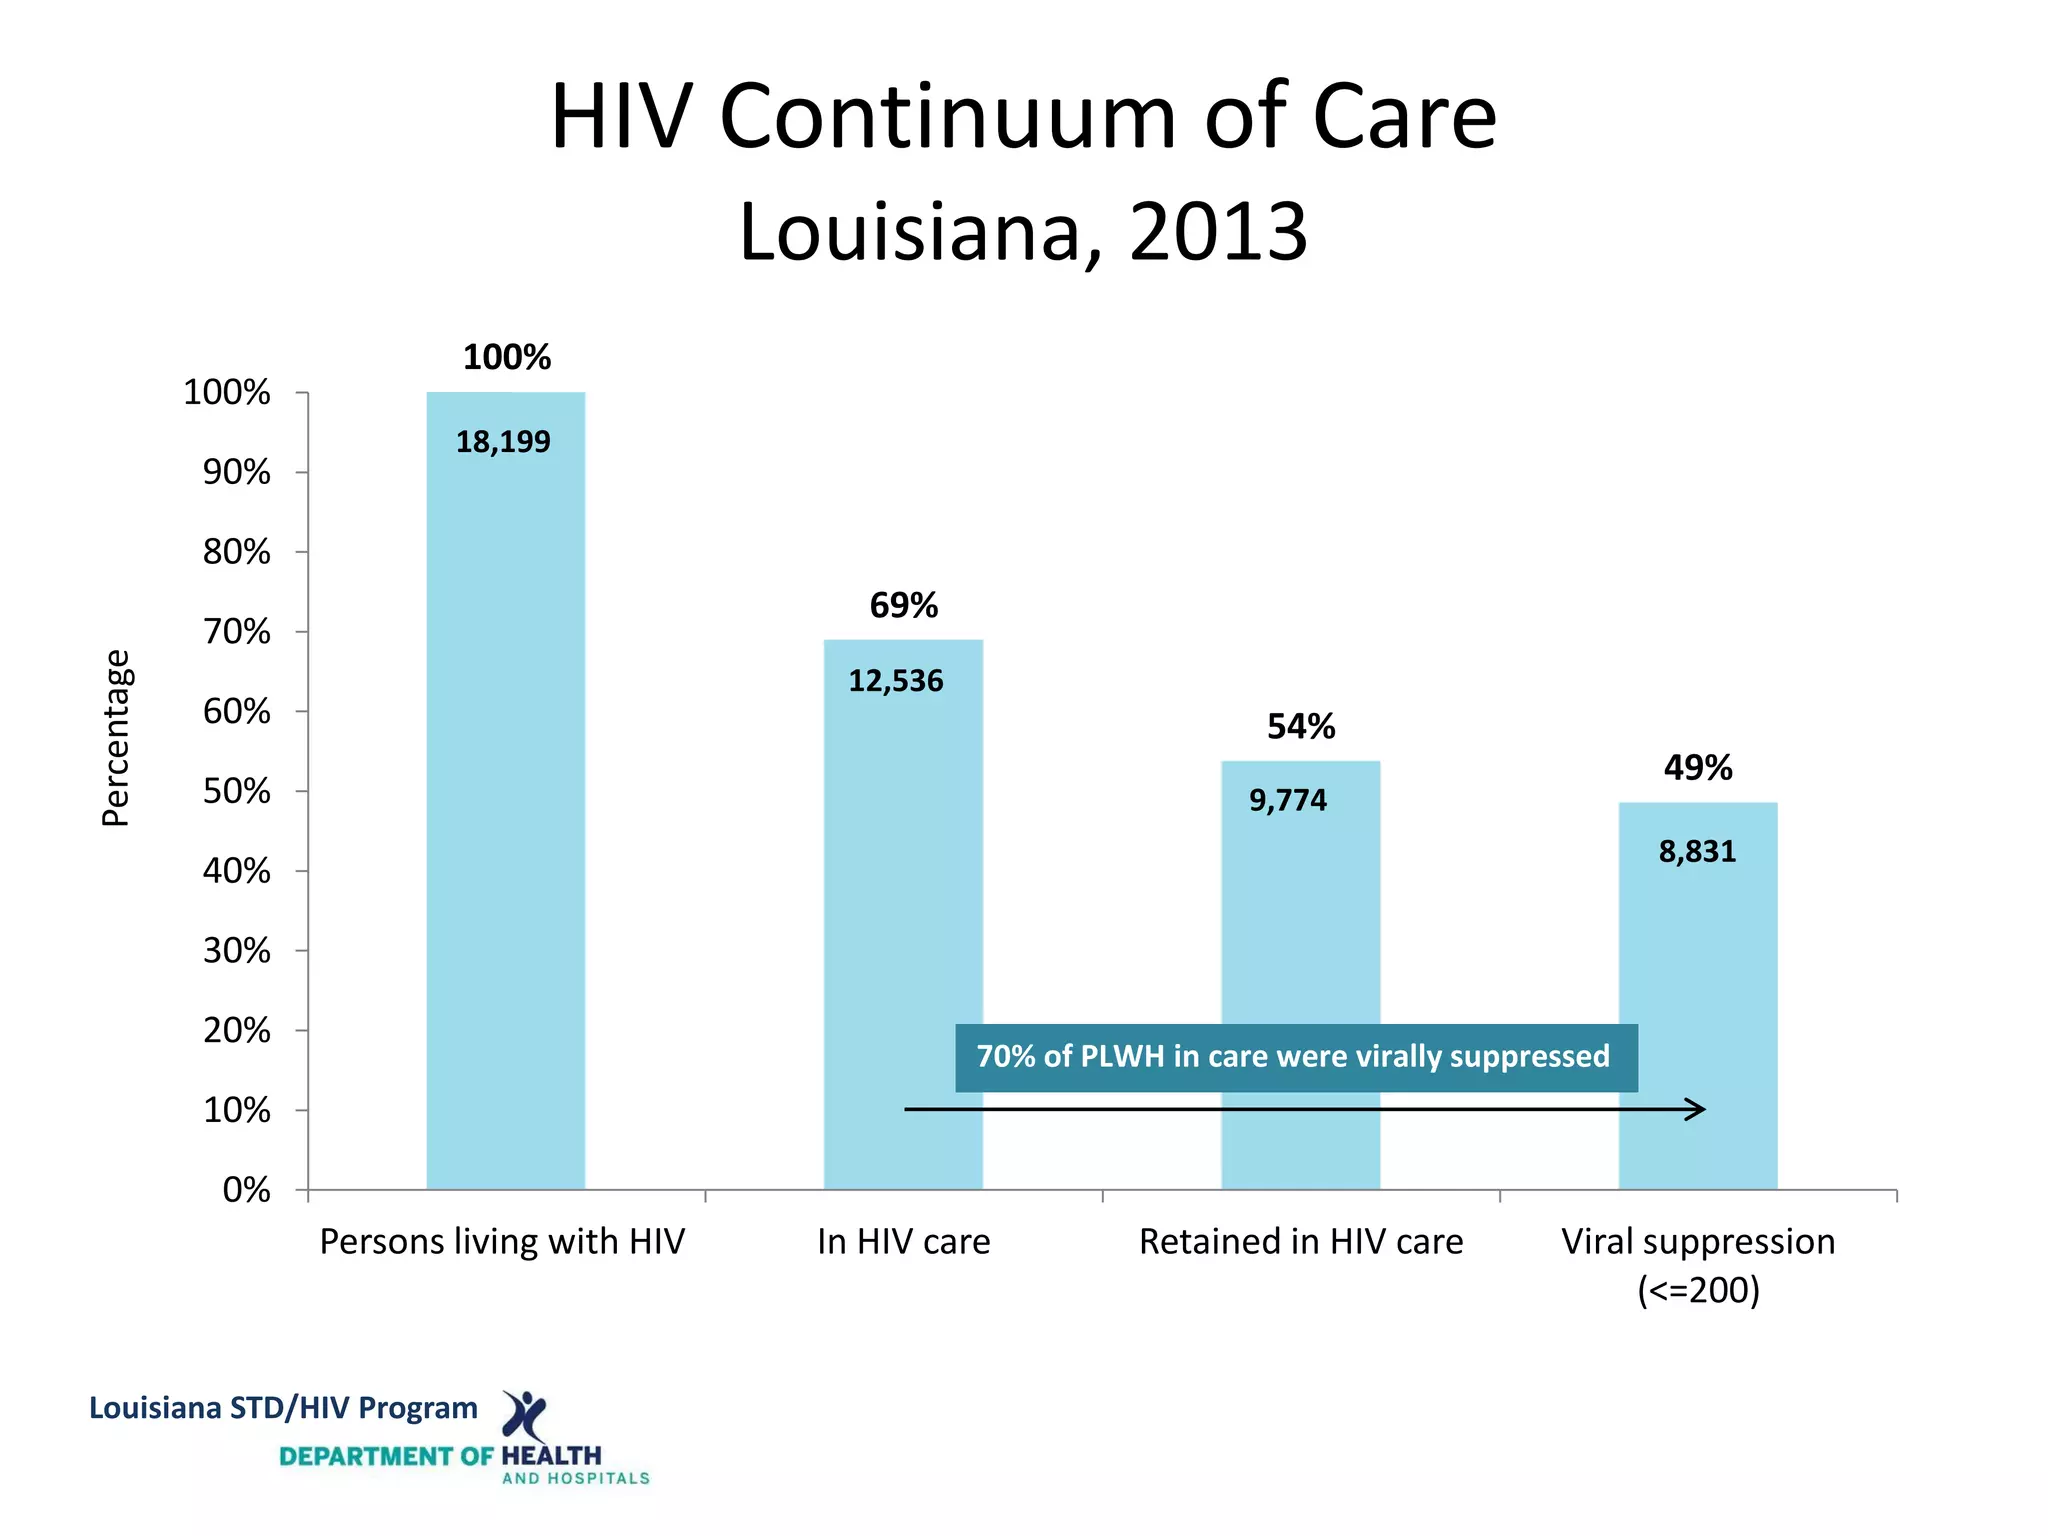
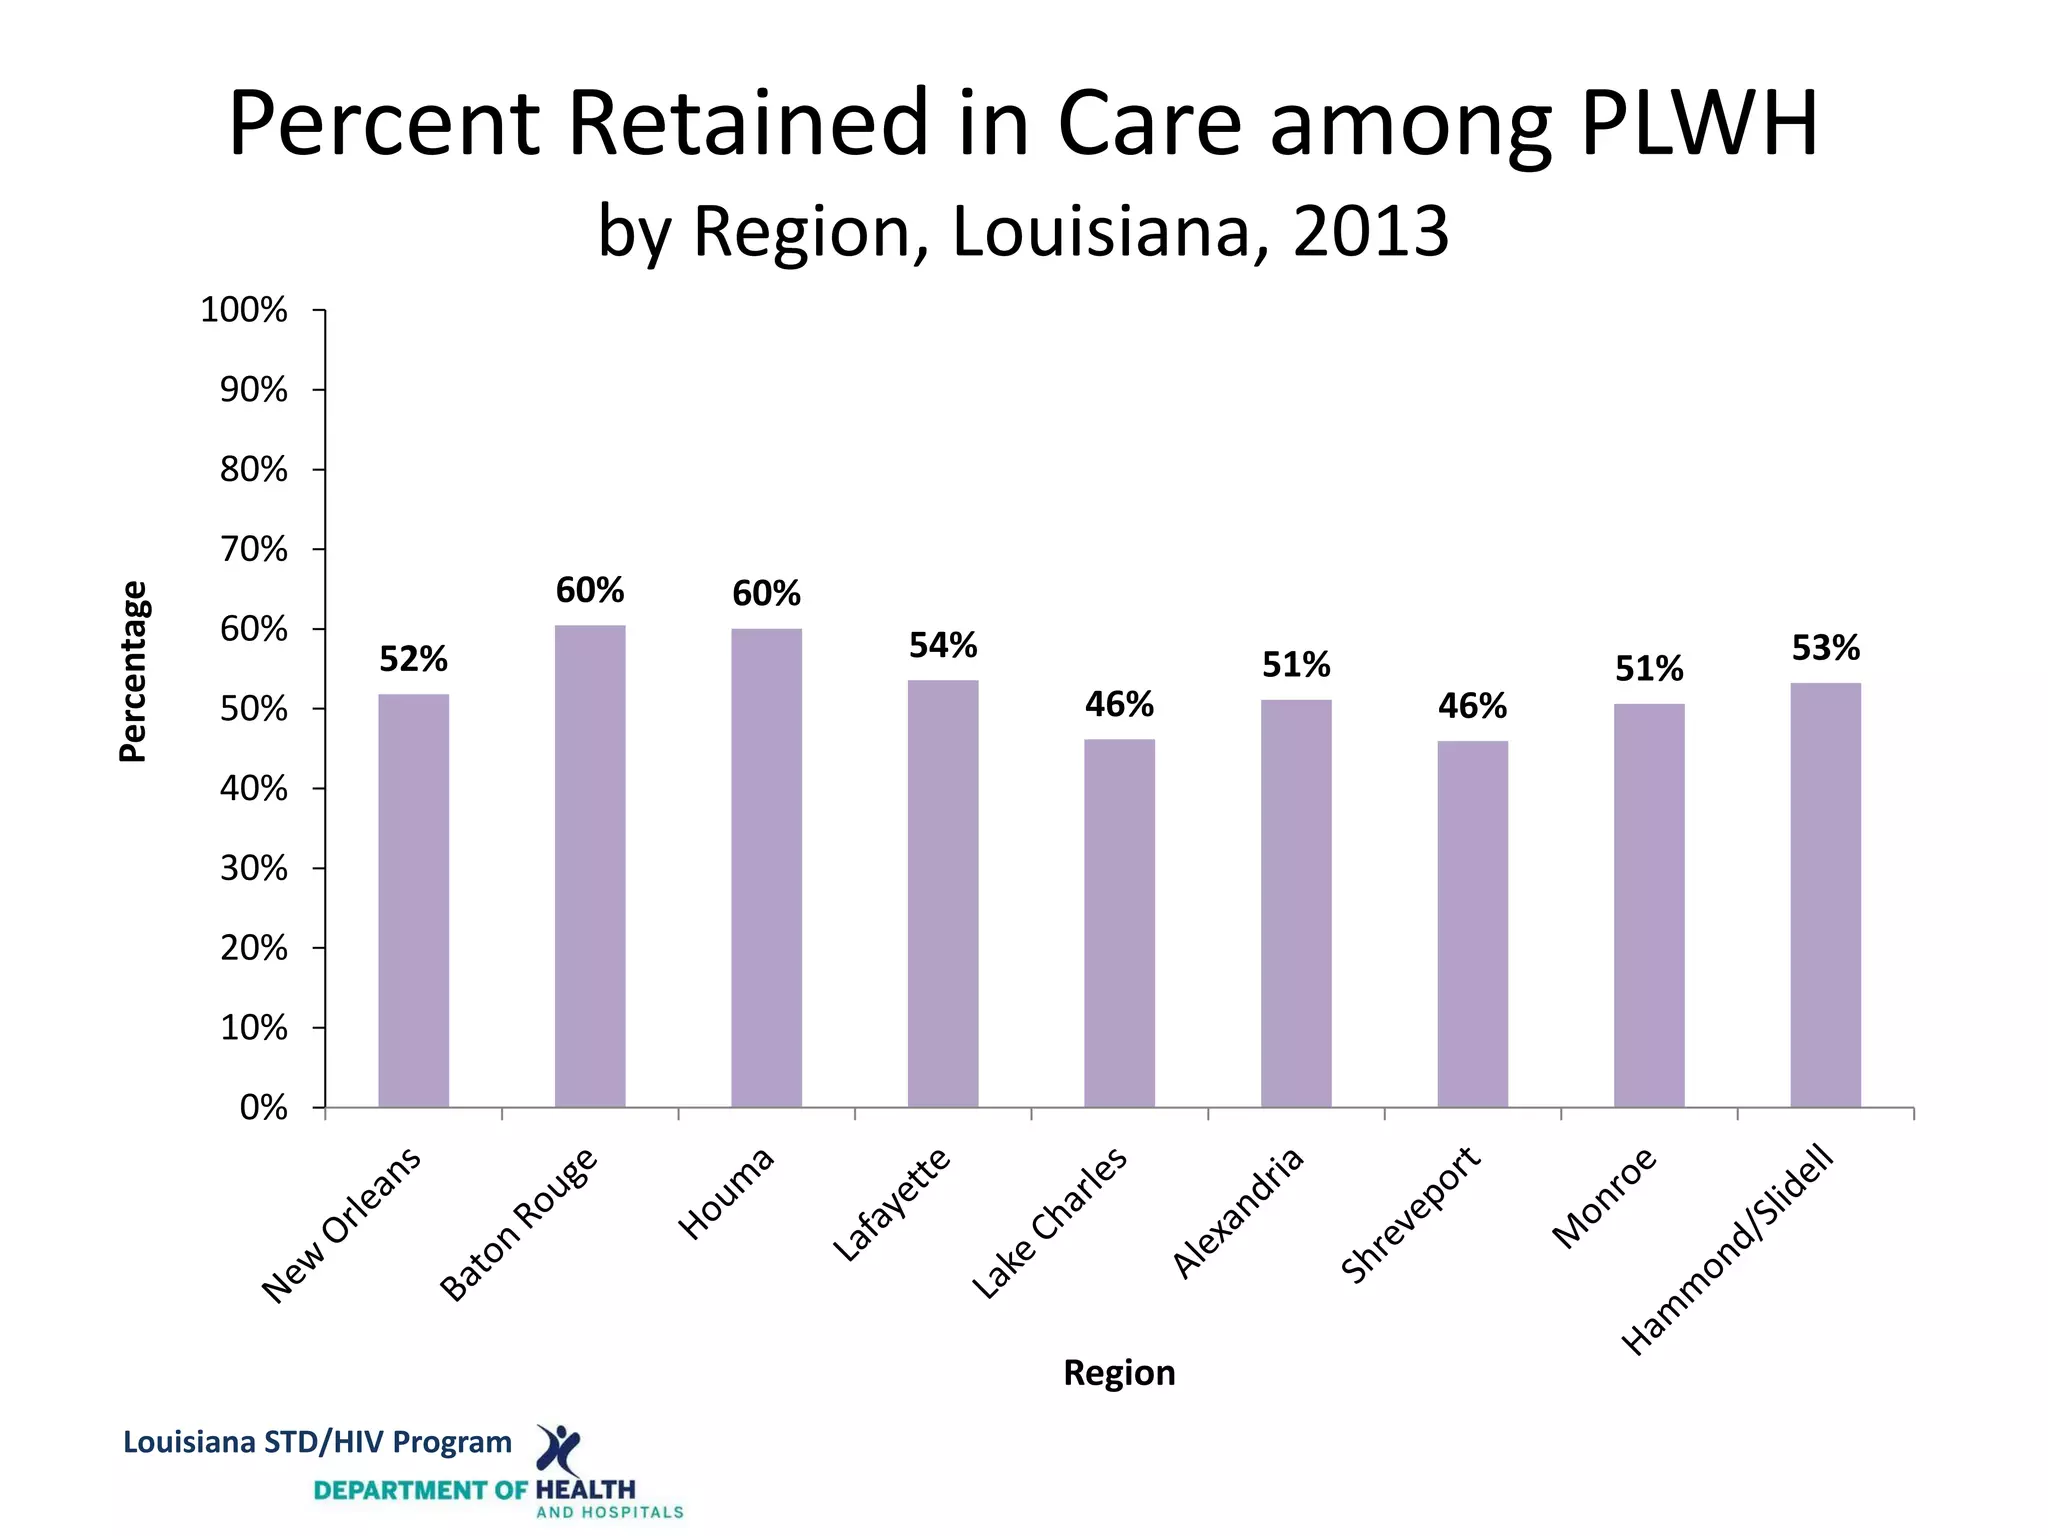
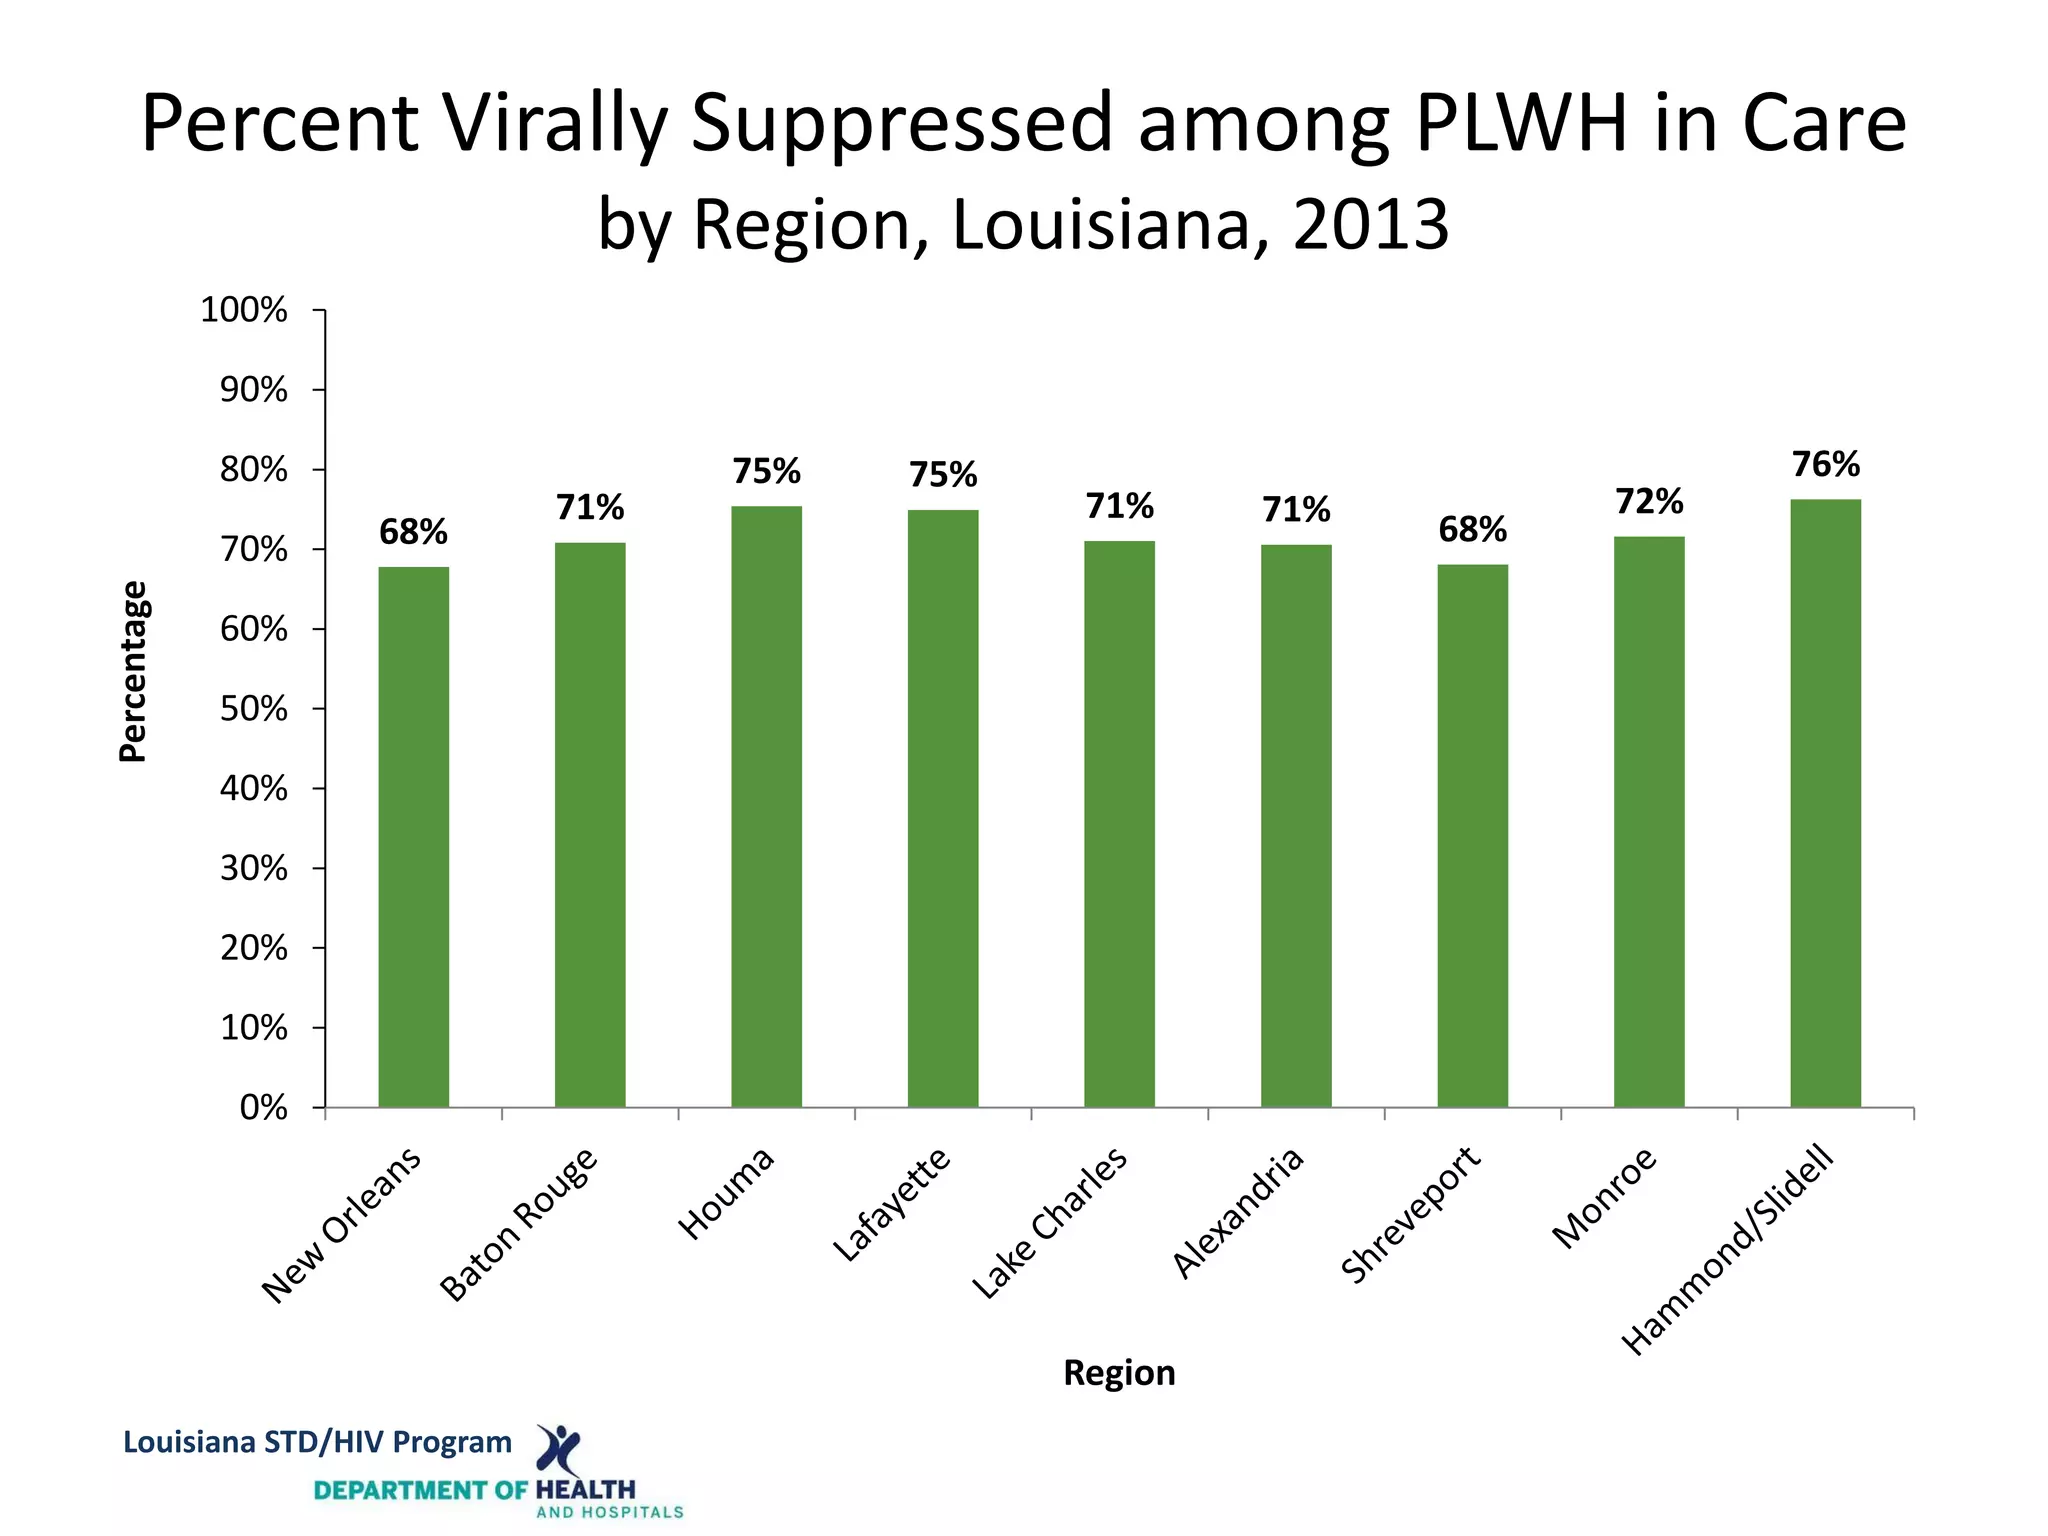
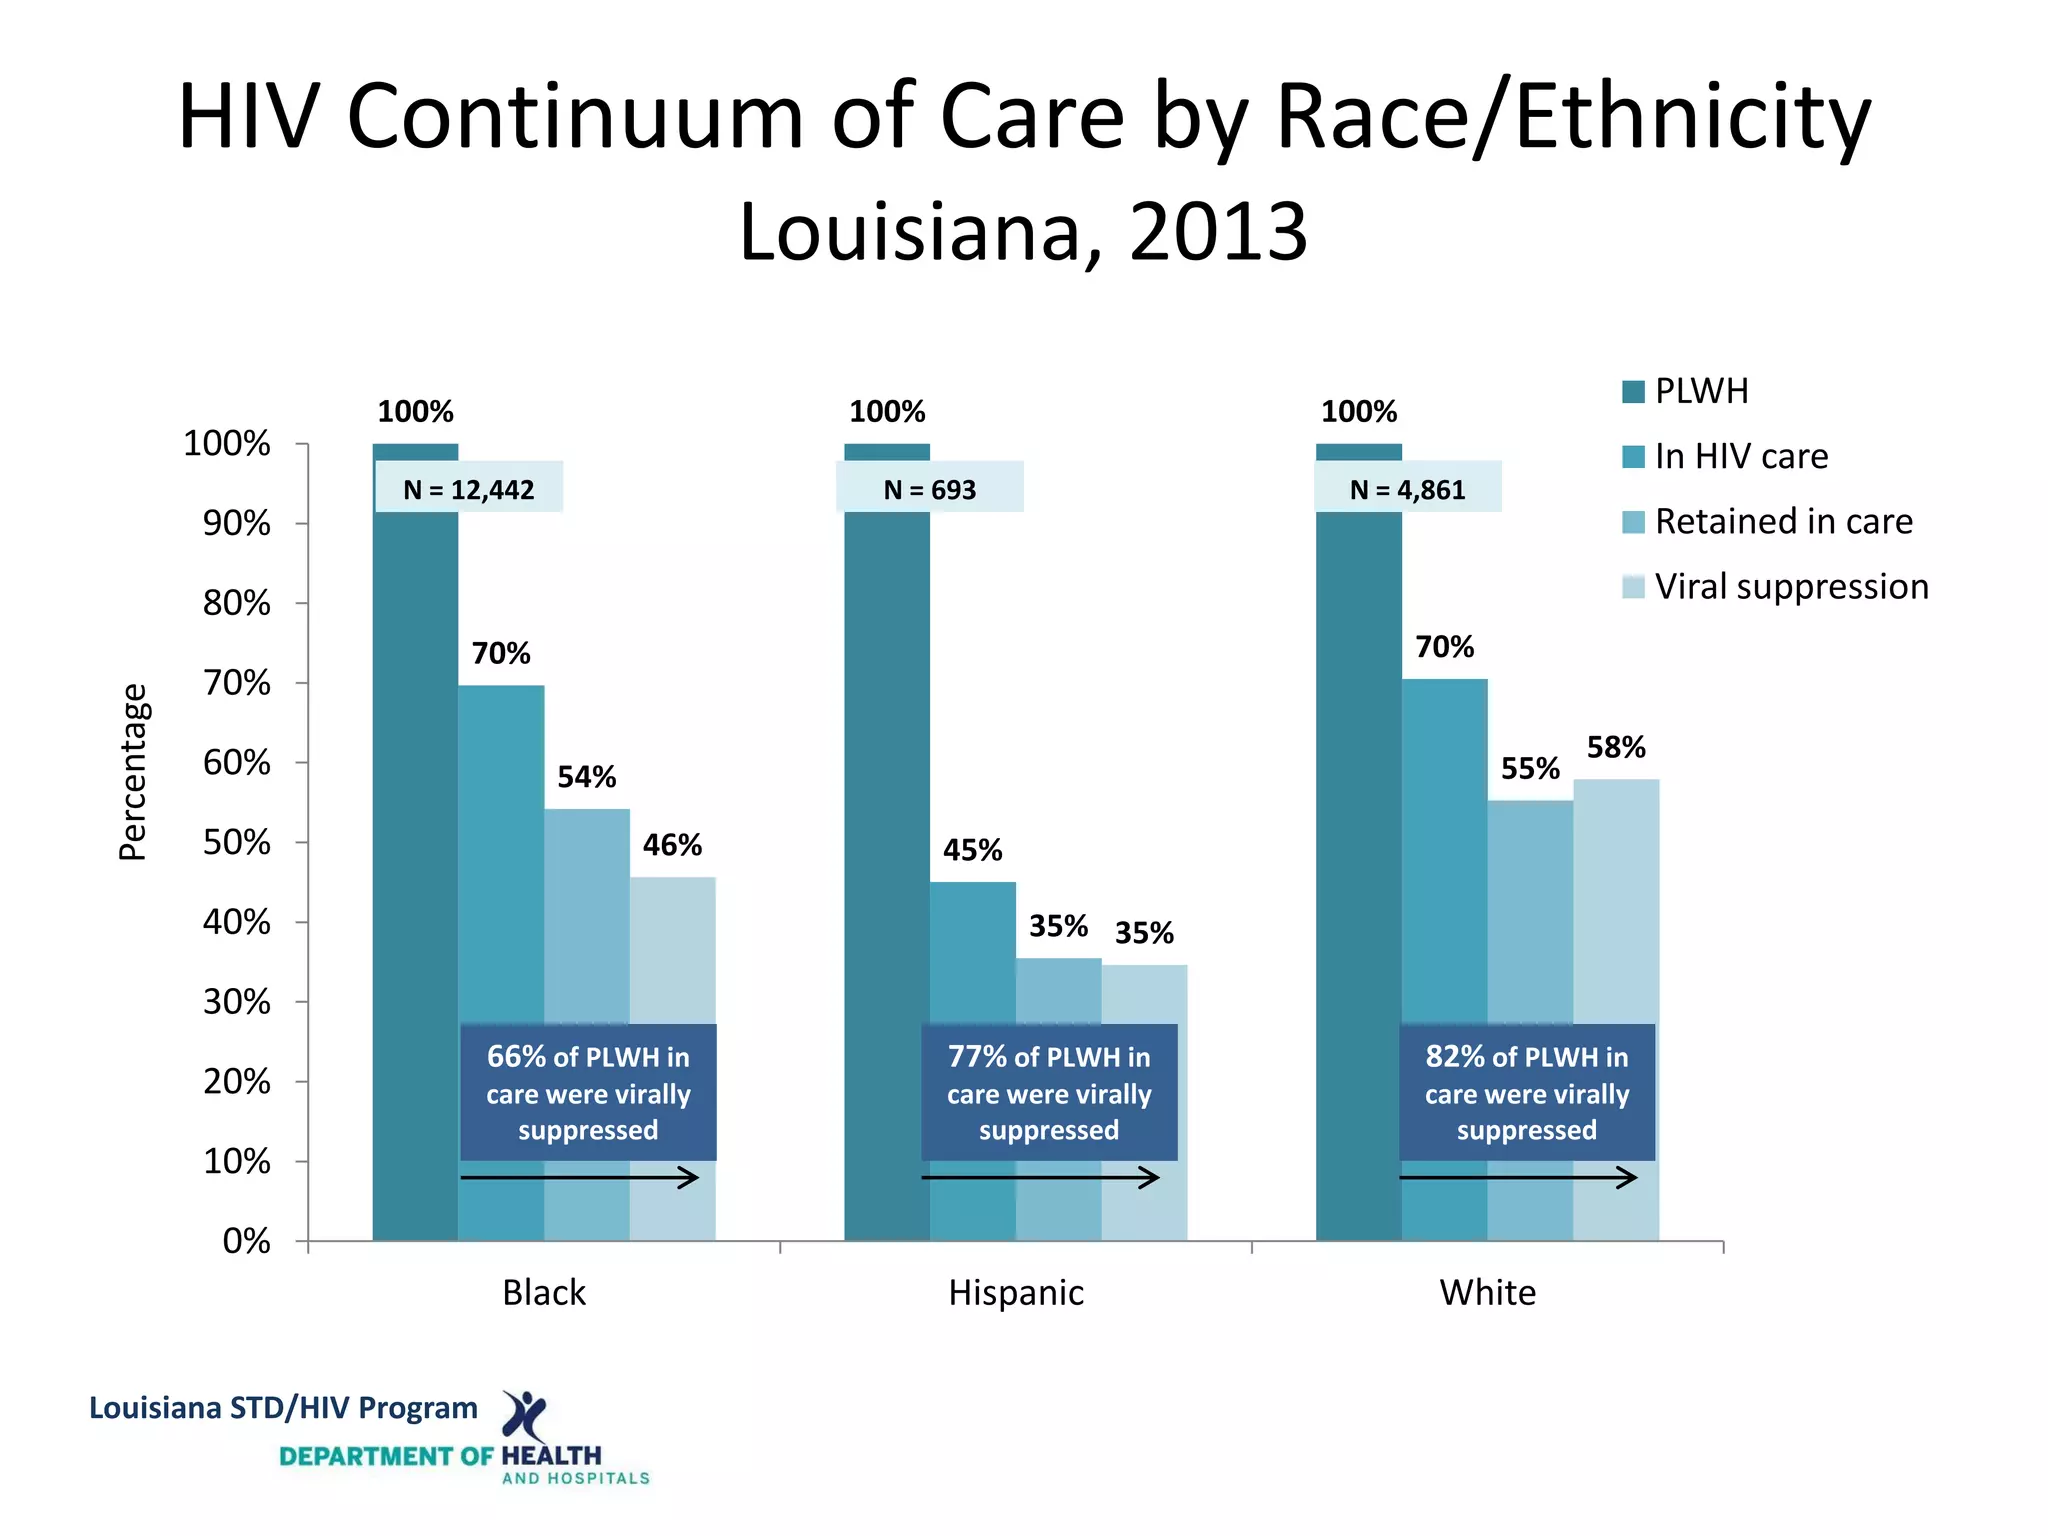
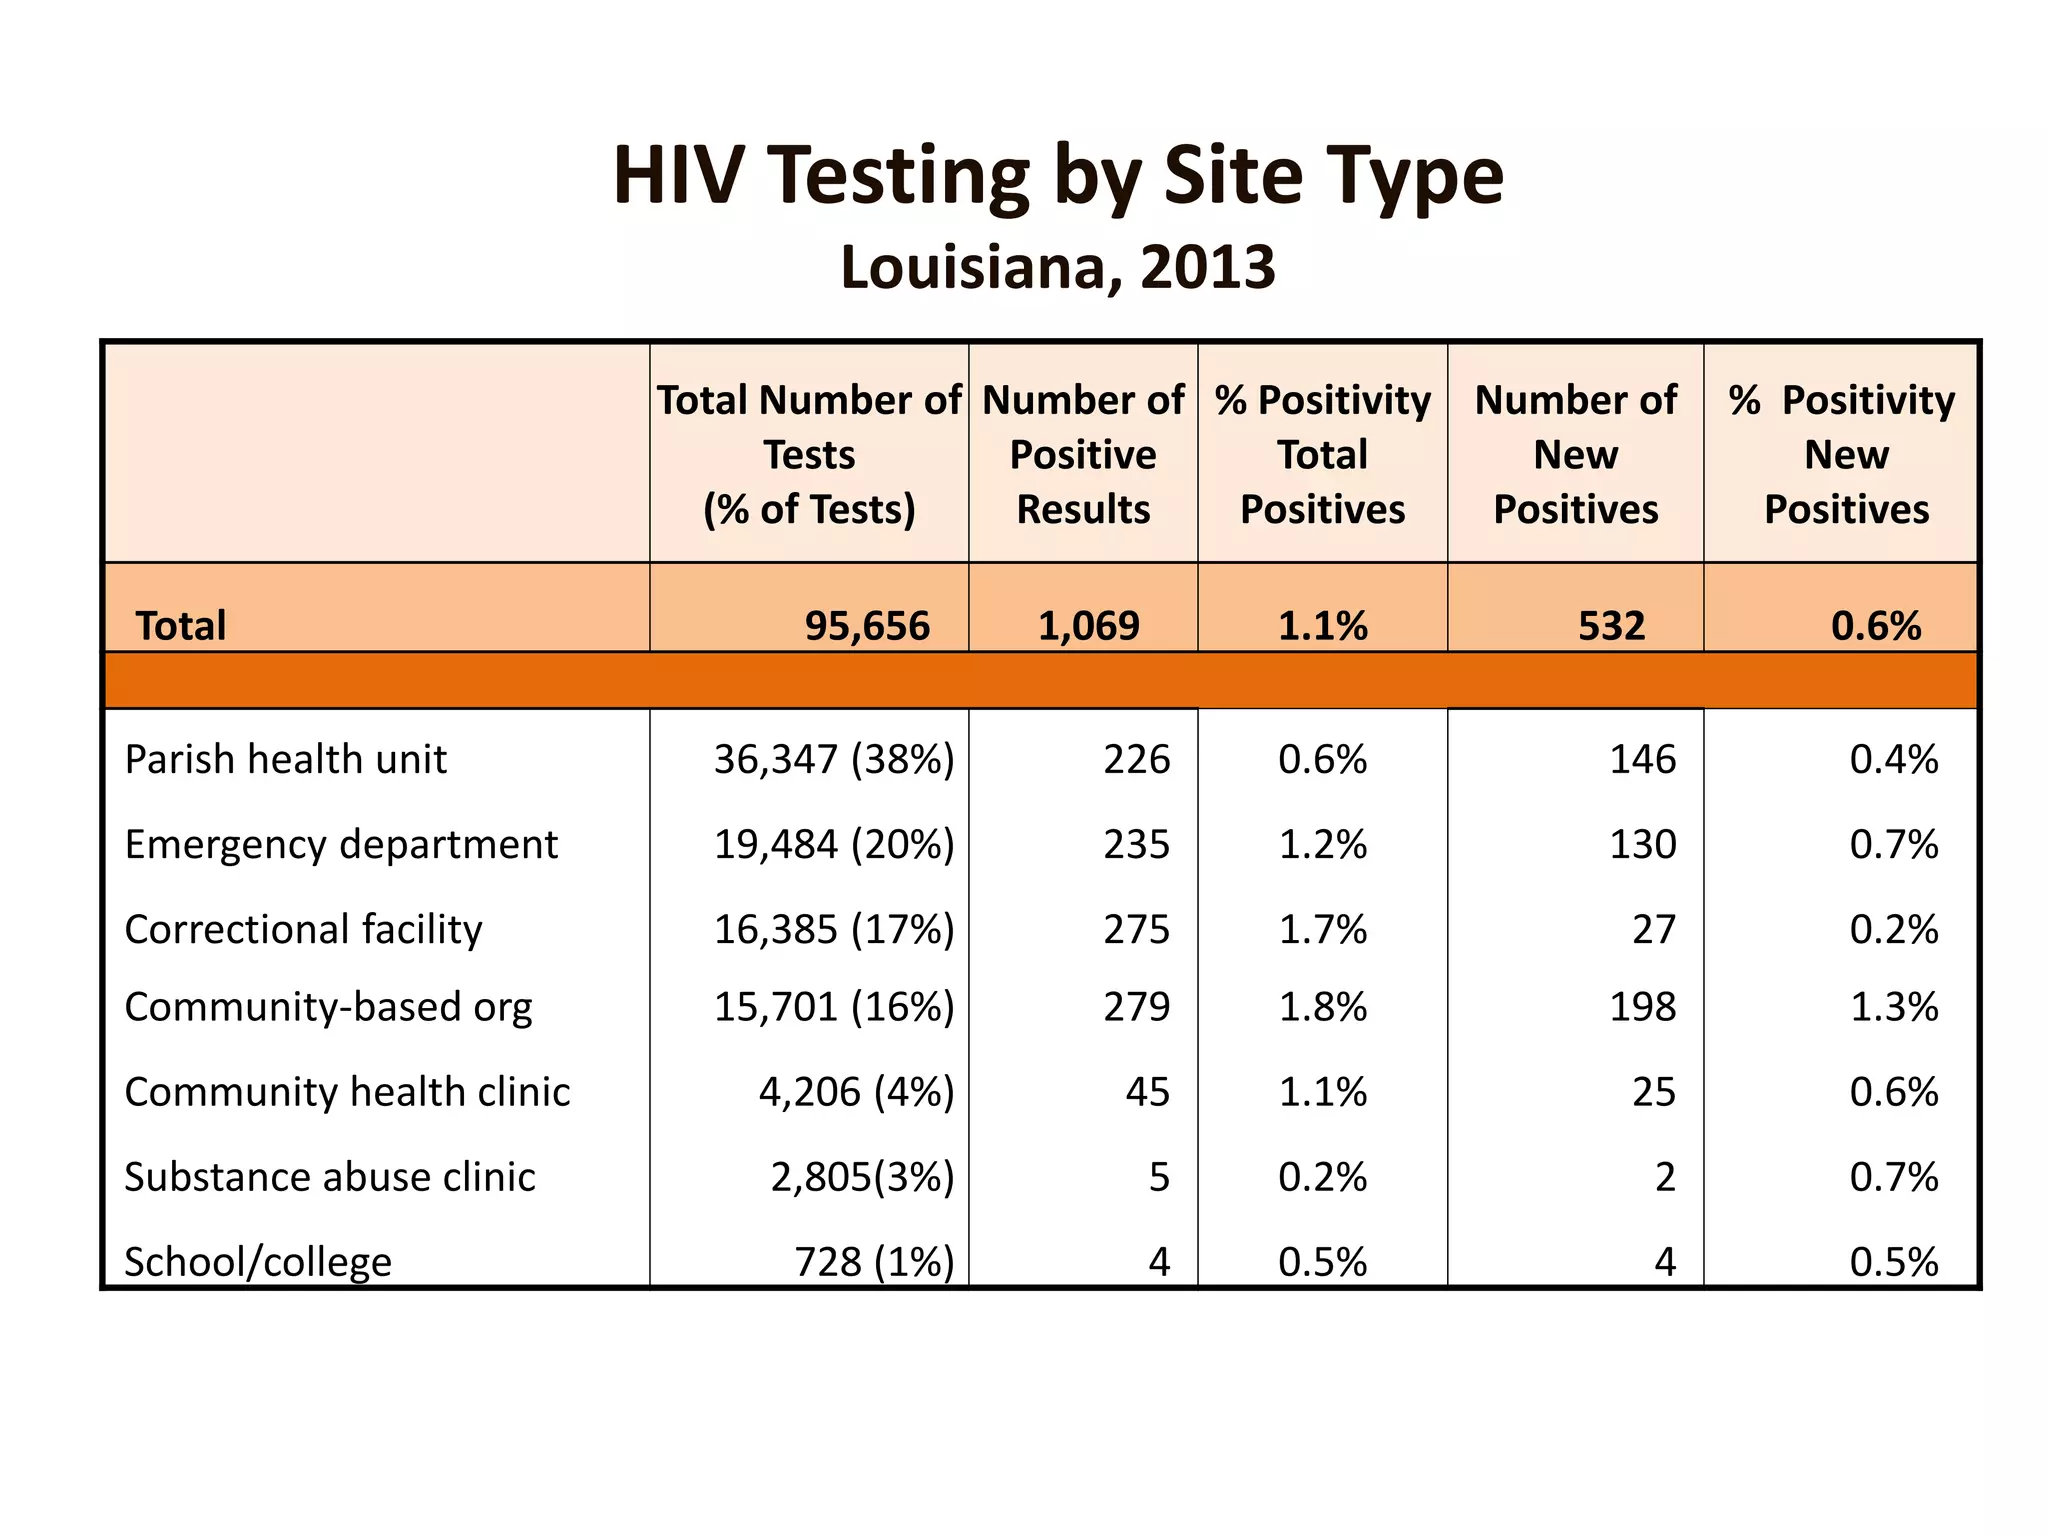
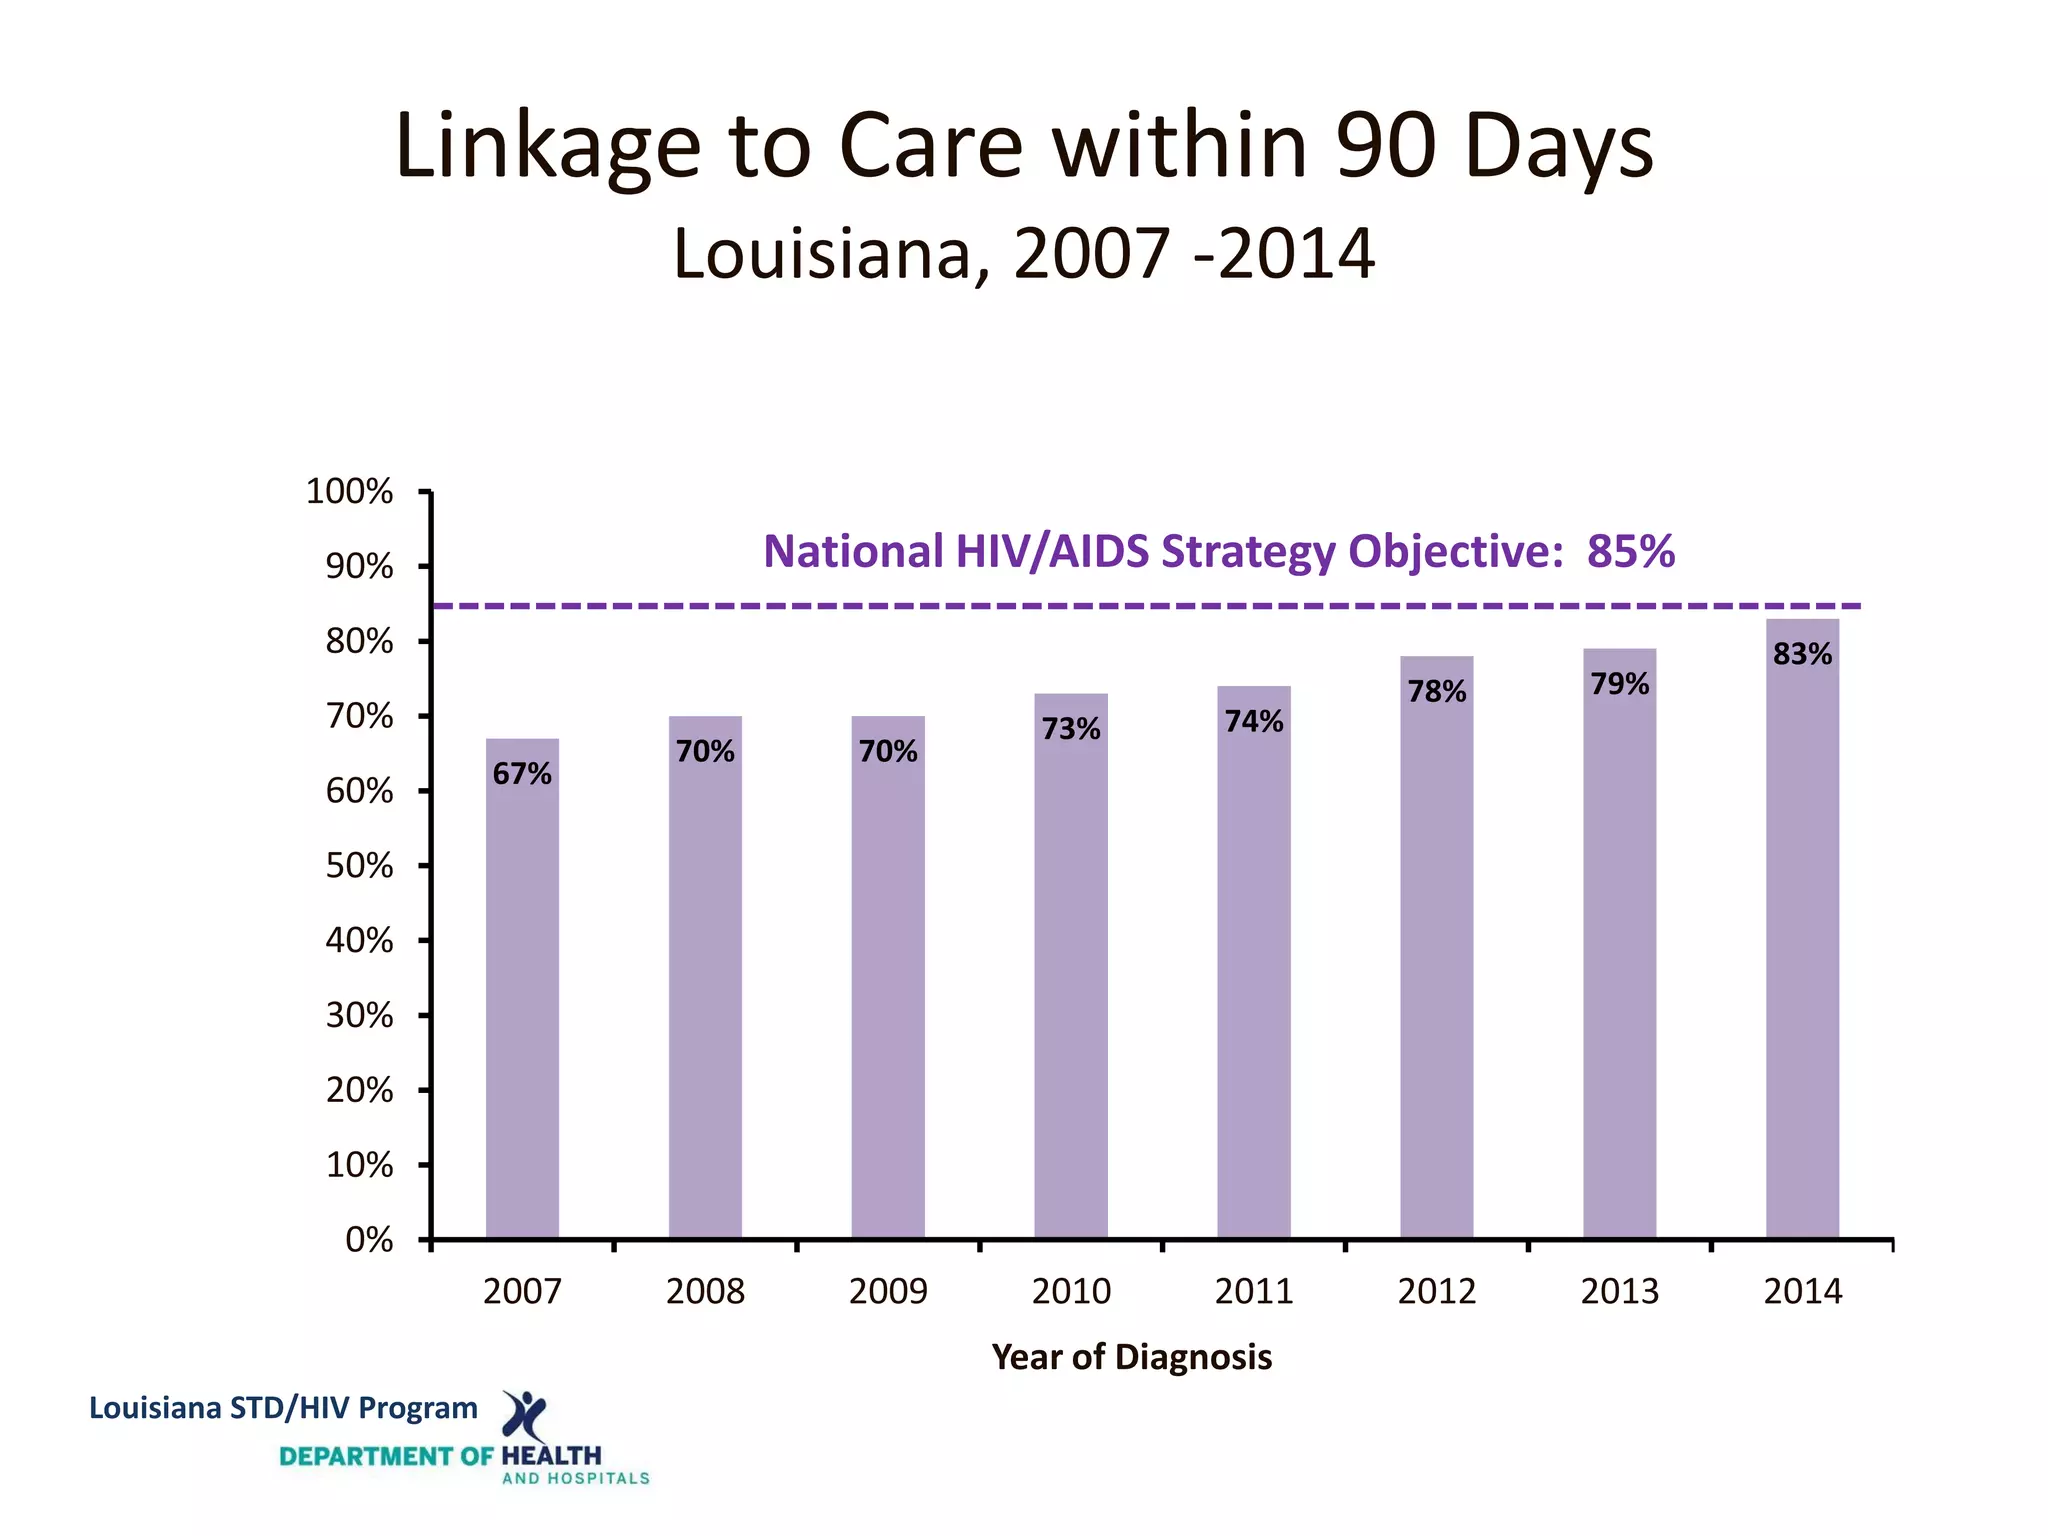
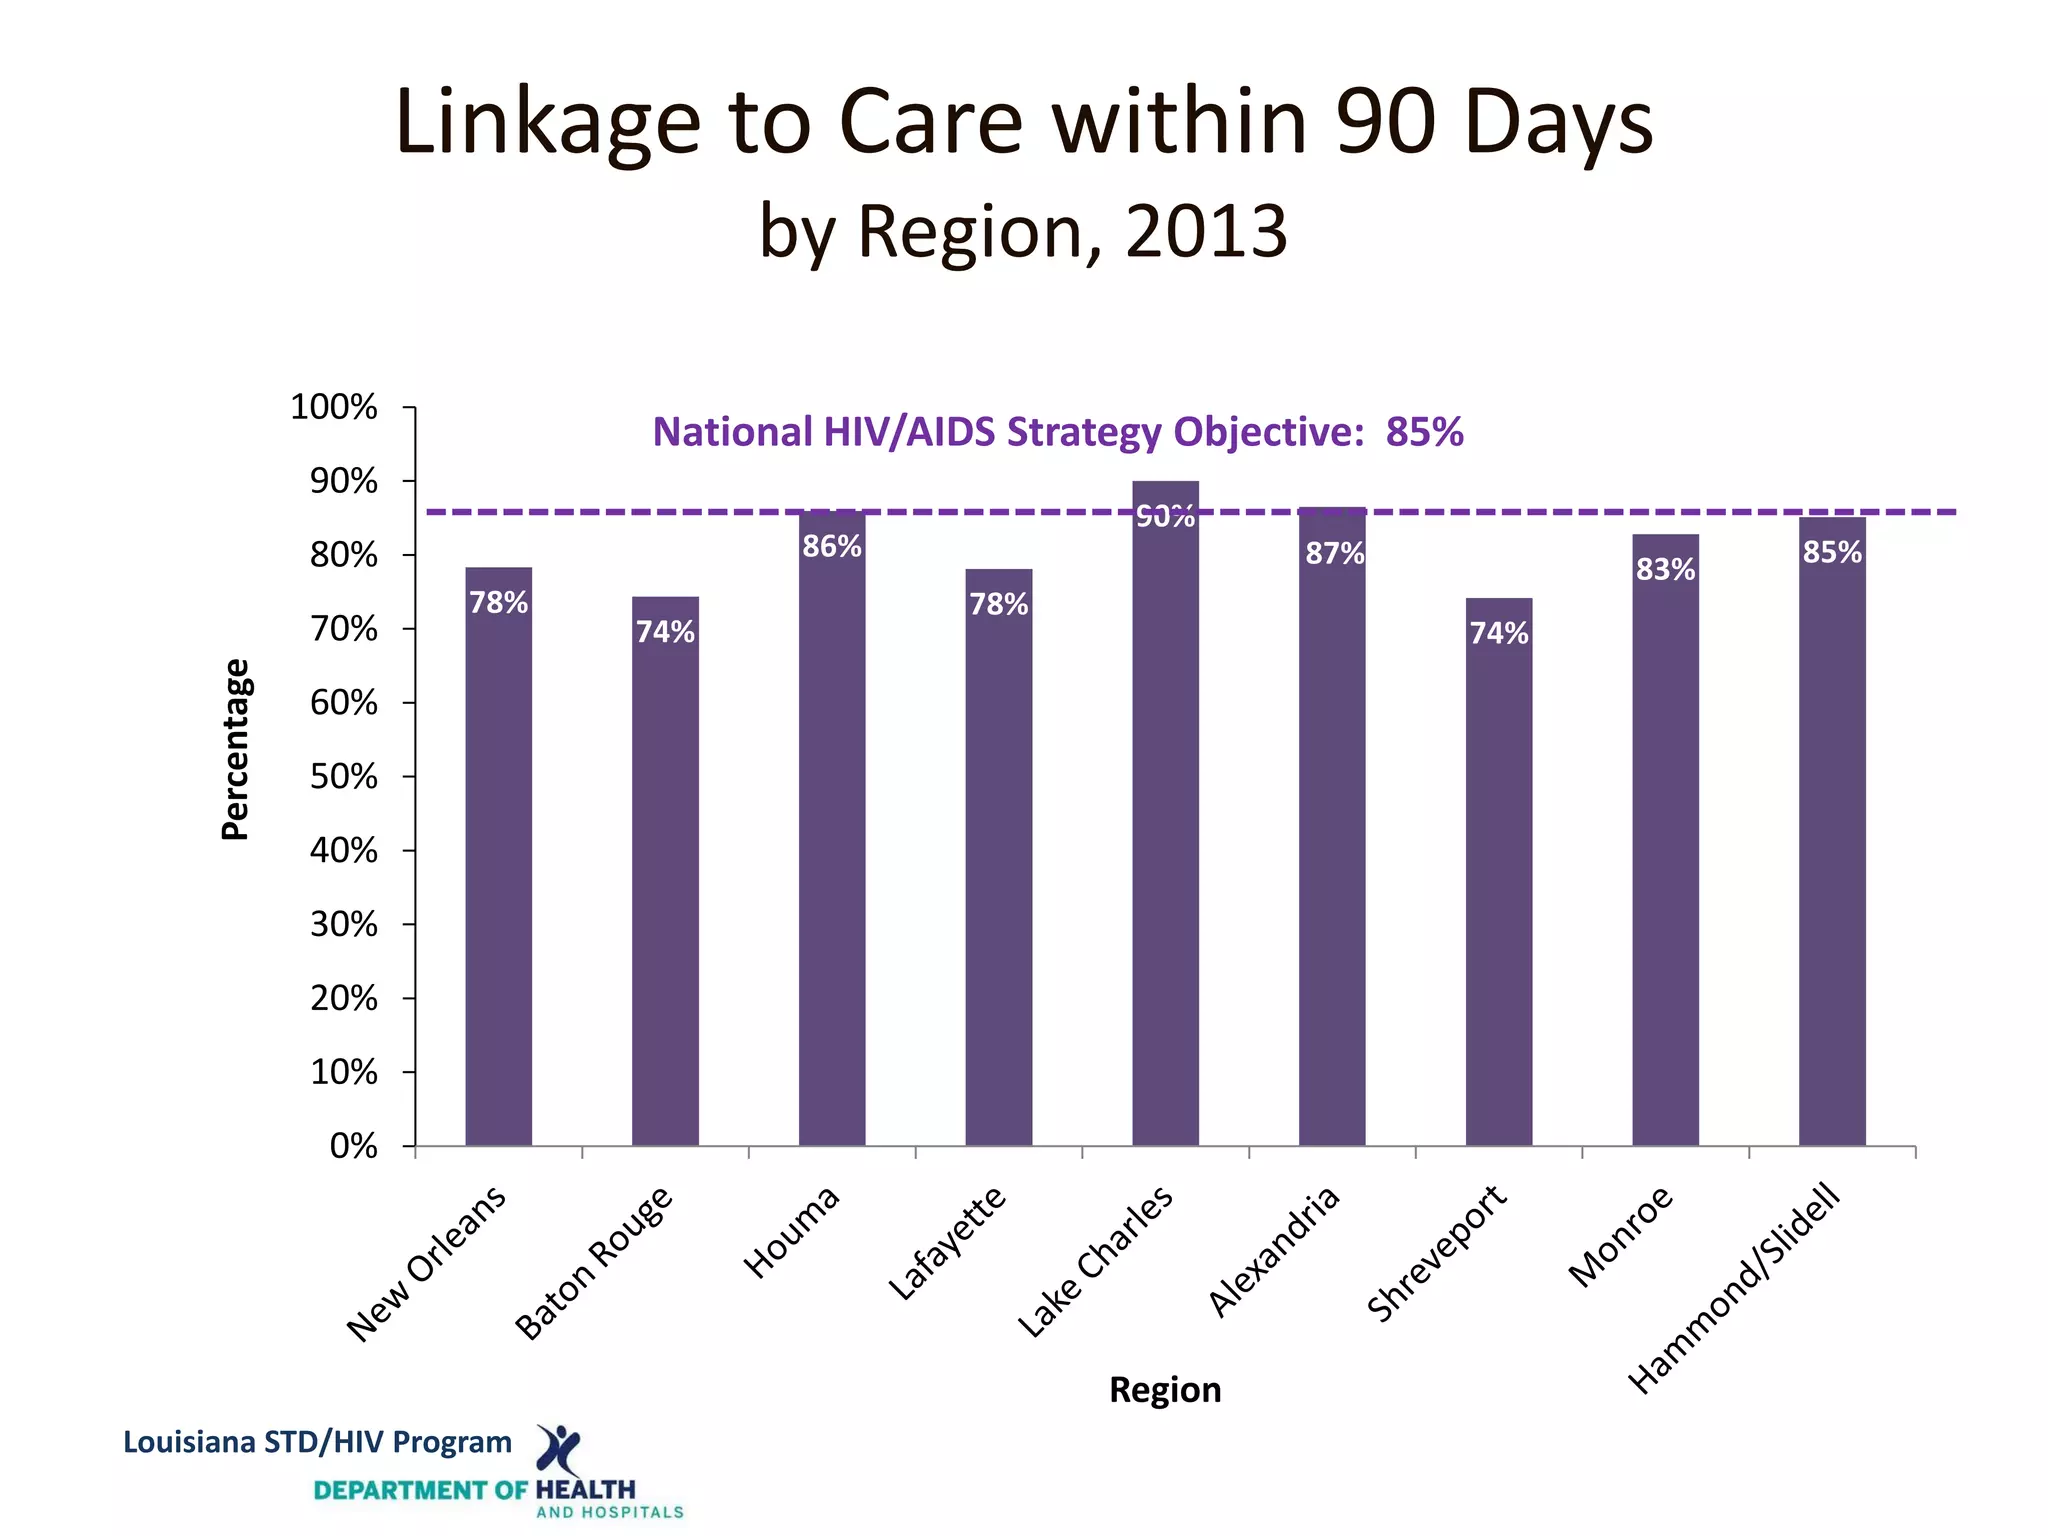
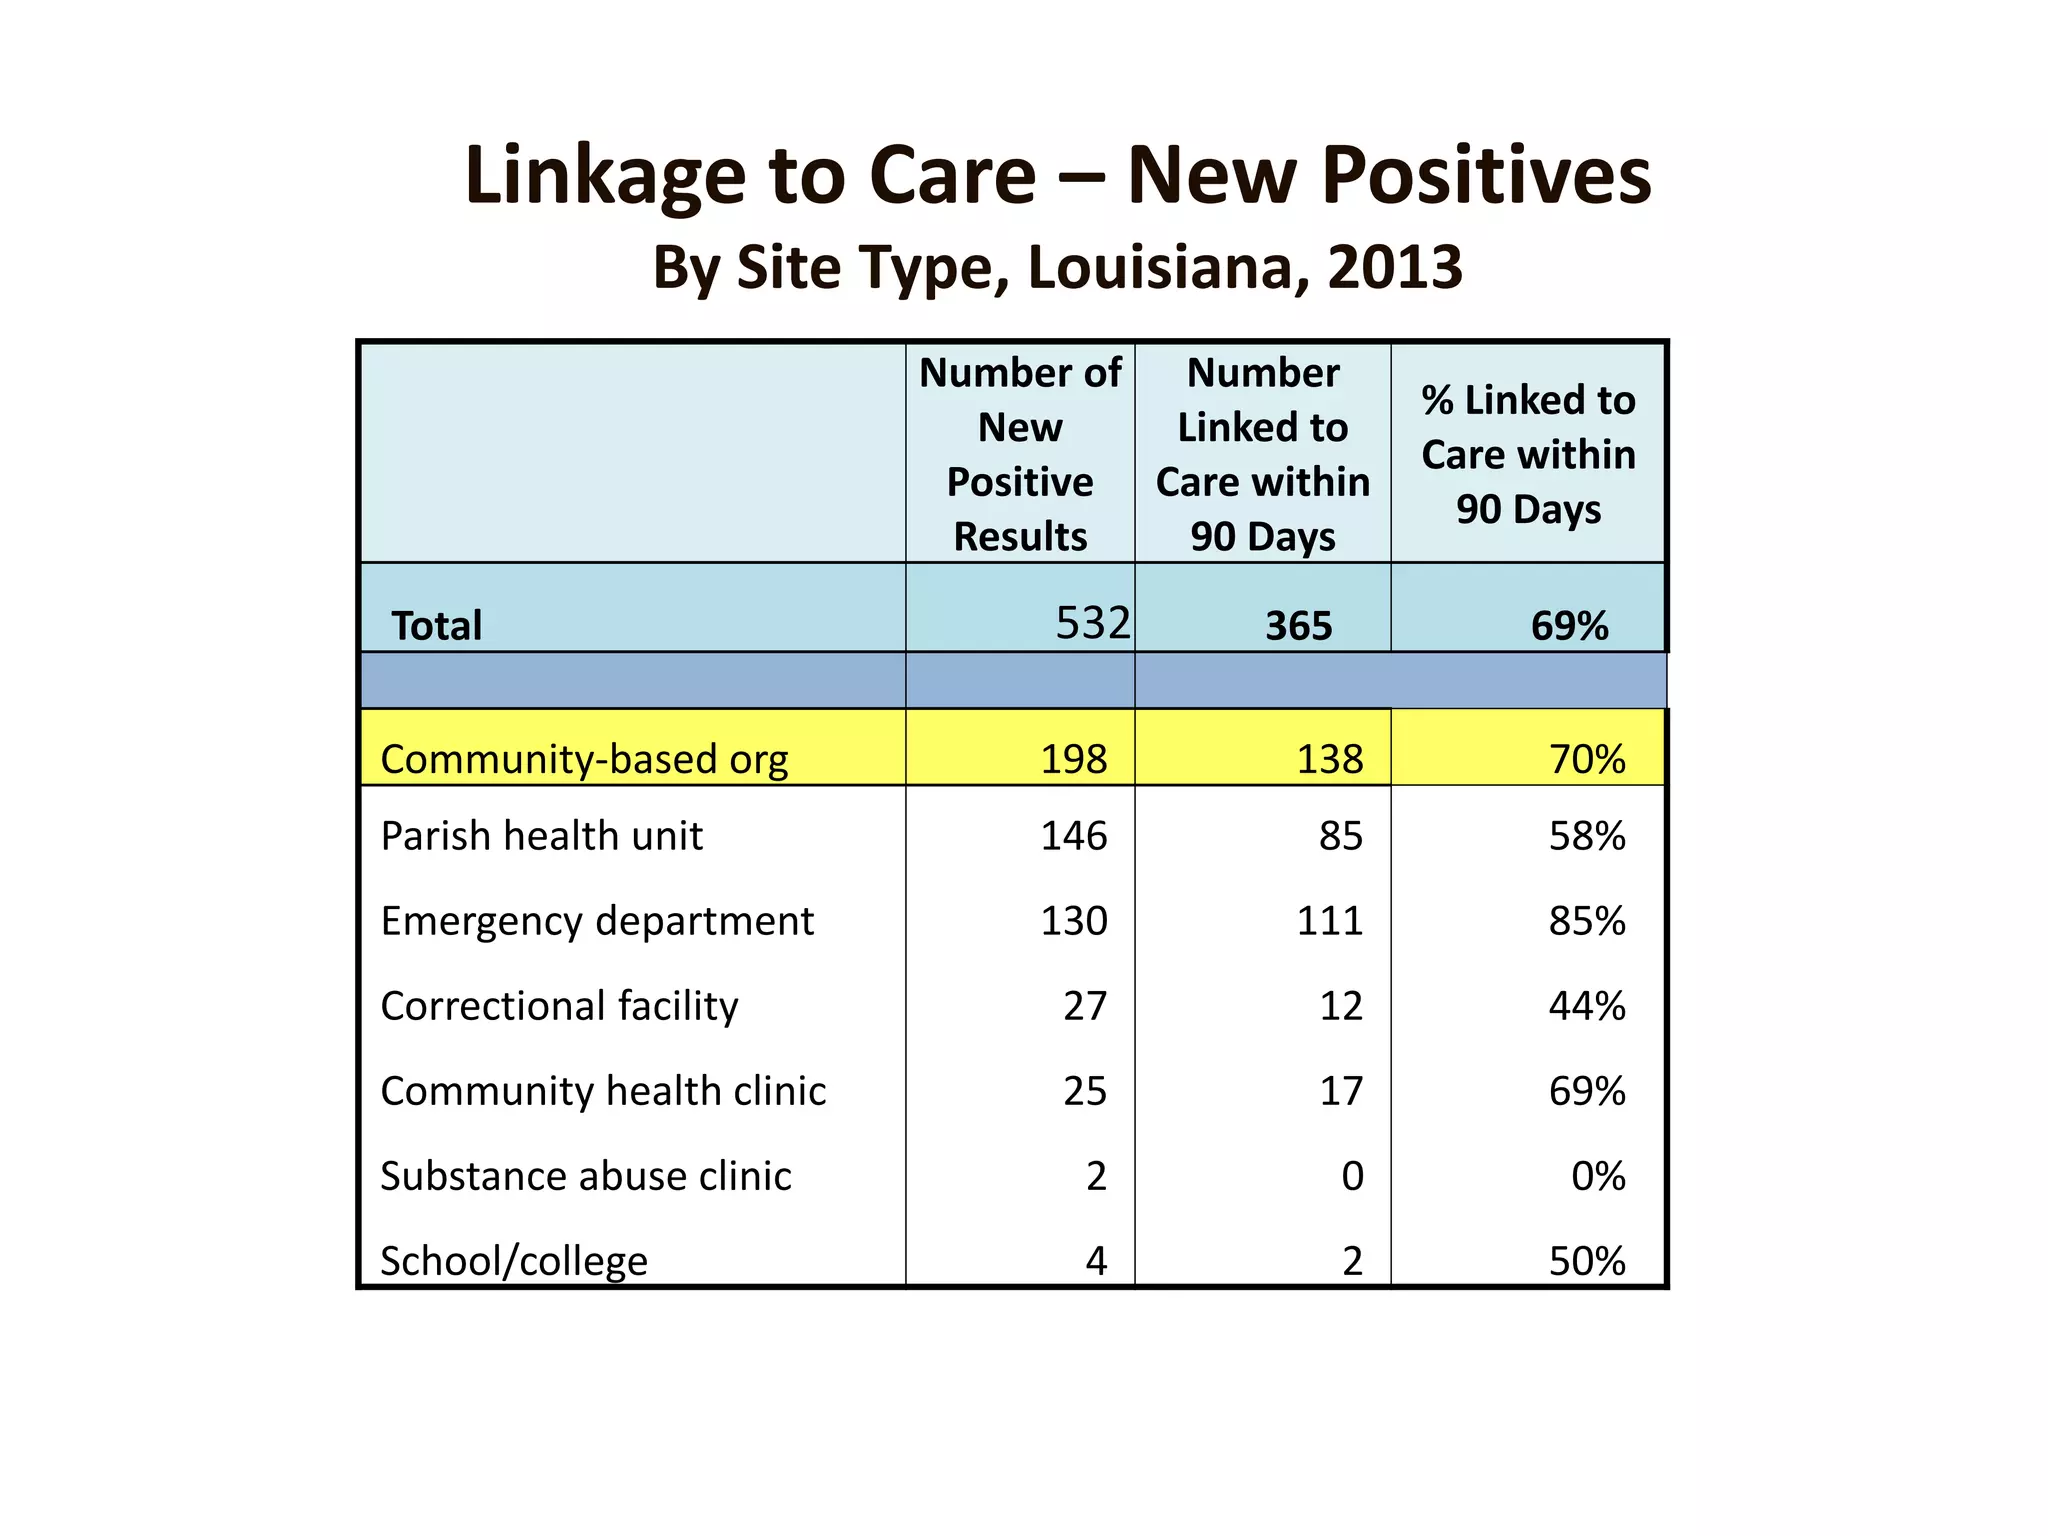
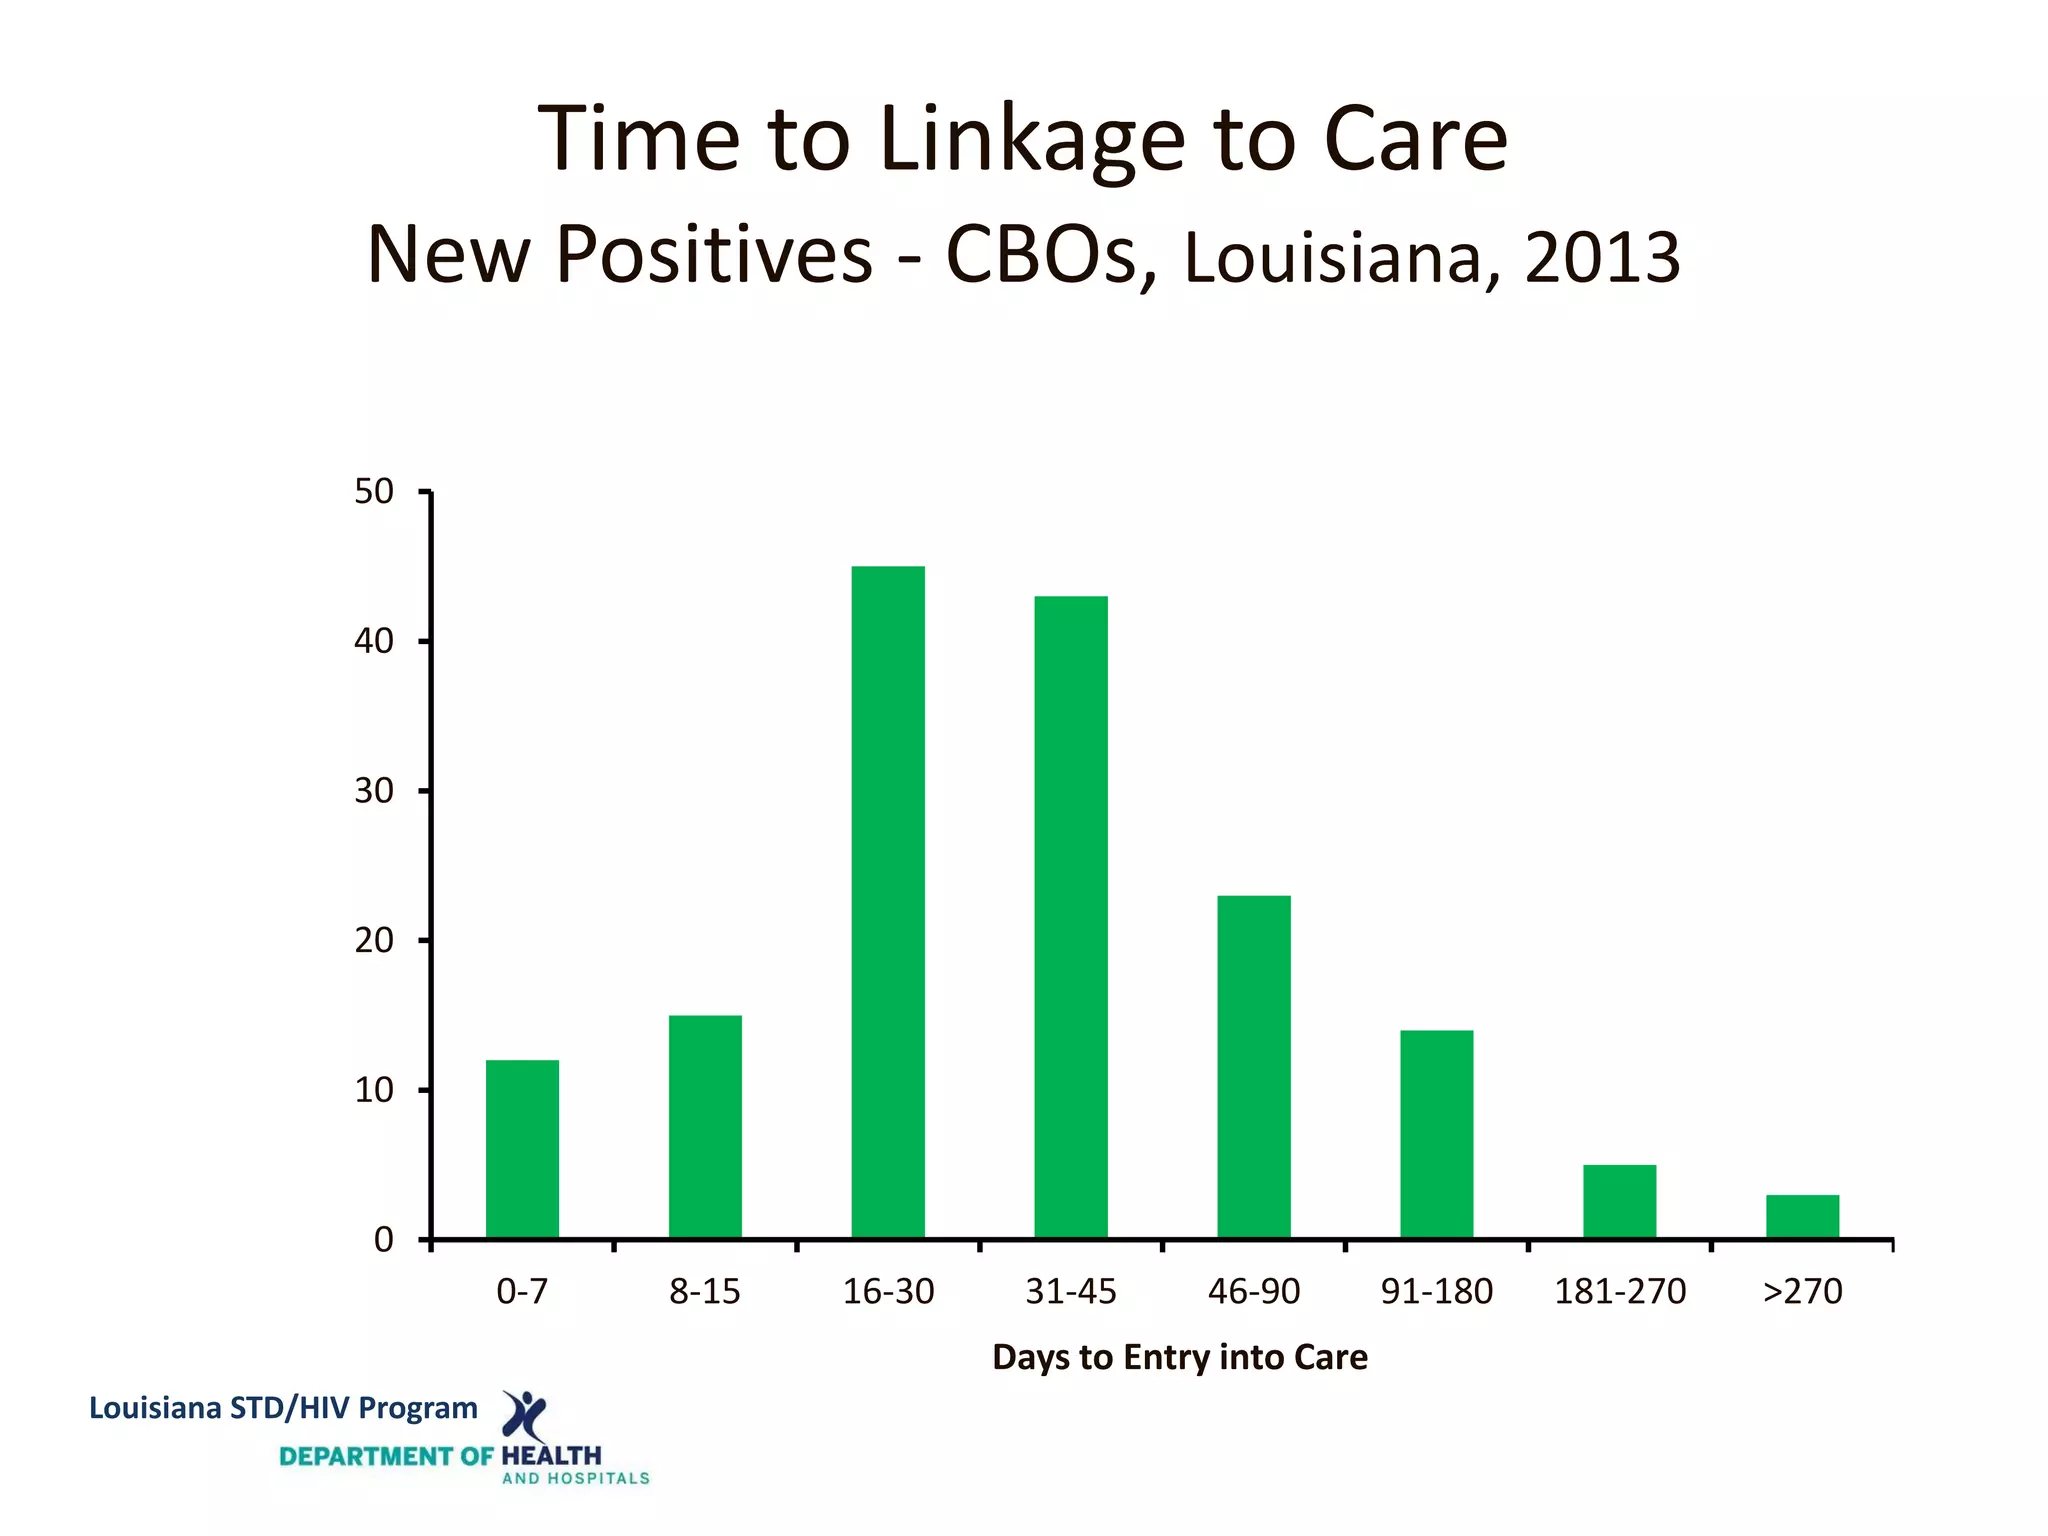
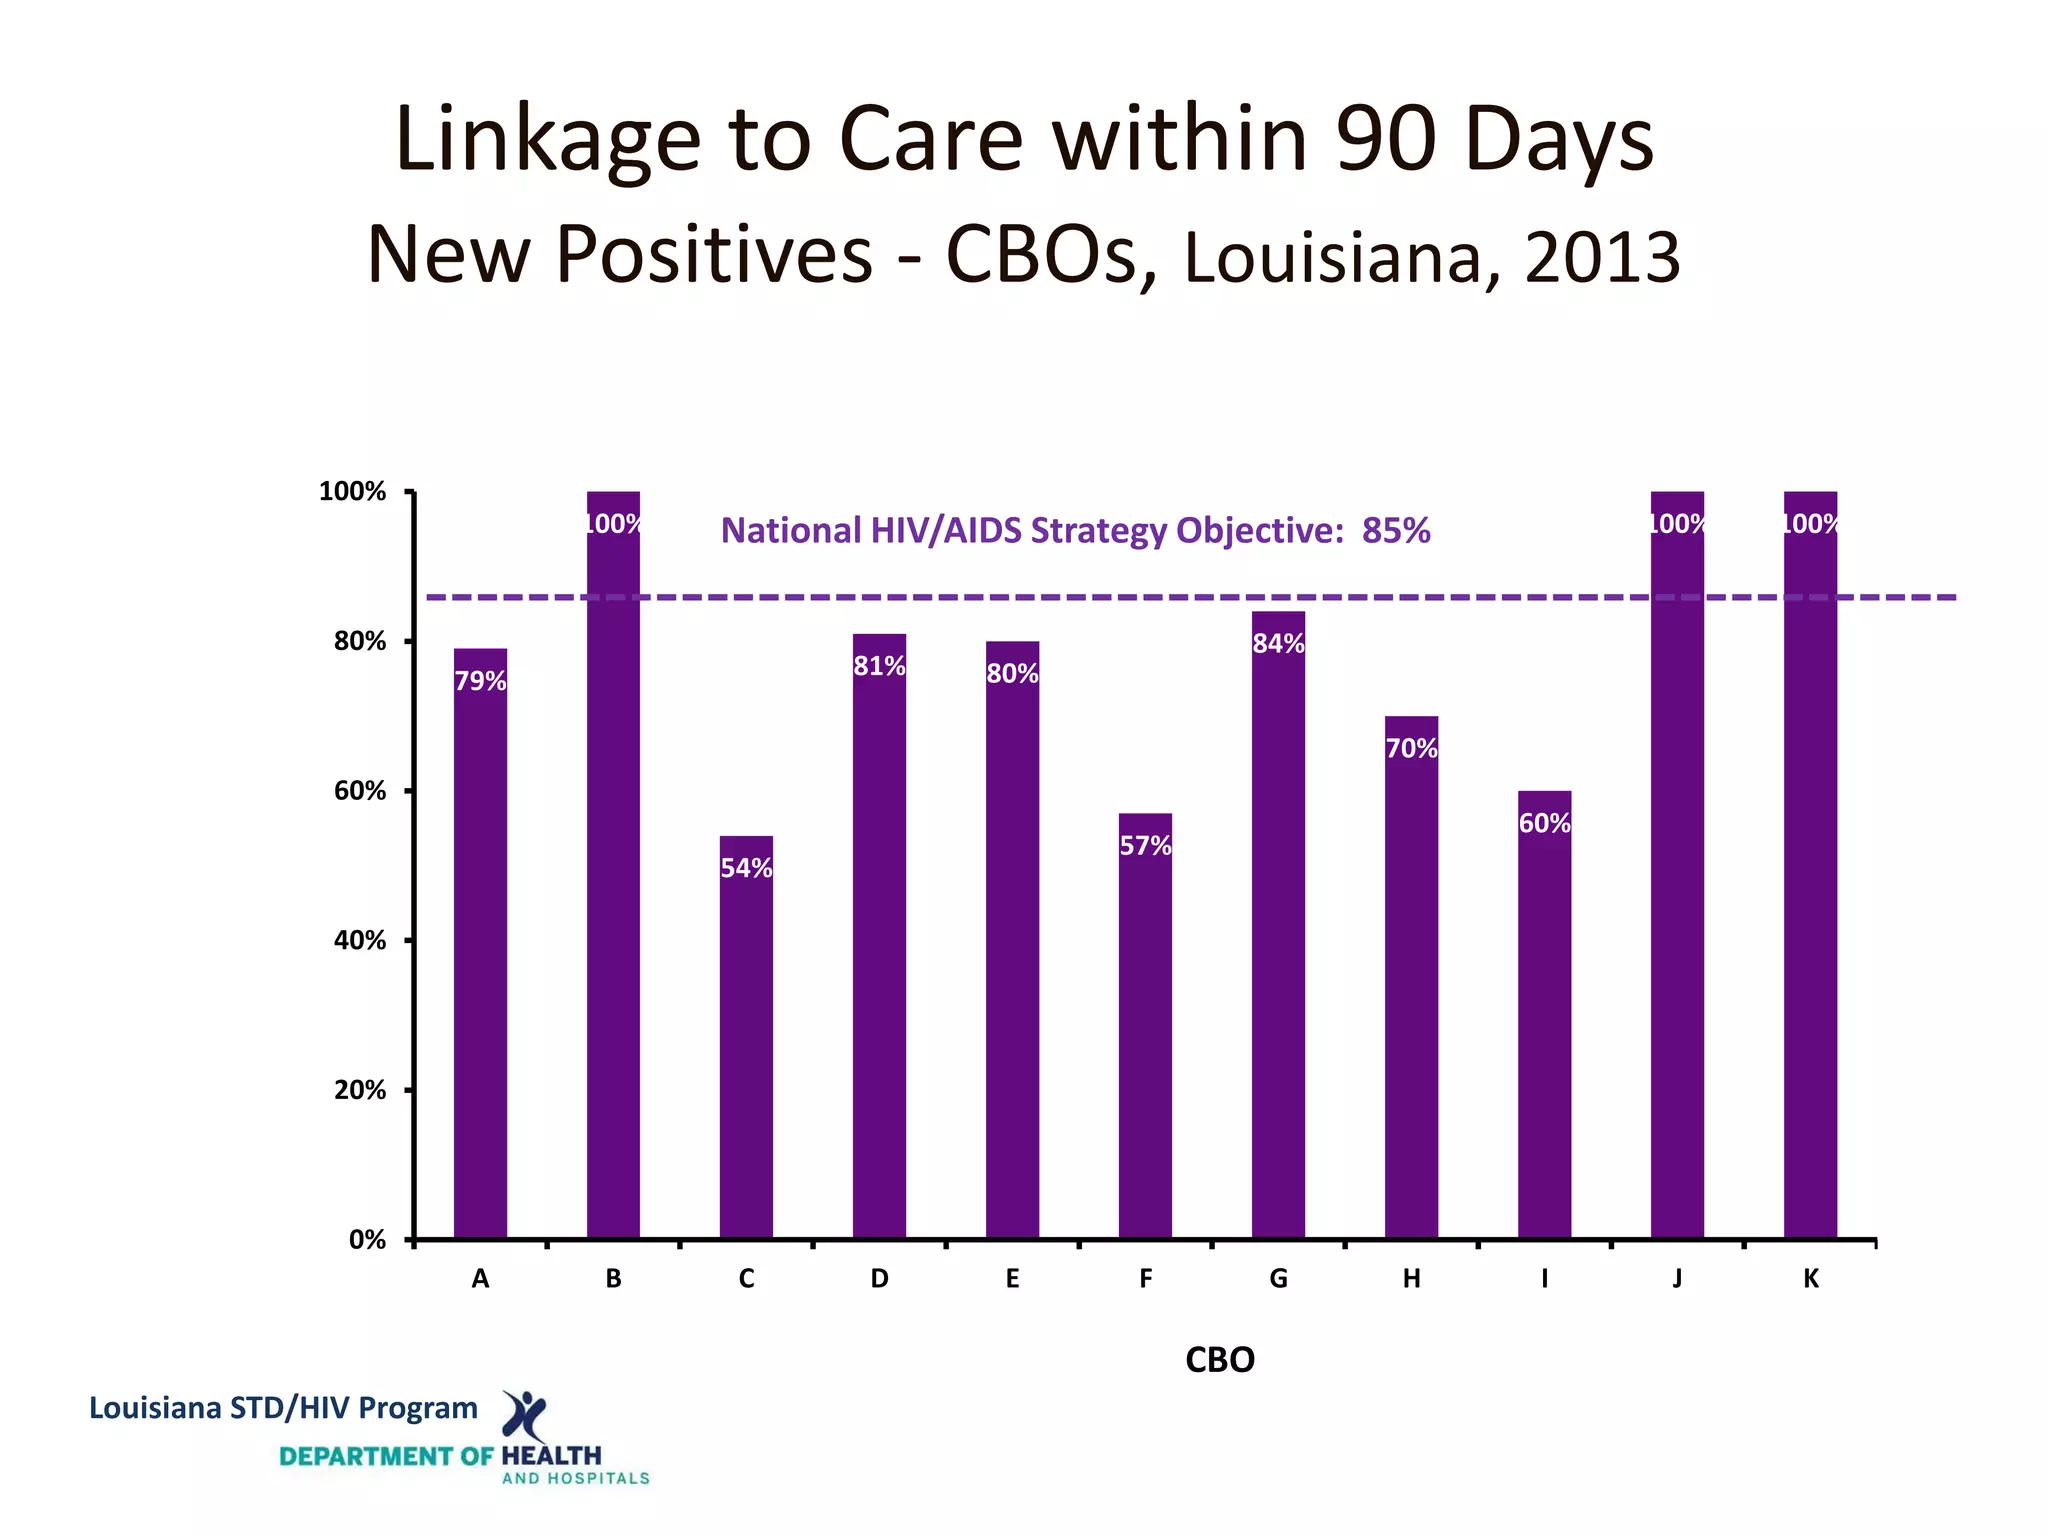
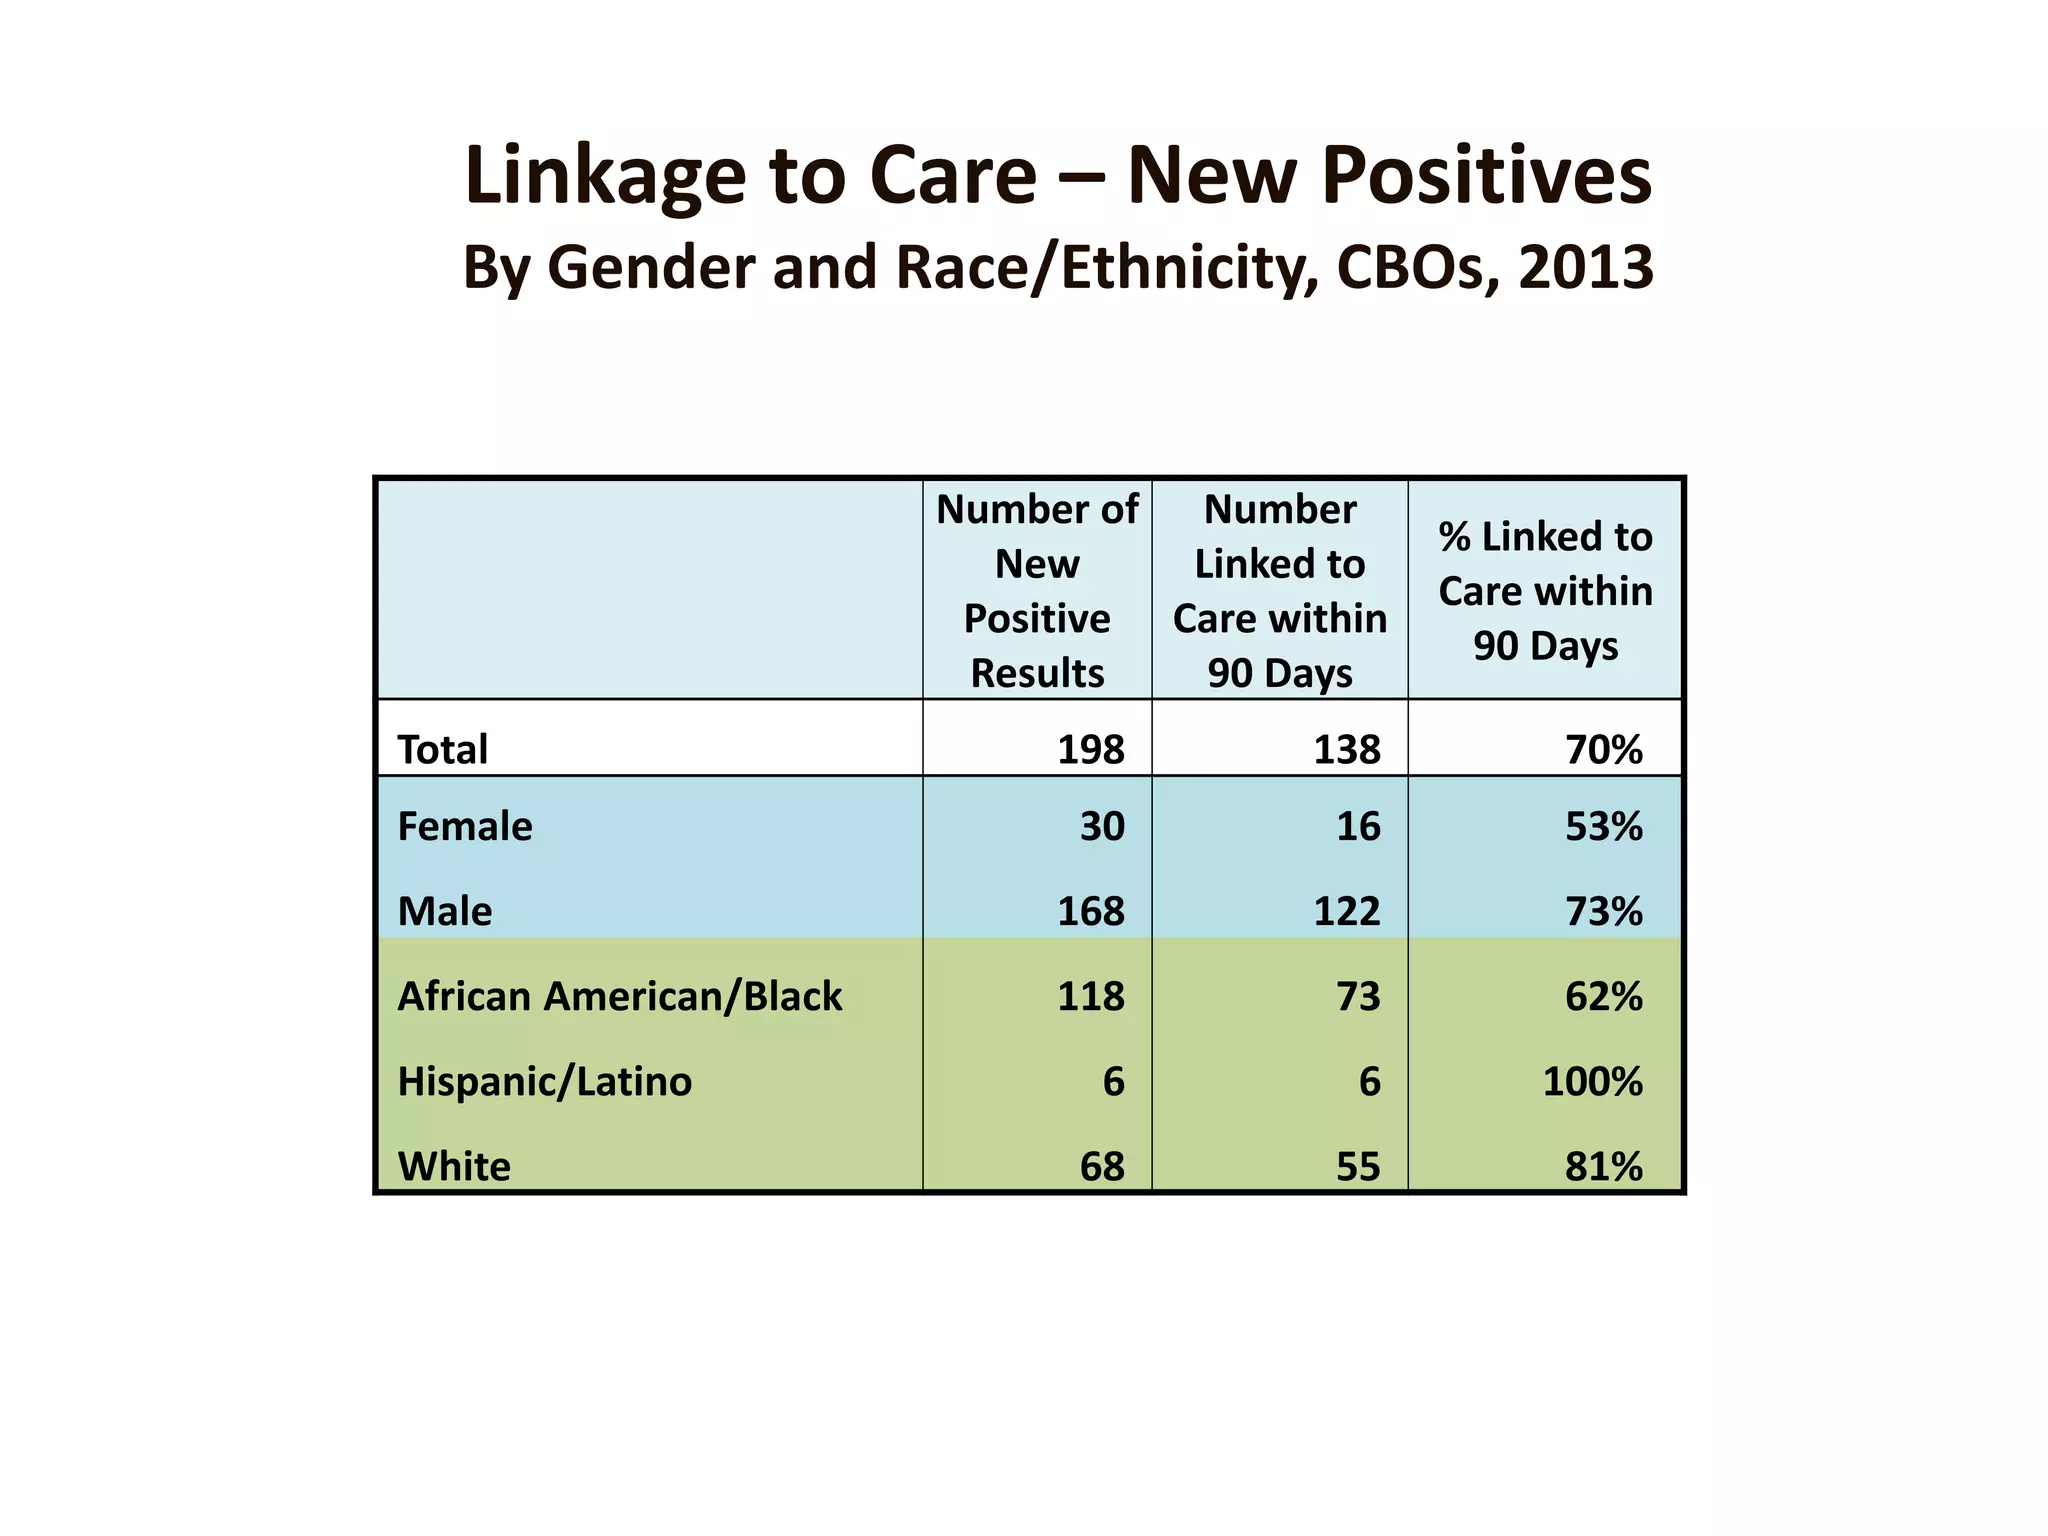
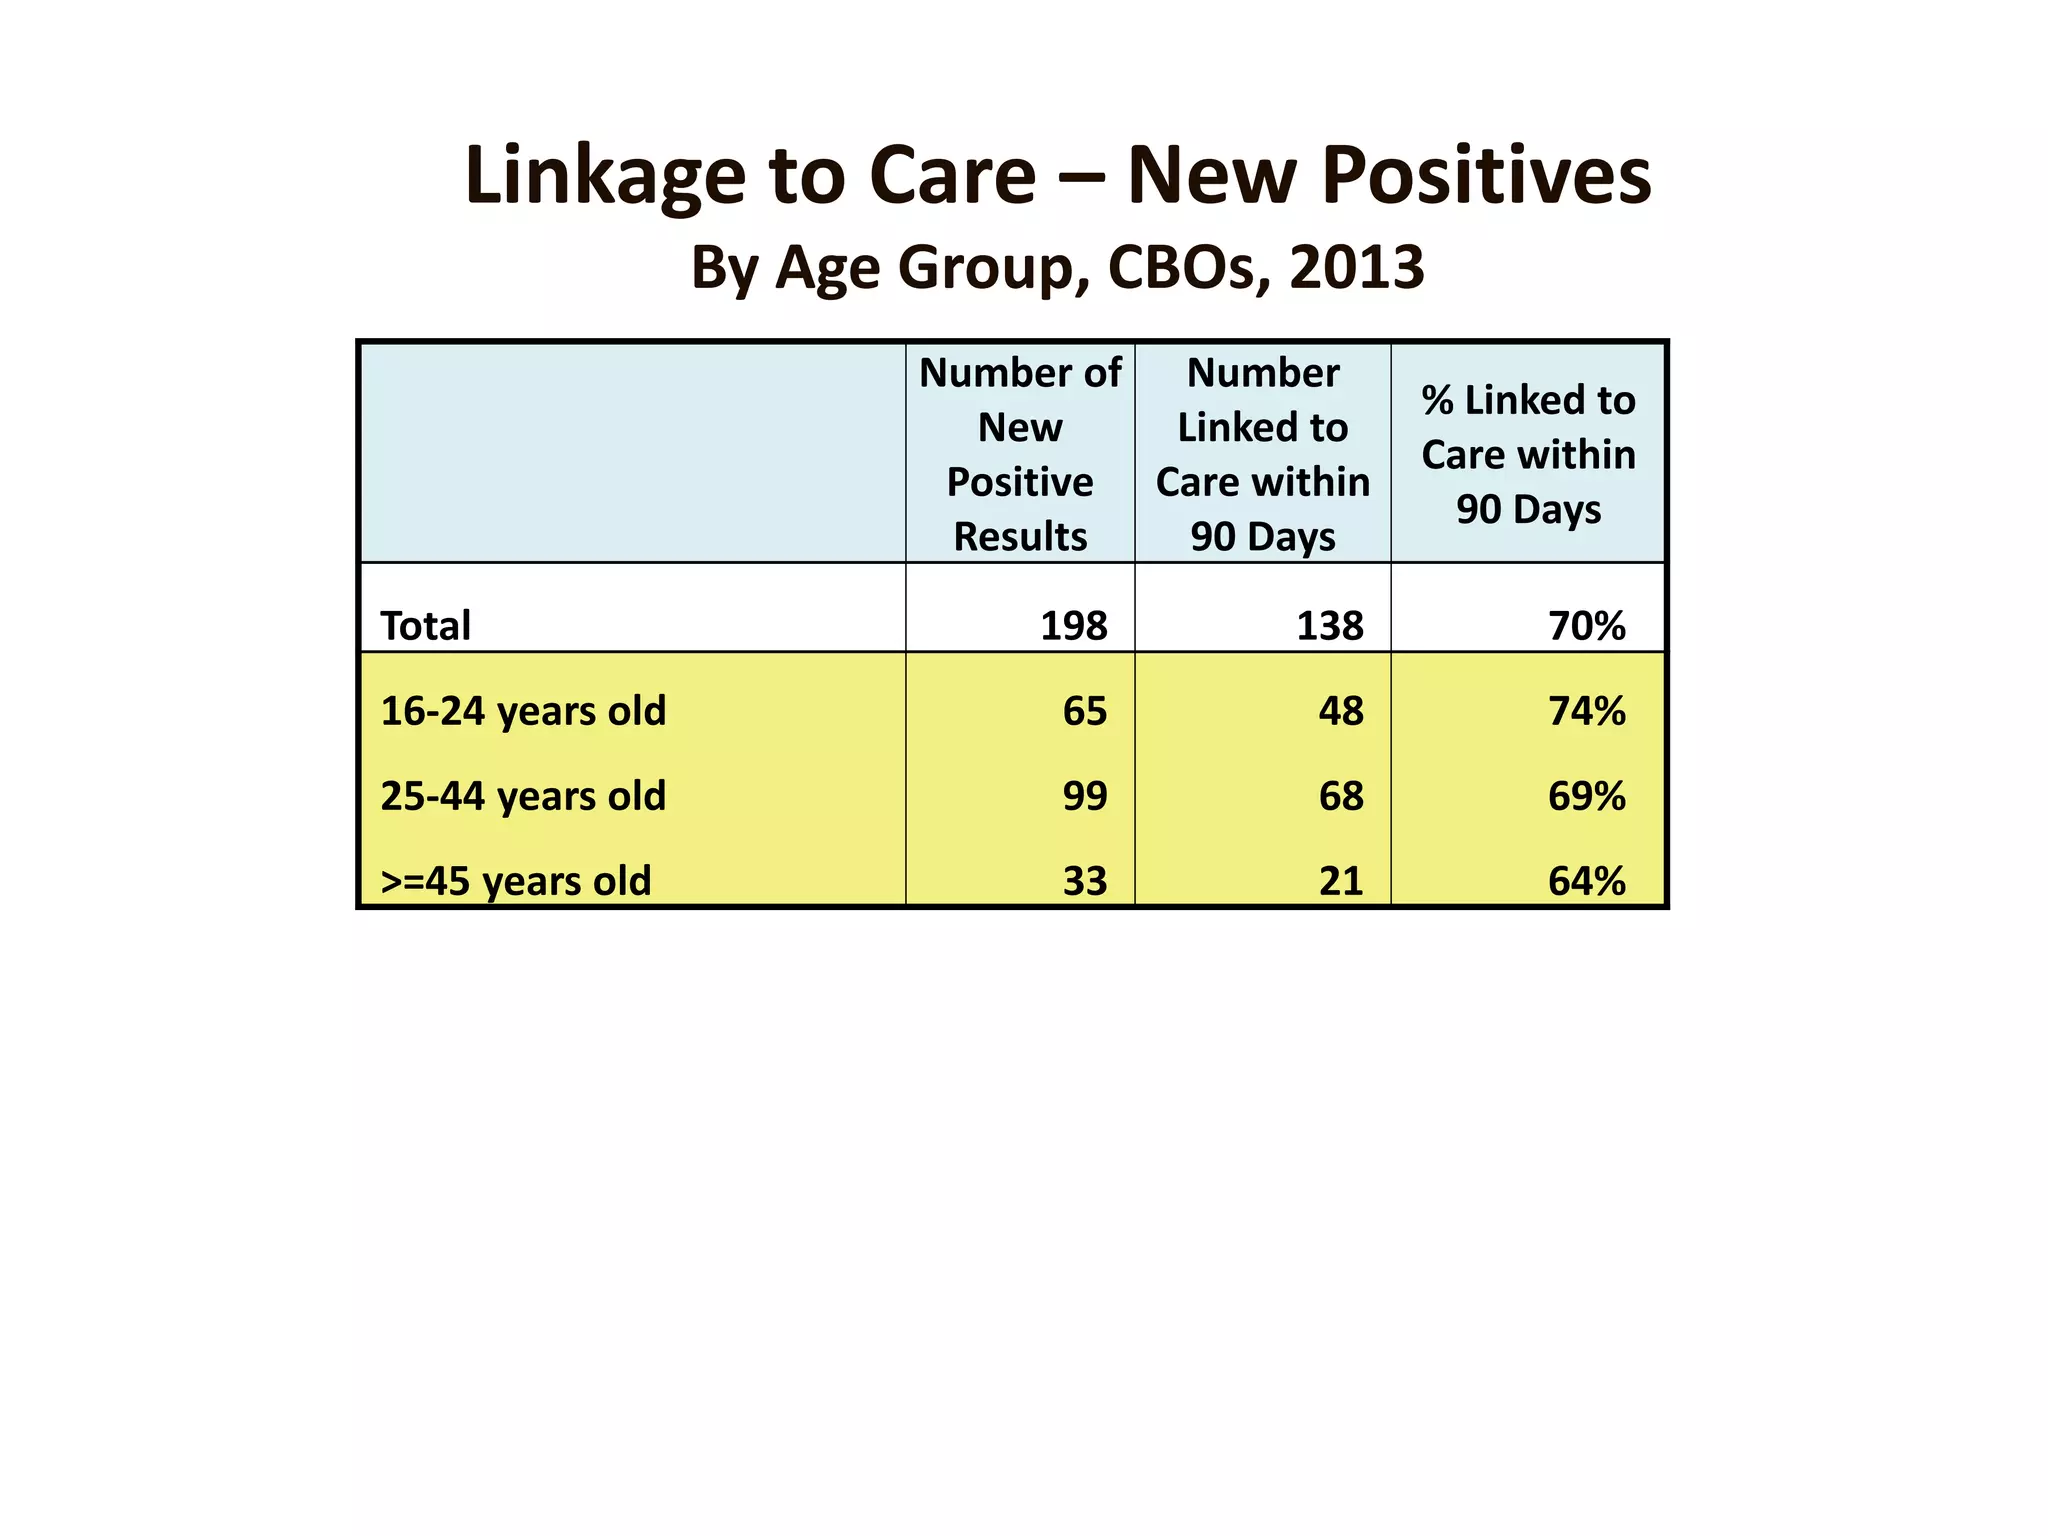
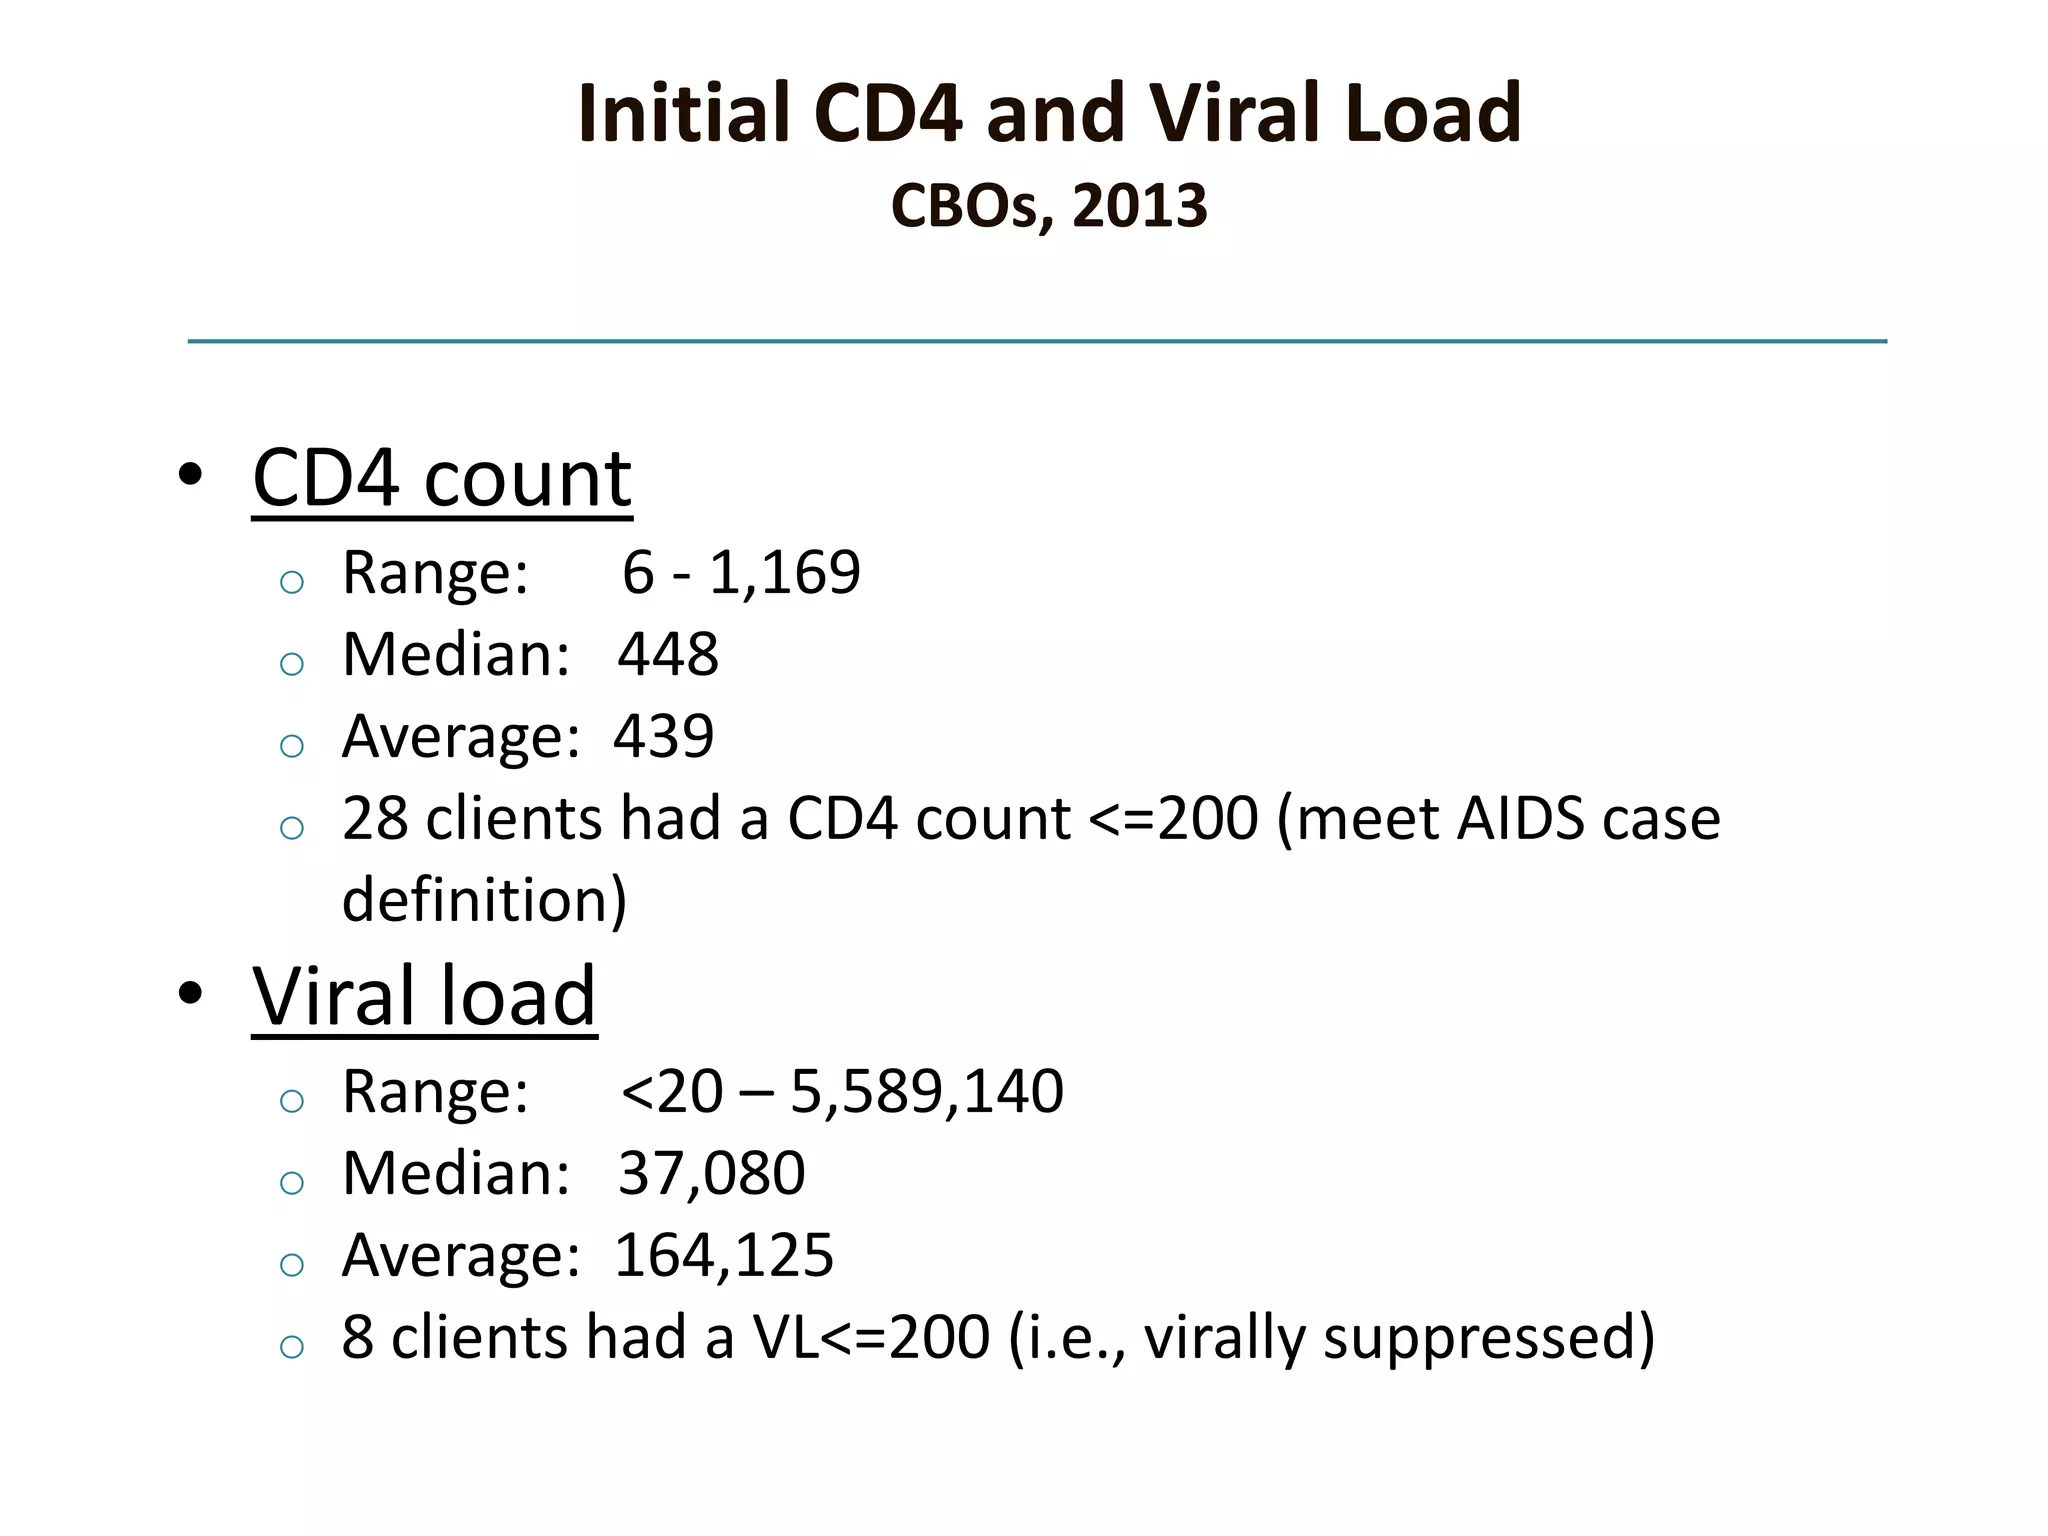
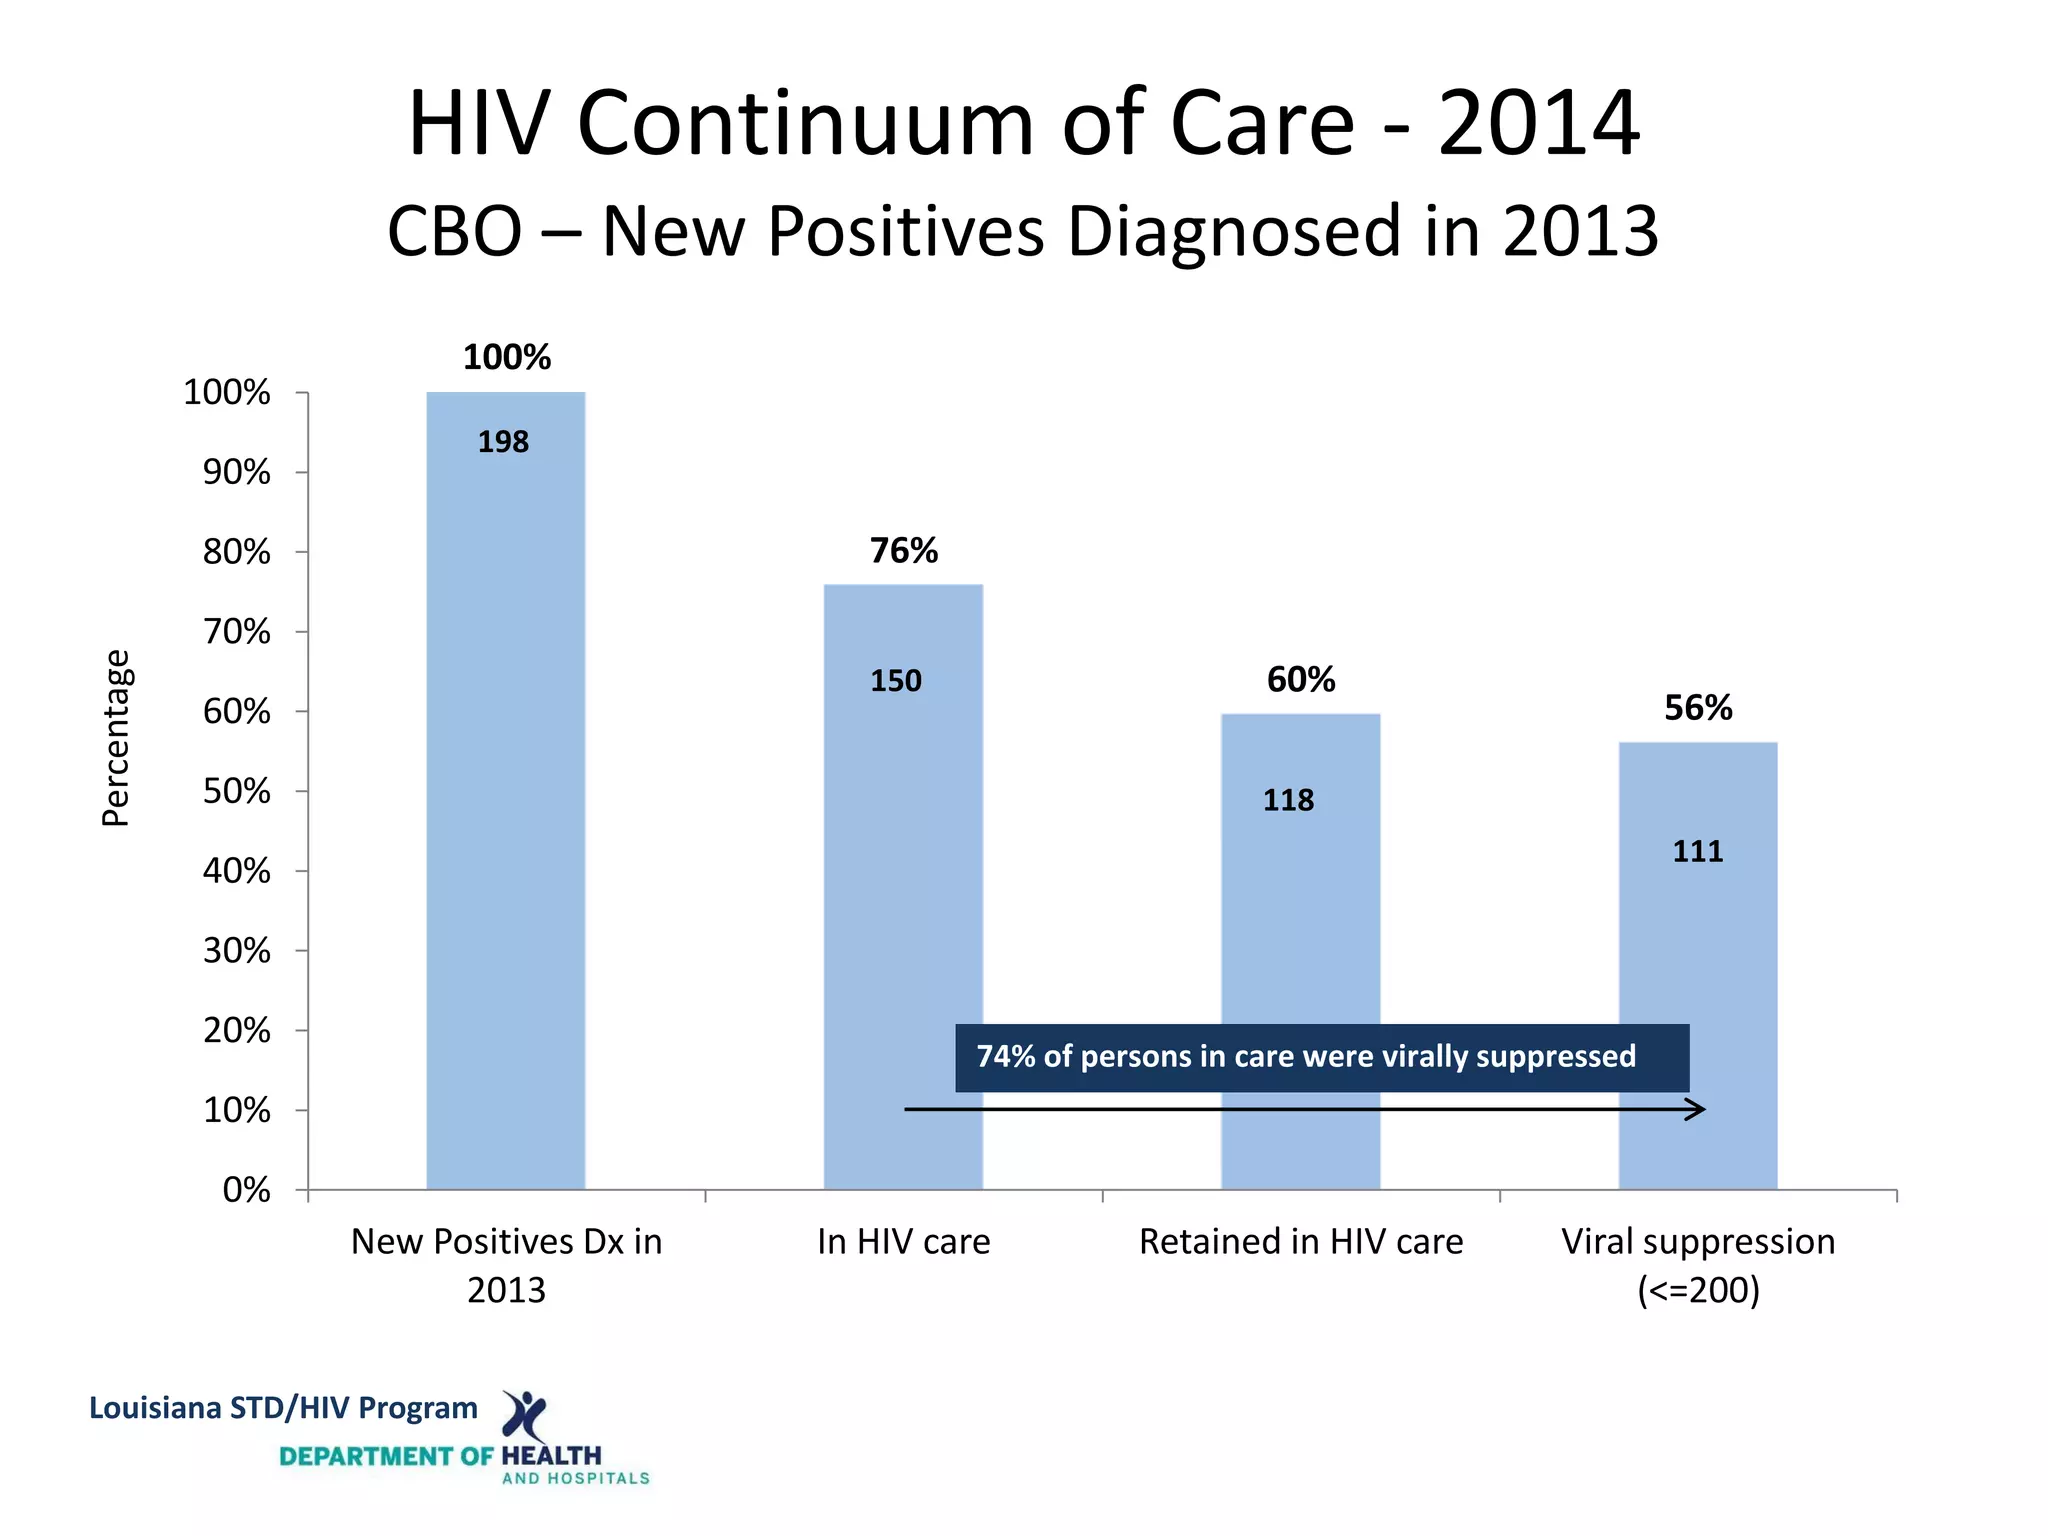
Using Data to Improve
Linkage to Care
Debbie Wendell, PhD, MPH
Louisiana STD/HIV Program
How can data be used to improve
programs?
• Where are the biggest gaps in the HIV
continuum of care?
• Are there race, gender or age disparities?
• How quickly are clients getting linked to
care?
• Are clients retained in care?
• How does my agency compare to others?
How do we measure linkage, retention and
viral suppression?
• Use CD4/VL results as a proxy for an
HIV-related medical visit
o All HIV-related test results are reportable in Louisiana
o Most are reported electronically on a daily basis
• Measurement standards
o Linkage: Was a person newly-diagnosed with HIV
linked to HIV-related medical care within 90 days?
o Retention: Did a person living with HIV have 2 or more
care visits within a 12 month period?
o Viral Suppression: Was the most recent VL <=200?
HIV Continuum of Care
Louisiana, 2013
100%
69%
54%
49%
0%
10%
20%
30%
40%
50%
60%
70%
80%
90%
100%
Persons living with HIV In HIV care Retained in HIV care Viral suppression
(<=200)
Percentage
18,199
9,774
12,536
8,831
70% of PLWH in care were virally suppressed
Louisiana STD/HIV Program
Percent Retained in Care among PLWH
by Region, Louisiana, 2013
Louisiana STD/HIV Program
52%
60% 60%
54%
46%
51%
46%
51%
53%
0%
10%
20%
30%
40%
50%
60%
70%
80%
90%
100%
Percentage
Region
Louisiana STD/HIV Program
Percent Virally Suppressed among PLWH in Care
by Region, Louisiana, 2013
Louisiana STD/HIV Program
68%
71%
75% 75%
71% 71% 68%
72%
76%
0%
10%
20%
30%
40%
50%
60%
70%
80%
90%
100%
Percentage
Region
Louisiana STD/HIV Program
HIV Continuum of Care by Race/Ethnicity
Louisiana, 2013
100% 100% 100%
70%
45%
70%
54%
35%
55%
46%
35%
58%
0%
10%
20%
30%
40%
50%
60%
70%
80%
90%
100%
Black Hispanic White
Percentage
PLWH
In HIV care
Retained in care
Viral suppression
66% of PLWH in
care were virally
suppressed
77% of PLWH in
care were virally
suppressed
82% of PLWH in
care were virally
suppressed
N = 12,442 N = 693 N = 4,861
Louisiana STD/HIV Program
HIV Testing by Site Type
Louisiana, 2013
Total Number of
Tests
(% of Tests)
Number of
Positive
Results
% Positivity
Total
Positives
Number of
New
Positives
% Positivity
New
Positives
Total 95,656 1,069 1.1% 532 0.6%
Parish health unit 36,347 (38%) 226 0.6% 146 0.4%
Emergency department 19,484 (20%) 235 1.2% 130 0.7%
Correctional facility 16,385 (17%) 275 1.7% 27 0.2%
Community-based org 15,701 (16%) 279 1.8% 198 1.3%
Community health clinic 4,206 (4%) 45 1.1% 25 0.6%
Substance abuse clinic 2,805(3%) 5 0.2% 2 0.7%
School/college 728 (1%) 4 0.5% 4 0.5%
Linkage to Care within 90 Days
Louisiana, 2007 -2014
67%
70% 70%
73% 74%
78% 79%
83%
0%
10%
20%
30%
40%
50%
60%
70%
80%
90%
100%
2007 2008 2009 2010 2011 2012 2013 2014
Year of Diagnosis
National HIV/AIDS Strategy Objective: 85%
Louisiana STD/HIV Program
Linkage to Care within 90 Days
by Region, 2013
Louisiana STD/HIV Program
78%
74%
86%
78%
90%
87%
74%
83%
85%
0%
10%
20%
30%
40%
50%
60%
70%
80%
90%
100%
Percentage
Region
National HIV/AIDS Strategy Objective: 85%
Louisiana STD/HIV Program
Linkage to Care – New Positives
By Site Type, Louisiana, 2013
Number of
New
Positive
Results
Number
Linked to
Care within
90 Days
% Linked to
Care within
90 Days
Total 532 365 69%
Community-based org 198 138 70%
Parish health unit 146 85 58%
Emergency department 130 111 85%
Correctional facility 27 12 44%
Community health clinic 25 17 69%
Substance abuse clinic 2 0 0%
School/college 4 2 50%
Time to Linkage to Care
New Positives - CBOs, Louisiana, 2013
0
10
20
30
40
50
0-7 8-15 16-30 31-45 46-90 91-180 181-270 >270
Days to Entry into Care
Louisiana STD/HIV Program
Linkage to Care within 90 Days
New Positives - CBOs, Louisiana, 2013
79%
100%
54%
81% 80%
57%
84%
70%
60%
100% 100%
0%
20%
40%
60%
80%
100%
A B C D E F G H I J K
CBO
Louisiana STD/HIV Program
National HIV/AIDS Strategy Objective: 85%
Linkage to Care – New Positives
By Gender and Race/Ethnicity, CBOs, 2013
Number of
New
Positive
Results
Number
Linked to
Care within
90 Days
% Linked to
Care within
90 Days
Total 198 138 70%
Female 30 16 53%
Male 168 122 73%
African American/Black 118 73 62%
Hispanic/Latino 6 6 100%
White 68 55 81%
Linkage to Care – New Positives
By Age Group, CBOs, 2013
Number of
New
Positive
Results
Number
Linked to
Care within
90 Days
% Linked to
Care within
90 Days
Total 198 138 70%
16-24 years old 65 48 74%
25-44 years old 99 68 69%
>=45 years old 33 21 64%
Initial CD4 and Viral Load
CBOs, 2013
• CD4 count
o Range: 6 - 1,169
o Median: 448
o Average: 439
o 28 clients had a CD4 count <=200 (meet AIDS case
definition)
• Viral load
o Range: <20 – 5,589,140
o Median: 37,080
o Average: 164,125
o 8 clients had a VL<=200 (i.e., virally suppressed)
HIV Continuum of Care - 2014
CBO – New Positives Diagnosed in 2013
100%
76%
60%
56%
0%
10%
20%
30%
40%
50%
60%
70%
80%
90%
100%
New Positives Dx in
2013
In HIV care Retained in HIV care Viral suppression
(<=200)
Percentage
198
118
150
111
74% of persons in care were virally suppressed
Louisiana STD/HIV Program
Evaluating Linkage to Care
• How do you evaluate linkage/retention in
care at your agency?
• Do you collect any data to look at linkage to
care?
• What are the data gaps?
• How can SHP help provide you useful data?
Questions?
For more information:
Debbie Wendell, PhD, MPH
STD/HIV Program
Louisiana Office of Public Health
(504) 568-7474
debbie.wendell@la.gov

Using Data to Improve Linkage to Care

  • 1.
    Using Data toImprove Linkage to Care Debbie Wendell, PhD, MPH Louisiana STD/HIV Program Louisiana STD/HIV Program
  • 2.
    How can databe used to improve programs? • Where are the biggest gaps in the HIV continuum of care? • Are there race, gender or age disparities? • How quickly are clients getting linked to care? • Are clients retained in care? • How does my agency compare to others?
  • 3.
    How do wemeasure linkage, retention and viral suppression? • Use CD4/VL results as a proxy for an HIV-related medical visit o All HIV-related test results are reportable in Louisiana o Most are reported electronically on a daily basis • Measurement standards o Linkage: Was a person newly-diagnosed with HIV linked to HIV-related medical care within 90 days? o Retention: Did a person living with HIV have 2 or more care visits within a 12 month period? o Viral Suppression: Was the most recent VL <=200?
  • 4.
    HIV Continuum ofCare Louisiana, 2013 100% 69% 54% 49% 0% 10% 20% 30% 40% 50% 60% 70% 80% 90% 100% Persons living with HIV In HIV care Retained in HIV care Viral suppression (<=200) Percentage 18,199 9,774 12,536 8,831 70% of PLWH in care were virally suppressed Louisiana STD/HIV Program
  • 5.
    Percent Retained inCare among PLWH by Region, Louisiana, 2013 Louisiana STD/HIV Program 52% 60% 60% 54% 46% 51% 46% 51% 53% 0% 10% 20% 30% 40% 50% 60% 70% 80% 90% 100% Percentage Region Louisiana STD/HIV Program
  • 6.
    Percent Virally Suppressedamong PLWH in Care by Region, Louisiana, 2013 Louisiana STD/HIV Program 68% 71% 75% 75% 71% 71% 68% 72% 76% 0% 10% 20% 30% 40% 50% 60% 70% 80% 90% 100% Percentage Region Louisiana STD/HIV Program
  • 7.
    HIV Continuum ofCare by Race/Ethnicity Louisiana, 2013 100% 100% 100% 70% 45% 70% 54% 35% 55% 46% 35% 58% 0% 10% 20% 30% 40% 50% 60% 70% 80% 90% 100% Black Hispanic White Percentage PLWH In HIV care Retained in care Viral suppression 66% of PLWH in care were virally suppressed 77% of PLWH in care were virally suppressed 82% of PLWH in care were virally suppressed N = 12,442 N = 693 N = 4,861 Louisiana STD/HIV Program
  • 8.
    HIV Testing bySite Type Louisiana, 2013 Total Number of Tests (% of Tests) Number of Positive Results % Positivity Total Positives Number of New Positives % Positivity New Positives Total 95,656 1,069 1.1% 532 0.6% Parish health unit 36,347 (38%) 226 0.6% 146 0.4% Emergency department 19,484 (20%) 235 1.2% 130 0.7% Correctional facility 16,385 (17%) 275 1.7% 27 0.2% Community-based org 15,701 (16%) 279 1.8% 198 1.3% Community health clinic 4,206 (4%) 45 1.1% 25 0.6% Substance abuse clinic 2,805(3%) 5 0.2% 2 0.7% School/college 728 (1%) 4 0.5% 4 0.5%
  • 9.
    Linkage to Carewithin 90 Days Louisiana, 2007 -2014 67% 70% 70% 73% 74% 78% 79% 83% 0% 10% 20% 30% 40% 50% 60% 70% 80% 90% 100% 2007 2008 2009 2010 2011 2012 2013 2014 Year of Diagnosis National HIV/AIDS Strategy Objective: 85% Louisiana STD/HIV Program
  • 10.
    Linkage to Carewithin 90 Days by Region, 2013 Louisiana STD/HIV Program 78% 74% 86% 78% 90% 87% 74% 83% 85% 0% 10% 20% 30% 40% 50% 60% 70% 80% 90% 100% Percentage Region National HIV/AIDS Strategy Objective: 85% Louisiana STD/HIV Program
  • 11.
    Linkage to Care– New Positives By Site Type, Louisiana, 2013 Number of New Positive Results Number Linked to Care within 90 Days % Linked to Care within 90 Days Total 532 365 69% Community-based org 198 138 70% Parish health unit 146 85 58% Emergency department 130 111 85% Correctional facility 27 12 44% Community health clinic 25 17 69% Substance abuse clinic 2 0 0% School/college 4 2 50%
  • 12.
    Time to Linkageto Care New Positives - CBOs, Louisiana, 2013 0 10 20 30 40 50 0-7 8-15 16-30 31-45 46-90 91-180 181-270 >270 Days to Entry into Care Louisiana STD/HIV Program
  • 13.
    Linkage to Carewithin 90 Days New Positives - CBOs, Louisiana, 2013 79% 100% 54% 81% 80% 57% 84% 70% 60% 100% 100% 0% 20% 40% 60% 80% 100% A B C D E F G H I J K CBO Louisiana STD/HIV Program National HIV/AIDS Strategy Objective: 85%
  • 14.
    Linkage to Care– New Positives By Gender and Race/Ethnicity, CBOs, 2013 Number of New Positive Results Number Linked to Care within 90 Days % Linked to Care within 90 Days Total 198 138 70% Female 30 16 53% Male 168 122 73% African American/Black 118 73 62% Hispanic/Latino 6 6 100% White 68 55 81%
  • 15.
    Linkage to Care– New Positives By Age Group, CBOs, 2013 Number of New Positive Results Number Linked to Care within 90 Days % Linked to Care within 90 Days Total 198 138 70% 16-24 years old 65 48 74% 25-44 years old 99 68 69% >=45 years old 33 21 64%
  • 16.
    Initial CD4 andViral Load CBOs, 2013 • CD4 count o Range: 6 - 1,169 o Median: 448 o Average: 439 o 28 clients had a CD4 count <=200 (meet AIDS case definition) • Viral load o Range: <20 – 5,589,140 o Median: 37,080 o Average: 164,125 o 8 clients had a VL<=200 (i.e., virally suppressed)
  • 17.
    HIV Continuum ofCare - 2014 CBO – New Positives Diagnosed in 2013 100% 76% 60% 56% 0% 10% 20% 30% 40% 50% 60% 70% 80% 90% 100% New Positives Dx in 2013 In HIV care Retained in HIV care Viral suppression (<=200) Percentage 198 118 150 111 74% of persons in care were virally suppressed Louisiana STD/HIV Program
  • 18.
    Evaluating Linkage toCare • How do you evaluate linkage/retention in care at your agency? • Do you collect any data to look at linkage to care? • What are the data gaps? • How can SHP help provide you useful data?
  • 19.
    Questions? For more information: DebbieWendell, PhD, MPH STD/HIV Program Louisiana Office of Public Health (504) 568-7474 debbie.wendell@la.gov