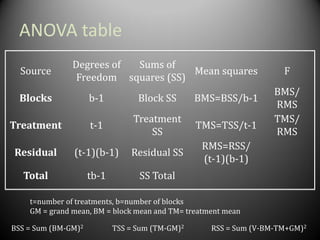
This document provides an overview of the randomized complete block design (RCBD) and how to analyze this type of experiment using SAS. It describes how RCBD controls for spatial variation by grouping similar experimental units into blocks. Treatments are randomly assigned to subjects within each block. The document discusses advantages and disadvantages of RCBD, provides examples of randomization in Excel and SAS output, and reviews the model and ANOVA table used to analyze RCBD experiments in SAS.


![Excel randomization
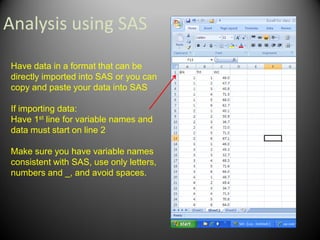
To generate random numbers
Use =RAND () ctrl enter
Randomize blocks
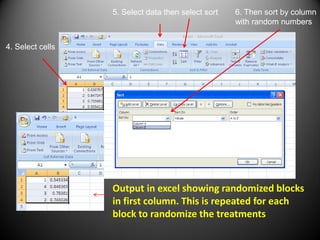
[DATA, SORT by column w/ =rand()]
• Randomize treatments in each block
independently
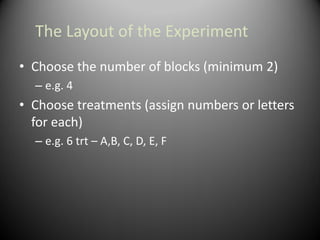
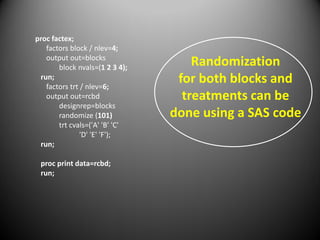
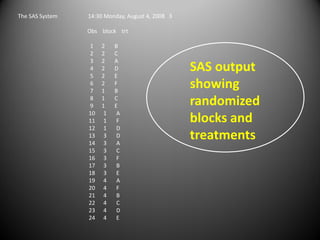
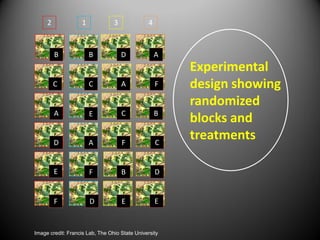
The first step is to randomize
the treatments and blocks.
This can be done in excel
using the RAND function](https://image.slidesharecdn.com/randomizedcompleteblockdesigntutorial-230220031613-f8573335/85/RandomizedCompleteBlockDesignTutorial-pdf-9-320.jpg)


![External Link
SAS [Online]. SAS Institute. Available at: www.sas.com/ (verified 5 Jan
2011).](https://image.slidesharecdn.com/randomizedcompleteblockdesigntutorial-230220031613-f8573335/85/RandomizedCompleteBlockDesignTutorial-pdf-26-320.jpg)


![RBD AIML[1]hhgyffffffdrrrrRead-Only.pptx.](https://cdn.slidesharecdn.com/ss_thumbnails/rbdaiml1-read-only-240715053531-ba227cd1-thumbnail.jpg?width=640&height=640&fit=bounds)


