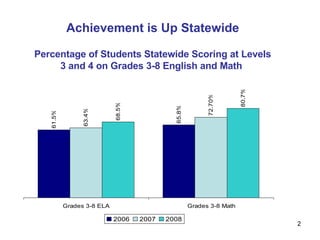
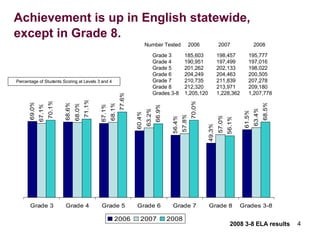
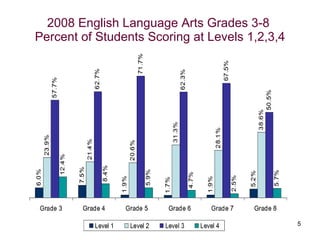
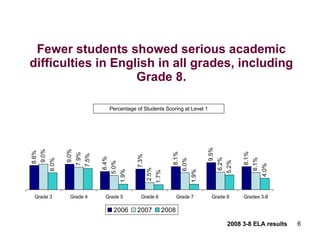
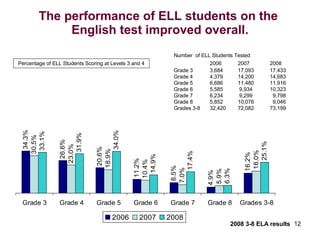
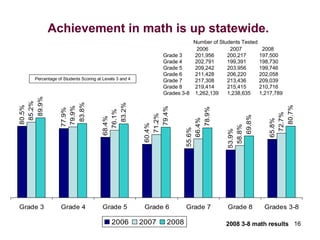
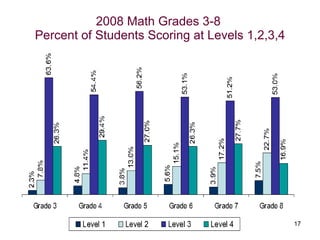
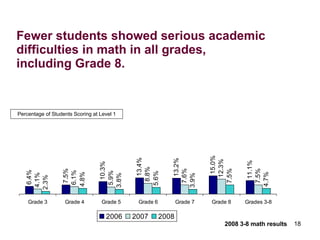
1) Statewide achievement on 3rd-8th grade English and math tests was up in 2008, with fewer students scoring at the lowest level.
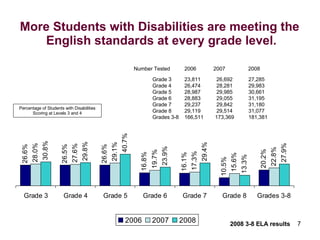
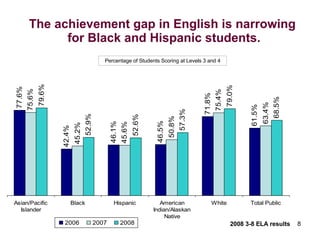
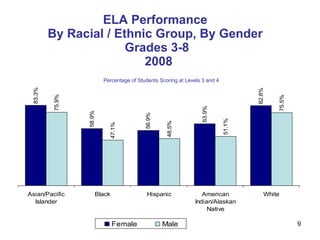
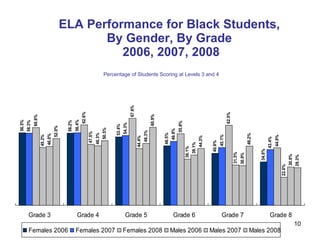
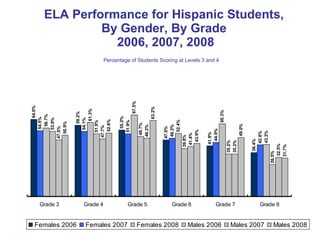
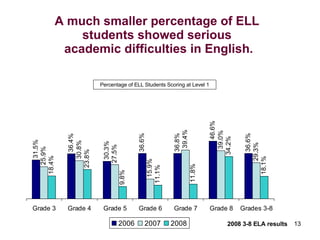
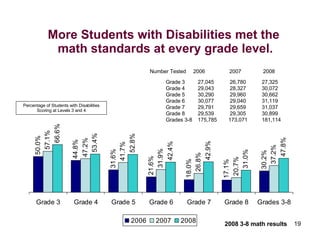
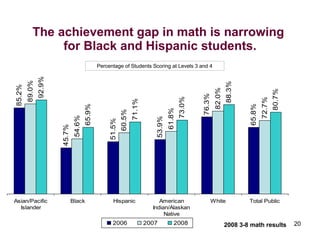
2) The achievement gap is narrowing for disadvantaged groups like black, Hispanic, disabled, and English language learning students.
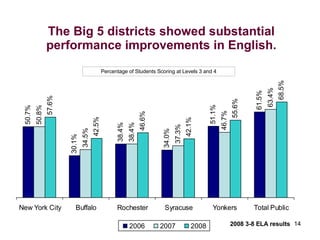
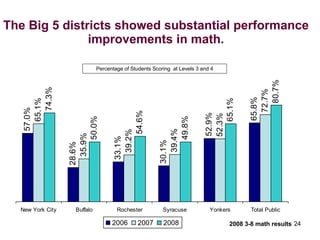
3) Major city school districts showed substantial gains in English and math performance.


![Spring 2011 state assessment results_12.13.11[1]](https://cdn.slidesharecdn.com/ss_thumbnails/spring2011stateassessmentresults12-13-111-120116110011-phpapp01-thumbnail.jpg?width=640&height=640&fit=bounds)


![Achievement Gap[1]](https://cdn.slidesharecdn.com/ss_thumbnails/achievementgap1-1221437383954673-9-thumbnail.jpg?width=640&height=640&fit=bounds)


![Achievement Gap[1]](https://cdn.slidesharecdn.com/ss_thumbnails/achievementgap1-1221437581878507-8-thumbnail.jpg?width=640&height=640&fit=bounds)


