Download to read offline

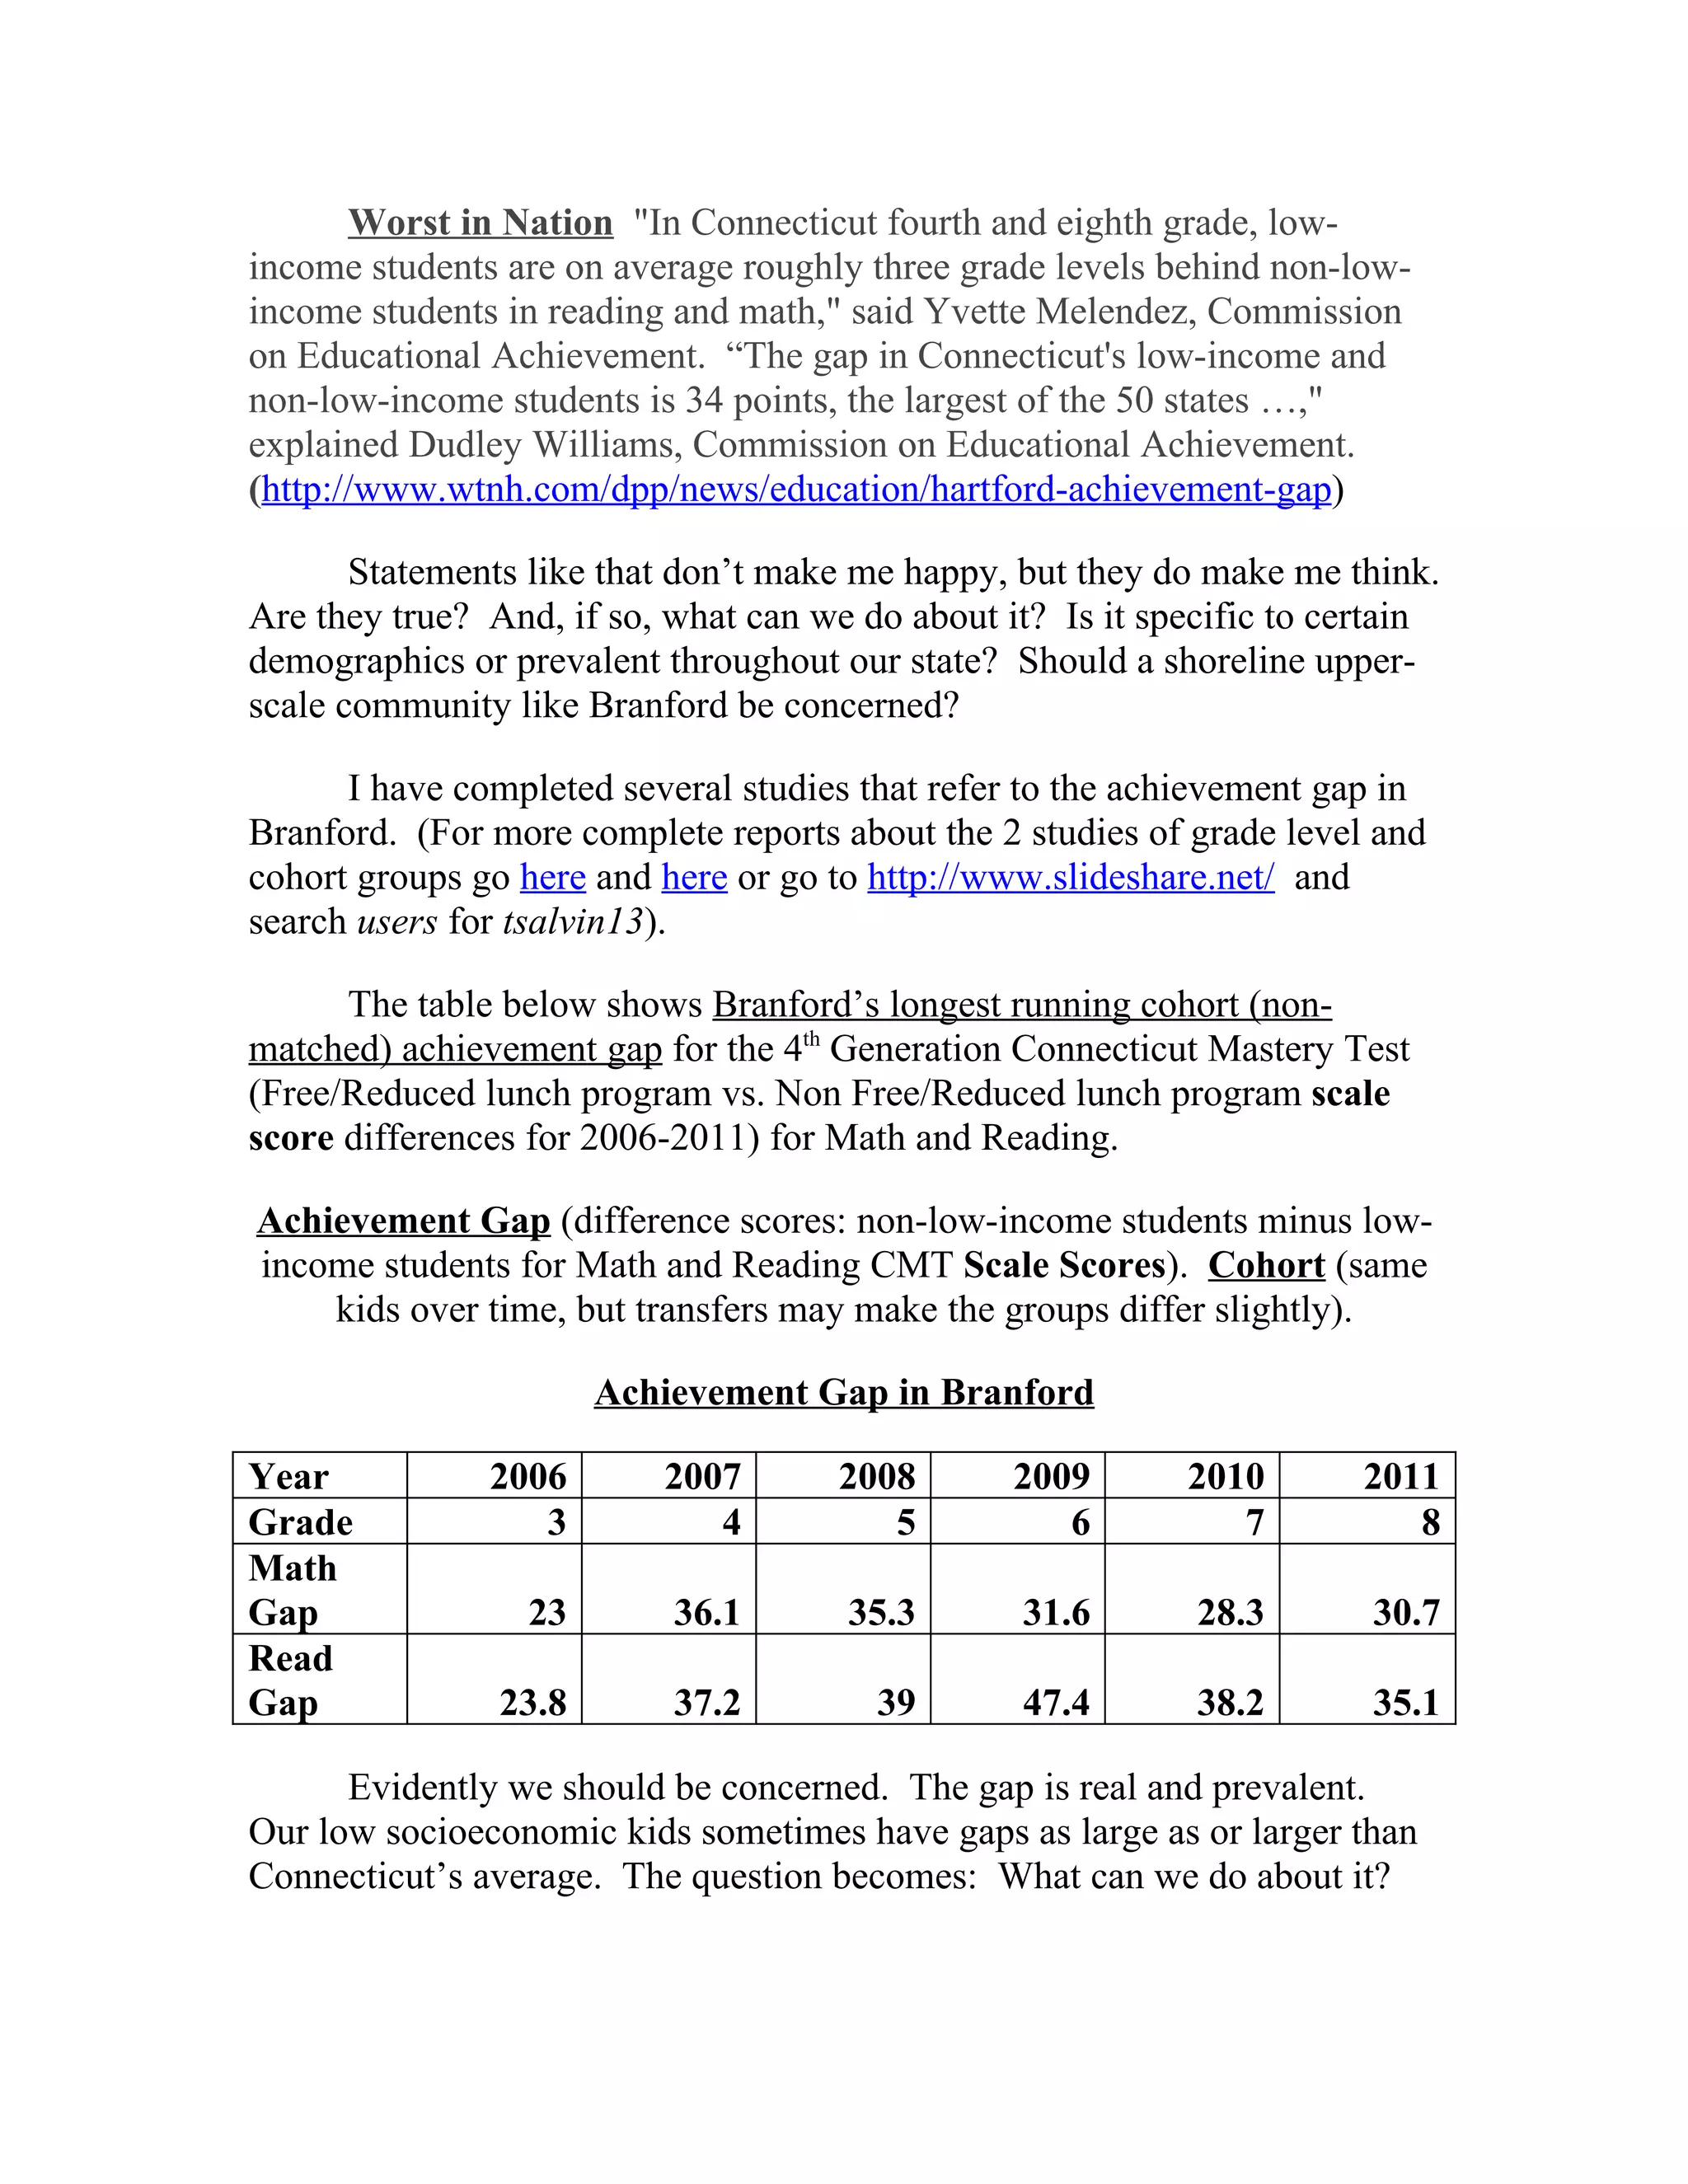
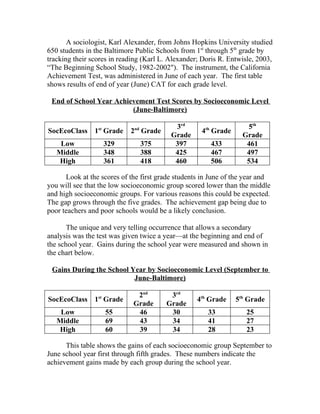
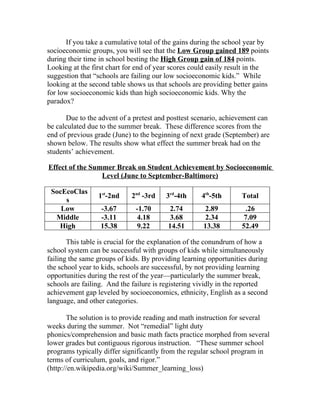
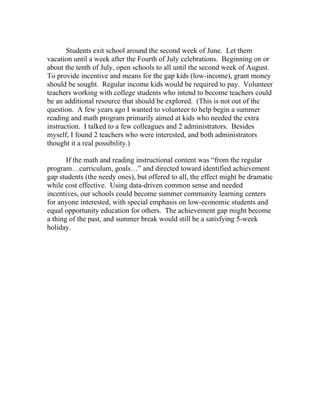

In Connecticut, low-income students in fourth and eighth grades lag significantly behind their non-low-income peers in reading and math, with an achievement gap of 34 points, the largest in the U.S. Studies indicate that while schools provide greater gains for low-income students during the school year, the lack of educational opportunities during summer contributes to persistent achievement gaps. To address this issue, it is suggested that rigorous summer programs be implemented to provide necessary instruction and support for low-income students, potentially closing the achievement gap.


