Race Breakdown 2000
•
0 likes•224 views

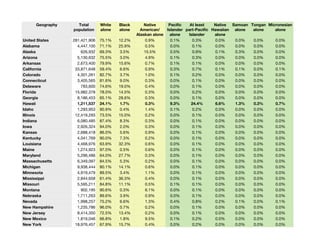
The document shows demographic data for the total population and racial groups of the United States, each state, Hawaii counties, and selected Hawaii census-designated places. It provides percentages for the white population, black population, Native American/Alaskan Native population, Pacific Islander population, and other racial groups for each geographic area.

More Related Content
Similar to Race Breakdown 2000
Similar to Race Breakdown 2000 (20)
More from Honolulu Civil Beat
More from Honolulu Civil Beat (20)
Race Breakdown 2000
- 1. Geography Total White Black Native Pacific At least Native Samoan Tongan Micronesian population alone alone American/ Islander part-Pacific Hawaiian alone alone alone Alaskan alone alone Islander alone United States 281,421,906 75.1% 12.2% 0.9% 0.1% 0.3% 0.0% 0.0% 0.0% 0.0% Alabama 4,447,100 71.1% 25.9% 0.5% 0.0% 0.1% 0.0% 0.0% 0.0% 0.0% Alaska 626,932 69.3% 3.5% 15.5% 0.5% 0.9% 0.1% 0.3% 0.0% 0.0% Arizona 5,130,632 75.5% 3.0% 4.9% 0.1% 0.3% 0.0% 0.0% 0.0% 0.0% Arkansas 2,673,400 79.9% 15.6% 0.7% 0.1% 0.1% 0.0% 0.0% 0.0% 0.0% California 33,871,648 59.4% 6.6% 0.9% 0.3% 0.7% 0.1% 0.1% 0.0% 0.1% Colorado 4,301,261 82.7% 3.7% 1.0% 0.1% 0.2% 0.0% 0.0% 0.0% 0.0% Connecticut 3,405,565 81.6% 9.0% 0.3% 0.0% 0.1% 0.0% 0.0% 0.0% 0.0% Delaware 783,600 74.6% 19.0% 0.4% 0.0% 0.1% 0.0% 0.0% 0.0% 0.0% Florida 15,982,378 78.0% 14.5% 0.3% 0.0% 0.2% 0.0% 0.0% 0.0% 0.0% Georgia 8,186,453 65.1% 28.6% 0.3% 0.0% 0.1% 0.0% 0.0% 0.0% 0.0% Hawaii 1,211,537 24.1% 1.7% 0.3% 9.3% 24.4% 6.6% 1.3% 0.3% 0.7% Idaho 1,293,953 90.9% 0.4% 1.4% 0.1% 0.2% 0.0% 0.0% 0.0% 0.0% Illinois 12,419,293 73.5% 15.0% 0.2% 0.0% 0.1% 0.0% 0.0% 0.0% 0.0% Indiana 6,080,485 87.4% 8.3% 0.3% 0.0% 0.1% 0.0% 0.0% 0.0% 0.0% Iowa 2,926,324 94.0% 2.0% 0.3% 0.0% 0.1% 0.0% 0.0% 0.0% 0.0% Kansas 2,688,418 86.0% 5.6% 0.9% 0.0% 0.1% 0.0% 0.0% 0.0% 0.0% Kentucky 4,041,769 90.0% 7.3% 0.2% 0.0% 0.1% 0.0% 0.0% 0.0% 0.0% Louisiana 4,468,976 63.9% 32.3% 0.6% 0.0% 0.1% 0.0% 0.0% 0.0% 0.0% Maine 1,274,923 97.0% 0.5% 0.6% 0.0% 0.1% 0.0% 0.0% 0.0% 0.0% Maryland 5,296,486 64.0% 27.7% 0.3% 0.0% 0.1% 0.0% 0.0% 0.0% 0.0% Massachusetts 6,349,097 84.5% 5.3% 0.2% 0.0% 0.1% 0.0% 0.0% 0.0% 0.0% Michigan 9,938,444 80.1% 14.1% 0.6% 0.0% 0.1% 0.0% 0.0% 0.0% 0.0% Minnesota 4,919,479 89.5% 3.4% 1.1% 0.0% 0.1% 0.0% 0.0% 0.0% 0.0% Mississippi 2,844,658 61.4% 36.3% 0.4% 0.0% 0.1% 0.0% 0.0% 0.0% 0.0% Missouri 5,595,211 84.8% 11.1% 0.5% 0.1% 0.1% 0.0% 0.0% 0.0% 0.0% Montana 902,195 90.6% 0.3% 6.1% 0.0% 0.1% 0.0% 0.0% 0.0% 0.0% Nebraska 1,711,263 89.6% 3.9% 0.9% 0.0% 0.1% 0.0% 0.0% 0.0% 0.0% Nevada 1,998,257 75.2% 6.6% 1.3% 0.4% 0.8% 0.2% 0.1% 0.0% 0.1% New Hampshire 1,235,786 96.0% 0.7% 0.2% 0.0% 0.1% 0.0% 0.0% 0.0% 0.0% New Jersey 8,414,350 72.5% 13.4% 0.2% 0.0% 0.1% 0.0% 0.0% 0.0% 0.0% New Mexico 1,819,046 66.8% 1.8% 9.5% 0.1% 0.2% 0.0% 0.0% 0.0% 0.0% New York 18,976,457 67.9% 15.7% 0.4% 0.0% 0.2% 0.0% 0.0% 0.0% 0.0%
- 2. Geography Total White Black Native Pacific At least Native Samoan Tongan Micronesian population alone alone American/ Islander part-Pacific Hawaiian alone alone alone Alaskan alone alone Islander alone North Carolina 8,049,313 72.1% 21.5% 1.3% 0.0% 0.1% 0.0% 0.0% 0.0% 0.0% North Dakota 642,200 92.5% 0.6% 4.9% 0.0% 0.1% 0.0% 0.0% 0.0% 0.0% Ohio 11,353,140 84.9% 11.3% 0.2% 0.0% 0.1% 0.0% 0.0% 0.0% 0.0% Oklahoma 3,450,654 76.1% 7.5% 7.7% 0.1% 0.2% 0.0% 0.0% 0.0% 0.0% Oregon 3,421,399 86.4% 1.6% 1.3% 0.2% 0.5% 0.1% 0.0% 0.0% 0.1% Pennsylvania 12,281,054 85.4% 9.9% 0.2% 0.0% 0.1% 0.0% 0.0% 0.0% 0.0% Rhode Island 1,048,319 85.0% 4.3% 0.5% 0.0% 0.2% 0.0% 0.0% 0.0% 0.0% South Carolina 4,012,012 67.2% 29.5% 0.4% 0.0% 0.1% 0.0% 0.0% 0.0% 0.0% South Dakota 754,844 88.7% 0.6% 8.2% 0.0% 0.1% 0.0% 0.0% 0.0% 0.0% Tennessee 5,689,283 80.2% 16.3% 0.3% 0.0% 0.1% 0.0% 0.0% 0.0% 0.0% Texas 20,851,820 71.0% 11.4% 0.5% 0.1% 0.1% 0.0% 0.0% 0.0% 0.0% Utah 2,233,169 89.2% 0.7% 1.3% 0.6% 1.0% 0.1% 0.2% 0.3% 0.0% Vermont 608,827 96.7% 0.5% 0.4% 0.0% 0.1% 0.0% 0.0% 0.0% 0.0% Virginia 7,078,515 72.3% 19.6% 0.3% 0.1% 0.1% 0.0% 0.0% 0.0% 0.0% Washington 5,894,121 81.7% 3.1% 1.5% 0.4% 0.7% 0.1% 0.1% 0.0% 0.1% West Virginia 1,808,344 95.0% 3.1% 0.2% 0.0% 0.1% 0.0% 0.0% 0.0% 0.0% Wisconsin 5,363,675 89.0% 5.6% 0.9% 0.0% 0.1% 0.0% 0.0% 0.0% 0.0% Wyoming 493,782 92.0% 0.6% 2.3% 0.0% 0.1% 0.0% 0.0% 0.0% 0.0% Hawaii County 148,677 31.1% 0.5% 0.4% 10.9% 32.0% 9.7% 0.3% 0.2% 0.7% Honolulu County 876,156 21.2% 2.2% 0.2% 8.8% 22.7% 5.6% 1.8% 0.3% 0.7% Kauai County 58,463 29.6% 0.3% 0.4% 9.1% 24.9% 8.4% 0.1% 0.2% 0.1% Maui County 128,094 33.9% 0.3% 0.4% 10.7% 26.5% 8.9% 0.2% 0.7% 0.6% Ahuimanu 8,336 22.4% 1.8% 0.3% 10.1% 32.5% 8.5% 0.6% 0.3% 0.3% Aiea 9,019 15.9% 1.0% 0.1% 4.5% 16.6% 4.0% 0.8% 0.0% 0.2% Ainaloa 1,948 35.6% 0.4% 1.1% 12.2% 41.5% 12.1% 0.1% 0.2% 1.0% Anahola 1,985 11.8% 0.2% 0.4% 50.9% 71.4% 45.4% 0.1% 0.2% 0.2% Barbers Point Housing 72 90.3% 0.0% 0.0% 0.0% 2.8% 2.8% 0.0% 0.0% 0.0% Captain Cook 3,273 34.2% 0.9% 0.0% 9.2% 25.5% 6.8% 0.1% 0.1% 0.7% Eden Roc 295 42.4% 0.0% 0.0% 9.8% 50.2% 10.2% 1.4% 0.0% 0.0% Eleele 2,040 9.7% 0.3% 0.2% 4.8% 21.3% 5.1% 0.0% 0.0% 0.0% Ewa Beach 14,650 10.6% 0.6% 0.0% 9.9% 30.9% 6.1% 3.2% 0.2% 0.5% Ewa Gentry 5,060 16.0% 4.1% 0.0% 5.3% 18.8% 3.7% 0.9% 0.0% 0.1% Ewa Villages 4,709 2.9% 0.0% 0.0% 3.8% 19.6% 2.6% 1.5% 0.1% 0.0%
- 3. Geography Total White Black Native Pacific At least Native Samoan Tongan Micronesian population alone alone American/ Islander part-Pacific Hawaiian alone alone alone Alaskan alone alone Islander alone Fern Acres 788 33.9% 0.0% 0.0% 18.0% 31.2% 11.5% 0.3% 0.0% 0.0% Fern Forest 458 58.1% 0.0% 3.5% 5.7% 28.2% 5.9% 0.7% 0.0% 0.2% Haiku-Pauwela 6,600 56.8% 0.4% 0.5% 9.7% 23.6% 6.5% 0.1% 0.0% 0.2% Halaula 507 14.0% 0.0% 0.0% 9.5% 36.5% 10.1% 0.0% 0.2% 0.0% Halawa 13,955 15.3% 1.7% 0.1% 10.8% 25.0% 4.5% 4.3% 0.1% 0.9% Haleiwa 2,226 23.7% 0.4% 0.0% 10.4% 35.7% 9.1% 0.3% 0.3% 0.2% Haliimaile 886 10.2% 0.0% 0.0% 18.1% 35.3% 4.6% 0.0% 2.1% 9.6% Hana 667 16.8% 0.0% 0.0% 41.1% 82.2% 41.2% 0.0% 0.6% 0.0% Hanalei 483 52.0% 0.0% 0.0% 4.6% 17.8% 2.9% 0.0% 0.0% 0.0% Hanamaulu 3,272 8.3% 0.0% 0.0% 5.2% 21.3% 5.1% 0.1% 0.2% 0.2% Hanapepe 2,144 16.8% 0.0% 0.2% 8.5% 25.6% 8.3% 0.0% 0.0% 0.0% Hauula 3,675 16.9% 0.3% 0.0% 40.2% 77.9% 20.1% 5.7% 6.4% 1.1% Hawaiian Acres 1,736 54.0% 0.0% 0.5% 6.9% 26.2% 7.4% 0.2% 0.1% 0.1% Hawaiian Beaches 3,794 29.8% 0.2% 0.3% 13.5% 44.6% 12.3% 1.3% 0.0% 1.2% Hawaiian Ocean View 2,214 54.2% 0.2% 2.1% 10.4% 25.9% 8.2% 0.0% 0.6% 1.5% Hawaiian Paradise Park 7,086 33.0% 0.3% 0.3% 10.6% 32.8% 8.9% 0.5% 0.3% 0.2% Hawi 957 18.3% 0.0% 0.9% 9.3% 41.8% 10.8% 0.1% 0.1% 0.0% Heeia 4,915 27.7% 0.6% 0.1% 8.1% 25.0% 7.3% 0.2% 0.4% 0.1% Hickam Housing 5,518 66.6% 11.3% 0.6% 0.5% 2.2% 0.3% 0.3% 0.0% 0.3% Hilo 40,798 16.7% 0.8% 0.4% 12.2% 35.3% 11.3% 0.2% 0.2% 1.0% Holualoa 6,108 54.8% 0.9% 0.2% 7.3% 19.1% 6.2% 0.2% 0.7% 0.2% Honalo 2,072 34.5% 1.5% 0.9% 10.2% 30.5% 7.6% 0.0% 0.0% 1.3% Honaunau-Napoopoo 2,347 35.0% 0.1% 0.9% 14.8% 39.9% 13.2% 0.0% 0.2% 0.9% Honokaa 2,240 26.7% 0.1% 0.2% 4.2% 22.6% 3.6% 0.0% 0.0% 0.0% Honolulu 371,619 19.5% 1.5% 0.2% 7.0% 16.3% 3.6% 1.5% 0.3% 1.1% Honomu 525 25.7% 0.0% 0.0% 5.7% 25.9% 4.4% 0.0% 0.0% 1.0% Iroquois Point 2,571 75.8% 4.7% 0.0% 1.6% 2.6% 0.5% 0.0% 0.0% 0.3% Kaaawa 1,324 38.0% 0.8% 0.5% 23.5% 47.7% 18.1% 2.9% 0.4% 0.1% Kaanapali 1,376 80.8% 0.1% 0.1% 2.8% 4.2% 1.2% 0.1% 0.7% 0.0% Kahaluu 2,917 27.4% 0.4% 0.0% 19.9% 43.9% 16.0% 0.3% 1.0% 0.1% Kahaluu-Keauhou 2,392 66.0% 0.7% 0.0% 5.3% 17.0% 6.7% 0.1% 0.4% 0.5% Kahuku 2,097 9.7% 0.1% 0.0% 30.1% 59.3% 10.2% 5.6% 8.9% 0.2% Kahului 20,020 10.5% 0.3% 0.1% 9.2% 27.7% 6.8% 0.3% 0.9% 1.6%
- 4. Geography Total White Black Native Pacific At least Native Samoan Tongan Micronesian population alone alone American/ Islander part-Pacific Hawaiian alone alone alone Alaskan alone alone Islander alone Kailua (Hawaii County) 9,818 36.8% 0.6% 0.7% 12.5% 34.3% 10.8% 0.4% 0.6% 0.9% Kailua (Honolulu County) 36,585 43.8% 0.7% 0.4% 7.5% 25.5% 7.0% 0.4% 0.3% 0.2% Kalaheo 3,965 41.2% 0.2% 0.1% 3.8% 17.8% 3.3% 0.3% 0.0% 0.1% Kalaoa 6,893 50.3% 0.0% 0.4% 10.9% 28.5% 8.5% 0.3% 0.4% 0.5% Kalihiwai 716 67.2% 0.0% 0.0% 2.4% 11.0% 3.9% 0.0% 0.0% 0.0% Kaneohe 34,976 20.3% 1.0% 0.0% 11.6% 32.3% 9.8% 0.8% 0.2% 0.3% Kaneohe Station 11,827 66.9% 12.1% 1.5% 0.4% 2.7% 0.5% 0.1% 0.0% 0.5% Kapaa 9,686 27.3% 0.1% 0.7% 9.4% 29.5% 8.6% 0.2% 0.6% 0.1% Kapaau 1,169 23.4% 0.0% 0.0% 10.4% 34.8% 8.6% 0.0% 0.4% 0.0% Kapalua 401 69.3% 0.0% 0.0% 1.5% 28.9% 12.5% 0.0% 0.0% 3.0% Kaumakani 607 3.8% 0.0% 0.3% 3.5% 13.3% 2.3% 0.0% 0.2% 0.0% Kaunakakai 2,745 8.6% 0.0% 0.2% 28.7% 58.3% 29.3% 0.1% 0.1% 0.0% Kawela Bay 429 79.5% 0.9% 0.0% 2.6% 8.6% 1.4% 0.7% 0.0% 0.0% Keaau 2,005 11.9% 0.0% 0.0% 5.0% 20.5% 4.0% 0.0% 0.0% 0.2% Kealakekua 1,595 24.7% 0.4% 0.2% 6.0% 30.0% 6.6% 0.0% 0.0% 0.8% Kekaha 3,173 15.1% 0.0% 0.5% 12.2% 32.8% 11.5% 0.3% 0.0% 0.3% Kihei 16,832 47.3% 0.7% 0.3% 6.8% 18.5% 5.5% 0.3% 1.2% 0.3% Kilauea 2,137 47.8% 0.3% 0.9% 7.0% 15.1% 5.6% 0.0% 0.0% 0.2% Koloa 1,942 19.4% 0.3% 0.0% 7.6% 24.0% 7.3% 0.0% 0.0% 0.0% Kualapuu 1,946 7.6% 0.1% 0.2% 46.1% 71.1% 42.1% 0.3% 0.0% 0.2% Kukuihaele 329 27.1% 0.0% 0.0% 14.6% 42.2% 15.8% 0.0% 0.0% 0.0% Kurtistown 1,142 15.9% 0.0% 0.7% 5.5% 27.1% 6.5% 0.3% 0.0% 0.0% Lahaina 9,047 26.0% 0.0% 0.6% 10.6% 22.6% 7.3% 0.2% 2.0% 0.1% Laie 4,597 26.7% 0.3% 0.2% 35.0% 69.0% 7.7% 16.2% 5.5% 0.5% Lanai City 3,193 13.8% 0.0% 0.0% 6.9% 20.7% 6.4% 0.0% 0.0% 0.3% Laupahoehoe 461 29.9% 0.0% 0.9% 3.3% 28.2% 5.6% 0.0% 0.0% 0.4% Lawai 1,993 39.0% 0.2% 0.2% 4.4% 22.0% 5.2% 0.2% 0.0% 0.1% Leilani Estates 929 60.2% 0.0% 1.8% 11.4% 22.4% 9.6% 0.2% 0.1% 0.4% Lihue 5,838 21.5% 0.0% 0.8% 6.0% 18.8% 5.5% 0.1% 0.2% 0.1% Maalaea 454 82.8% 1.1% 0.0% 2.2% 4.0% 1.1% 0.0% 0.2% 0.0% Maili 6,064 11.4% 1.2% 0.0% 28.4% 57.7% 17.4% 4.3% 0.2% 0.3% Makaha 7,719 17.2% 0.4% 0.0% 20.0% 56.5% 17.6% 3.0% 0.1% 0.2% Makaha Valley 1,290 14.4% 1.4% 0.5% 22.6% 62.5% 18.0% 2.6% 0.2% 0.1%
- 5. Geography Total White Black Native Pacific At least Native Samoan Tongan Micronesian population alone alone American/ Islander part-Pacific Hawaiian alone alone alone Alaskan alone alone Islander alone Makakilo City 13,158 24.6% 1.9% 0.1% 10.3% 30.0% 7.6% 1.9% 0.0% 0.4% Makawao 6,355 40.8% 0.4% 0.1% 8.6% 30.4% 8.2% 0.1% 0.2% 0.0% Maunaloa 220 11.8% 0.9% 0.0% 24.1% 69.1% 34.5% 0.5% 0.0% 0.5% Maunawili 4,824 34.7% 0.6% 0.1% 7.6% 26.2% 8.0% 0.5% 0.0% 0.1% Mililani Town 28,565 20.0% 3.2% 0.1% 4.1% 18.7% 3.3% 0.7% 0.0% 0.3% Mokuleia 1,840 57.7% 0.9% 0.4% 5.4% 20.9% 4.5% 0.4% 0.0% 0.2% Mountain View 3,050 25.5% 1.0% 0.0% 12.2% 38.1% 10.1% 0.5% 0.1% 0.1% Naalehu 991 4.4% 1.4% 0.0% 12.1% 37.6% 12.8% 0.0% 0.0% 0.0% Nanakuli 10,698 6.0% 0.8% 0.3% 38.4% 81.2% 31.5% 6.5% 0.5% 0.2% Nanawale Estates 999 22.8% 0.0% 0.0% 21.2% 45.2% 14.0% 2.1% 0.0% 1.0% Napili-Honokowai 6,782 54.1% 0.9% 2.2% 8.7% 16.5% 4.5% 0.2% 3.0% 0.0% Omao 1,224 39.1% 0.0% 1.3% 6.2% 20.9% 5.3% 0.0% 0.0% 0.0% Orchidlands Estates 1,746 33.4% 0.4% 2.3% 12.9% 31.1% 5.4% 1.2% 0.5% 1.9% Paauilo 581 19.1% 0.0% 0.2% 2.1% 30.5% 5.2% 0.0% 0.2% 0.2% Pahala 1,419 8.6% 0.0% 0.0% 6.1% 34.5% 10.0% 0.0% 0.0% 0.0% Pahoa 954 8.4% 0.0% 0.9% 12.3% 31.7% 13.5% 0.2% 0.0% 0.1% Paia 2,501 33.3% 0.8% 0.6% 9.4% 28.7% 8.0% 0.1% 0.0% 0.2% Pakala Village 480 11.7% 0.0% 0.0% 33.1% 43.8% 25.8% 0.2% 0.0% 0.2% Papaikou 1,431 13.3% 0.0% 0.0% 9.6% 25.8% 8.0% 0.0% 0.0% 1.1% Paukaa 467 30.4% 0.4% 0.0% 5.6% 16.9% 4.7% 0.2% 0.0% 0.6% Pearl City 30,818 17.0% 2.8% 0.2% 5.8% 18.7% 4.0% 1.3% 0.1% 0.4% Pepeekeo 1,749 12.7% 0.1% 1.7% 3.3% 20.4% 3.5% 0.3% 0.0% 0.9% Poipu 1,091 65.9% 0.0% 0.5% 1.7% 7.8% 1.5% 0.2% 0.0% 0.2% Princeville 1,697 84.4% 0.9% 0.0% 1.2% 7.6% 2.7% 0.0% 0.1% 0.2% Puako 426 70.7% 0.0% 0.0% 4.0% 11.7% 4.5% 0.0% 0.0% 0.0% Puhi 1,186 7.7% 0.0% 0.2% 6.9% 14.3% 2.4% 0.1% 0.0% 0.1% Pukalani 7,473 35.7% 0.0% 0.1% 6.6% 26.6% 6.8% 0.2% 0.1% 0.1% Punaluu 846 40.1% 1.5% 0.0% 24.7% 56.6% 18.8% 3.3% 0.2% 0.2% Pupukea 4,226 56.9% 0.0% 1.6% 6.6% 18.7% 5.0% 0.8% 0.1% 0.0% Schofield Barracks 14,434 56.2% 21.1% 0.5% 0.8% 3.1% 0.5% 0.5% 0.0% 0.5% Village Park 9,780 9.3% 2.5% 0.0% 6.2% 20.6% 3.7% 2.8% 0.3% 0.3% Volcano 2,230 45.3% 0.0% 0.2% 14.6% 31.7% 11.7% 0.2% 0.0% 0.1% Wahiawa 16,151 11.8% 2.2% 0.2% 10.7% 30.7% 5.6% 2.3% 0.1% 1.0%
- 6. Geography Total White Black Native Pacific At least Native Samoan Tongan Micronesian population alone alone American/ Islander part-Pacific Hawaiian alone alone alone Alaskan alone alone Islander alone Waialua 3,761 15.0% 0.3% 0.2% 4.8% 23.4% 3.4% 0.4% 0.0% 0.1% Waianae 10,649 10.3% 0.7% 0.8% 26.2% 64.2% 22.7% 2.6% 0.3% 0.3% Waihee-Waiehu 7,253 12.8% 0.1% 0.1% 14.8% 34.4% 13.9% 0.0% 0.2% 0.4% Waikane 719 14.6% 0.0% 0.0% 22.5% 60.6% 18.9% 0.3% 0.1% 0.4% Waikapu 1,104 15.1% 0.0% 0.0% 9.6% 28.1% 7.2% 0.0% 0.7% 1.4% Waikoloa Village 4,823 43.6% 0.3% 0.4% 10.0% 28.8% 6.7% 0.6% 0.0% 1.4% Wailea-Makena 5,540 75.7% 0.3% 0.4% 3.2% 6.9% 1.4% 0.1% 0.2% 0.2% Wailua 2,044 27.9% 2.9% 0.0% 9.7% 24.8% 8.3% 0.0% 0.2% 0.0% Wailua Homesteads 4,334 45.3% 0.2% 0.1% 6.7% 24.7% 7.4% 0.0% 0.3% 0.2% Wailuku 12,419 17.7% 0.2% 0.4% 11.1% 30.7% 10.1% 0.1% 0.4% 0.7% Waimalu 29,504 17.2% 1.4% 0.4% 5.3% 16.6% 3.4% 1.2% 0.0% 0.8% Waimanalo 3,687 9.7% 0.0% 0.5% 23.7% 56.7% 21.7% 1.3% 0.5% 0.4% Waimanalo Beach 4,239 11.6% 0.0% 0.0% 50.6% 80.0% 45.9% 0.6% 0.0% 0.0% Waimea (Hawaii County) 7,014 30.7% 0.2% 0.0% 13.8% 40.9% 15.0% 0.1% 0.1% 0.1% Waimea (Kauai County) 1,792 12.5% 0.0% 0.8% 10.3% 35.7% 11.6% 0.2% 0.0% 0.3% Wainaku 1,227 25.6% 0.0% 0.0% 6.2% 22.4% 5.3% 0.2% 0.5% 0.3% Waipahu 33,109 4.7% 0.8% 0.0% 12.2% 23.8% 3.2% 6.6% 0.6% 1.2% Waipio 11,641 13.6% 2.4% 0.3% 5.4% 19.0% 3.7% 0.8% 0.2% 0.4% Waipio Acres 5,341 16.9% 4.0% 0.2% 6.5% 26.5% 5.3% 1.1% 0.0% 1.4% Wheeler AFB 2,829 58.2% 19.2% 1.1% 4.0% 3.6% 0.6% 0.6% 0.0% 0.5% Whitmore Village 4,061 4.6% 2.0% 0.2% 7.4% 21.9% 3.8% 2.0% 0.1% 0.3%
- 7. Geography Asian At least Chinese Filipino Indonesian Japanese Korean Laotian-Thai- alone part- Vietnamese- Asian Cambodian United States 3.6% 4.4% 0.8% 0.7% 0.0% 0.3% 0.4% 0.6% Alabama 0.7% 0.9% 0.1% 0.1% 0.0% 0.0% 0.1% 0.2% Alaska 4.1% 5.4% 0.2% 2.0% 0.0% 0.2% 0.7% 0.5% Arizona 1.8% 2.4% 0.4% 0.3% 0.0% 0.2% 0.2% 0.3% Arkansas 0.7% 1.0% 0.1% 0.1% 0.0% 0.0% 0.1% 0.3% California 10.9% 12.6% 2.7% 2.7% 0.1% 0.9% 1.0% 1.8% Colorado 2.2% 2.9% 0.3% 0.2% 0.0% 0.3% 0.4% 0.5% Connecticut 2.4% 2.9% 0.5% 0.2% 0.0% 0.1% 0.2% 0.4% Delaware 2.0% 2.4% 0.5% 0.3% 0.0% 0.1% 0.3% 0.1% Florida 1.7% 2.1% 0.3% 0.3% 0.0% 0.1% 0.1% 0.3% Georgia 2.1% 2.5% 0.3% 0.1% 0.0% 0.1% 0.4% 0.5% Hawaii 41.6% 67.2% 4.6% 14.1% 0.0% 16.7% 1.9% 0.9% Idaho 0.9% 1.4% 0.2% 0.1% 0.0% 0.2% 0.1% 0.2% Illinois 3.4% 3.9% 0.6% 0.7% 0.0% 0.2% 0.4% 0.3% Indiana 0.9% 1.2% 0.2% 0.1% 0.0% 0.1% 0.1% 0.1% Iowa 1.2% 1.5% 0.2% 0.1% 0.0% 0.1% 0.2% 0.4% Kansas 1.7% 2.1% 0.3% 0.1% 0.0% 0.1% 0.2% 0.6% Kentucky 0.7% 0.9% 0.1% 0.1% 0.0% 0.1% 0.1% 0.1% Louisiana 1.2% 1.5% 0.2% 0.1% 0.0% 0.0% 0.1% 0.6% Maine 0.6% 1.0% 0.2% 0.1% 0.0% 0.0% 0.1% 0.2% Maryland 4.0% 4.6% 0.9% 0.5% 0.0% 0.1% 0.7% 0.4% Massachusetts 3.8% 4.3% 1.3% 0.1% 0.0% 0.2% 0.3% 0.9% Michigan 1.8% 2.1% 0.3% 0.2% 0.0% 0.1% 0.2% 0.2% Minnesota 2.8% 3.4% 0.3% 0.1% 0.0% 0.1% 0.3% 0.7% Mississippi 0.6% 0.8% 0.1% 0.1% 0.0% 0.0% 0.0% 0.2% Missouri 1.1% 1.4% 0.2% 0.1% 0.0% 0.1% 0.1% 0.2% Montana 0.5% 0.8% 0.1% 0.1% 0.0% 0.1% 0.1% 0.0% Nebraska 1.2% 1.6% 0.2% 0.1% 0.0% 0.1% 0.1% 0.5% Nevada 4.5% 5.9% 0.7% 2.0% 0.0% 0.4% 0.4% 0.5% New Hampshire 1.2% 1.6% 0.3% 0.1% 0.0% 0.1% 0.1% 0.2% New Jersey 5.7% 6.3% 1.1% 1.0% 0.0% 0.2% 0.8% 0.2% New Mexico 1.0% 1.5% 0.2% 0.2% 0.0% 0.1% 0.1% 0.2% New York 5.5% 6.3% 2.2% 0.4% 0.0% 0.2% 0.6% 0.2%
- 8. Geography Asian At least Chinese Filipino Indonesian Japanese Korean Laotian-Thai- alone part- Vietnamese- Asian Cambodian North Carolina 1.4% 1.7% 0.2% 0.1% 0.0% 0.1% 0.2% 0.3% North Dakota 0.5% 0.8% 0.1% 0.1% 0.0% 0.0% 0.1% 0.1% Ohio 1.2% 1.4% 0.3% 0.1% 0.0% 0.1% 0.1% 0.2% Oklahoma 1.3% 1.7% 0.2% 0.1% 0.0% 0.1% 0.1% 0.4% Oregon 2.9% 3.9% 0.6% 0.3% 0.0% 0.4% 0.4% 0.8% Pennsylvania 1.8% 2.1% 0.4% 0.1% 0.0% 0.1% 0.3% 0.3% Rhode Island 2.3% 2.8% 0.5% 0.2% 0.0% 0.1% 0.1% 0.8% South Carolina 0.9% 1.1% 0.1% 0.2% 0.0% 0.1% 0.1% 0.2% South Dakota 0.6% 0.8% 0.1% 0.1% 0.0% 0.0% 0.1% 0.1% Tennessee 1.0% 1.2% 0.2% 0.1% 0.0% 0.1% 0.1% 0.2% Texas 2.7% 3.2% 0.5% 0.3% 0.0% 0.1% 0.2% 0.8% Utah 1.7% 2.3% 0.3% 0.1% 0.0% 0.3% 0.2% 0.5% Vermont 0.8% 1.1% 0.2% 0.1% 0.0% 0.1% 0.1% 0.2% Virginia 3.6% 4.4% 0.5% 0.7% 0.0% 0.1% 0.6% 0.7% Washington 5.4% 6.9% 0.9% 1.1% 0.0% 0.6% 0.8% 1.2% West Virginia 0.5% 0.7% 0.1% 0.1% 0.0% 0.0% 0.0% 0.0% Wisconsin 1.5% 2.0% 0.2% 0.1% 0.0% 0.1% 0.1% 0.2% Wyoming 0.6% 0.8% 0.1% 0.1% 0.0% 0.1% 0.1% 0.0% Hawaii County 26.7% 57.9% 1.1% 9.1% 0.0% 13.6% 0.6% 0.2% Honolulu County 46.2% 70.7% 6.0% 14.2% 0.0% 18.4% 2.5% 1.2% Kauai County 35.8% 64.4% 0.8% 19.1% 0.0% 12.8% 0.3% 0.1% Maui County 30.3% 55.5% 0.9% 17.0% 0.0% 10.1% 0.6% 0.4% Ahuimanu 35.8% 73.7% 4.9% 4.3% 0.0% 20.8% 0.9% 0.3% Aiea 57.4% 84.7% 4.2% 15.3% 0.0% 31.9% 1.8% 0.4% Ainaloa 16.2% 49.7% 1.1% 8.5% 0.0% 3.6% 0.1% 0.3% Anahola 9.0% 31.8% 0.7% 2.7% 0.0% 2.8% 0.0% 0.1% Barbers Point Housing 9.7% 8.3% 0.0% 0.0% 0.0% 1.4% 4.2% 0.0% Captain Cook 30.5% 60.1% 1.1% 7.8% 0.0% 19.8% 0.3% 0.1% Eden Roc 16.6% 52.9% 0.3% 2.0% 0.0% 3.1% 0.0% 0.0% Eleele 61.7% 93.0% 0.2% 40.1% 0.0% 16.5% 0.1% 0.1% Ewa Beach 49.2% 81.0% 1.5% 39.1% 0.0% 5.2% 0.2% 0.5% Ewa Gentry 51.8% 83.9% 2.3% 27.1% 0.0% 14.1% 1.1% 0.7% Ewa Villages 73.3% 102.0% 1.4% 58.3% 0.0% 6.1% 1.0% 0.2%
- 9. Geography Asian At least Chinese Filipino Indonesian Japanese Korean Laotian-Thai- alone part- Vietnamese- Asian Cambodian Fern Acres 21.4% 35.4% 1.4% 2.8% 0.0% 3.2% 0.4% 0.3% Fern Forest 5.2% 29.0% 1.3% 0.7% 0.0% 4.6% 0.4% 0.0% Haiku-Pauwela 9.6% 33.8% 0.9% 3.0% 0.0% 4.9% 0.2% 0.1% Halaula 37.5% 82.6% 0.4% 25.0% 0.0% 4.1% 0.2% 0.0% Halawa 51.8% 76.7% 4.9% 18.3% 0.0% 20.1% 1.6% 1.8% Haleiwa 25.1% 70.6% 0.8% 12.7% 0.0% 9.7% 0.2% 3.5% Haliimaile 46.0% 66.3% 0.5% 30.1% 0.0% 9.8% 0.1% 0.0% Hana 6.4% 46.2% 0.7% 3.6% 0.0% 1.6% 0.0% 0.3% Hanalei 16.8% 38.5% 2.5% 2.1% 0.0% 11.2% 0.0% 0.2% Hanamaulu 63.3% 92.4% 0.6% 50.4% 0.0% 7.2% 0.1% 0.0% Hanapepe 44.7% 83.8% 0.8% 25.9% 0.0% 17.4% 0.1% 0.3% Hauula 8.6% 36.4% 1.0% 1.2% 0.0% 2.3% 0.1% 0.2% Hawaiian Acres 10.9% 32.9% 1.0% 2.4% 0.0% 3.5% 1.3% 0.3% Hawaiian Beaches 18.2% 55.7% 1.0% 8.7% 0.0% 4.0% 0.2% 0.1% Hawaiian Ocean View 4.3% 22.4% 0.6% 3.4% 0.0% 1.7% 0.1% 0.0% Hawaiian Paradise Park 19.6% 57.0% 0.6% 13.3% 0.1% 5.1% 0.6% 0.3% Hawi 28.0% 77.5% 1.3% 13.9% 0.0% 8.6% 0.0% 0.1% Heeia 40.9% 72.2% 5.3% 3.0% 0.0% 24.8% 1.7% 0.6% Hickam Housing 7.4% 14.1% 0.2% 3.6% 0.0% 1.2% 1.4% 0.8% Hilo 37.6% 74.4% 1.5% 5.8% 0.0% 26.6% 1.0% 0.2% Holualoa 15.7% 32.8% 1.1% 6.4% 0.0% 7.8% 0.3% 0.4% Honalo 19.6% 51.3% 0.5% 4.0% 0.0% 13.0% 0.2% 0.3% Honaunau-Napoopoo 17.0% 48.3% 1.1% 6.2% 0.0% 9.4% 0.1% 0.1% Honokaa 43.9% 74.7% 0.4% 27.0% 0.0% 12.8% 0.0% 0.0% Honolulu 56.0% 75.2% 10.5% 11.6% 0.0% 23.3% 4.2% 2.1% Honomu 36.0% 73.1% 1.5% 8.6% 0.0% 18.7% 0.0% 0.2% Iroquois Point 6.8% 7.6% 0.2% 2.5% 0.0% 0.7% 0.4% 0.2% Kaaawa 9.3% 29.9% 1.4% 1.4% 0.1% 4.4% 0.5% 0.0% Kaanapali 7.5% 11.5% 1.3% 1.5% 0.1% 3.0% 0.5% 0.2% Kahaluu 17.1% 57.1% 3.7% 3.8% 0.0% 10.5% 0.9% 0.8% Kahaluu-Keauhou 14.5% 22.5% 0.6% 2.4% 0.1% 6.6% 0.5% 0.1% Kahuku 29.3% 62.4% 1.0% 17.5% 0.0% 4.9% 0.5% 1.1% Kahului 53.9% 83.6% 0.9% 31.9% 0.0% 17.6% 0.6% 0.3%
- 10. Geography Asian At least Chinese Filipino Indonesian Japanese Korean Laotian-Thai- alone part- Vietnamese- Asian Cambodian Kailua (Hawaii County) 17.3% 47.3% 1.1% 9.0% 0.0% 5.7% 0.7% 0.2% Kailua (Honolulu County) 21.5% 46.7% 2.8% 2.7% 0.0% 12.0% 0.9% 0.3% Kalaheo 31.3% 56.5% 0.4% 11.6% 0.0% 14.5% 0.3% 0.0% Kalaoa 14.0% 40.4% 0.8% 4.0% 0.0% 6.3% 0.3% 0.2% Kalihiwai 15.6% 19.7% 1.4% 6.8% 0.0% 1.1% 0.3% 0.1% Kaneohe 39.5% 73.8% 4.6% 4.6% 0.0% 23.6% 1.0% 0.3% Kaneohe Station 5.3% 8.9% 0.2% 2.9% 0.0% 0.8% 0.3% 0.7% Kapaa 31.2% 63.6% 1.1% 16.3% 0.0% 10.0% 0.4% 0.2% Kapaau 27.9% 80.5% 1.0% 10.2% 0.0% 12.1% 0.2% 0.2% Kapalua 9.5% 29.9% 0.2% 6.7% 0.0% 4.7% 0.0% 0.0% Kaumakani 76.1% 99.5% 0.3% 65.6% 0.0% 8.6% 0.0% 0.0% Kaunakakai 30.4% 62.9% 0.7% 20.5% 0.0% 6.3% 0.0% 0.0% Kawela Bay 5.6% 14.5% 0.0% 3.0% 0.0% 2.3% 0.2% 2.1% Keaau 55.7% 91.3% 1.2% 35.0% 0.0% 17.0% 0.6% 0.7% Kealakekua 37.6% 71.2% 0.9% 9.4% 0.1% 24.8% 0.2% 0.4% Kekaha 43.5% 76.5% 0.3% 31.5% 0.0% 8.4% 0.2% 0.0% Kihei 24.6% 42.6% 0.7% 17.4% 0.1% 3.7% 0.5% 0.5% Kilauea 26.8% 44.8% 0.7% 18.0% 0.0% 5.1% 0.1% 0.2% Koloa 46.8% 71.7% 0.4% 28.5% 0.0% 12.3% 0.3% 0.0% Kualapuu 17.4% 48.9% 0.7% 10.7% 0.0% 4.2% 0.0% 0.0% Kukuihaele 17.3% 66.3% 0.0% 9.7% 0.0% 14.0% 0.3% 0.0% Kurtistown 43.7% 77.8% 1.3% 12.1% 0.0% 22.3% 1.4% 0.2% Lahaina 44.1% 62.9% 1.0% 31.0% 0.0% 8.7% 0.4% 1.0% Laie 9.6% 25.9% 3.6% 1.0% 0.1% 2.2% 1.0% 0.3% Lanai City 52.6% 87.8% 0.4% 45.1% 0.0% 7.6% 0.3% 0.1% Laupahoehoe 21.0% 62.7% 0.9% 7.4% 0.0% 16.5% 0.0% 0.2% Lawai 27.8% 63.8% 0.9% 8.4% 0.1% 17.3% 0.2% 0.2% Leilani Estates 4.7% 25.8% 0.2% 4.8% 0.0% 1.6% 0.4% 0.0% Lihue 49.0% 75.6% 1.6% 14.4% 0.0% 27.4% 0.5% 0.1% Maalaea 7.5% 10.8% 0.2% 0.9% 0.0% 4.6% 0.9% 0.0% Maili 25.8% 60.8% 1.1% 15.8% 0.0% 2.7% 0.3% 0.4% Makaha 16.0% 56.1% 0.9% 8.8% 0.0% 2.9% 0.4% 0.2% Makaha Valley 9.1% 55.5% 0.1% 3.7% 0.0% 2.2% 0.2% 0.1%
- 11. Geography Asian At least Chinese Filipino Indonesian Japanese Korean Laotian-Thai- alone part- Vietnamese- Asian Cambodian Makakilo City 33.6% 68.4% 1.9% 16.9% 0.1% 7.7% 1.3% 0.5% Makawao 14.2% 51.1% 0.6% 6.9% 0.0% 6.8% 0.3% 0.1% Maunaloa 21.4% 49.1% 0.5% 14.1% 0.0% 1.4% 0.5% 0.0% Maunawili 30.0% 55.5% 5.5% 2.8% 0.0% 16.7% 0.6% 0.1% Mililani Town 46.2% 81.0% 3.2% 10.4% 0.0% 24.9% 2.2% 0.5% Mokuleia 11.2% 31.8% 0.4% 5.7% 0.1% 3.0% 0.3% 0.2% Mountain View 22.0% 54.9% 1.2% 4.8% 0.0% 11.5% 0.8% 0.1% Naalehu 45.2% 69.7% 0.2% 31.4% 0.0% 8.7% 0.0% 0.0% Nanakuli 9.9% 49.5% 1.2% 7.9% 0.0% 1.5% 0.0% 0.2% Nanawale Estates 24.3% 59.1% 0.2% 13.6% 0.2% 1.9% 0.0% 0.1% Napili-Honokowai 19.8% 31.8% 0.8% 11.8% 0.0% 3.8% 0.8% 0.8% Omao 28.8% 52.7% 0.5% 16.7% 0.0% 9.1% 0.2% 0.1% Orchidlands Estates 22.5% 50.1% 0.3% 14.5% 0.0% 2.8% 0.3% 0.1% Paauilo 39.8% 83.1% 0.0% 27.5% 0.0% 9.1% 0.7% 0.0% Pahala 48.2% 86.8% 0.6% 31.3% 0.0% 11.0% 0.1% 0.1% Pahoa 52.8% 73.9% 0.2% 29.8% 0.0% 21.0% 0.0% 0.0% Paia 27.0% 58.5% 1.0% 17.0% 0.1% 6.8% 0.5% 0.0% Pakala Village 15.4% 63.8% 1.7% 23.8% 0.0% 9.2% 0.0% 0.0% Papaikou 50.3% 70.9% 0.2% 22.2% 0.0% 20.8% 0.1% 0.1% Paukaa 41.1% 65.5% 1.1% 12.6% 0.2% 24.4% 1.3% 0.0% Pearl City 54.8% 80.2% 3.9% 12.2% 0.0% 31.2% 1.3% 0.5% Pepeekeo 52.5% 83.4% 2.3% 26.2% 0.0% 19.8% 0.3% 0.4% Poipu 20.1% 29.6% 1.1% 3.6% 0.0% 9.2% 0.2% 0.2% Princeville 3.9% 11.9% 1.0% 1.0% 0.0% 2.1% 0.0% 0.1% Puako 14.6% 23.2% 1.6% 1.4% 0.0% 7.0% 0.2% 0.5% Puhi 56.7% 91.7% 0.6% 52.3% 0.0% 8.8% 0.3% 0.0% Pukalani 21.4% 59.8% 1.0% 8.4% 0.1% 14.5% 0.7% 0.2% Punaluu 10.3% 39.4% 2.6% 1.9% 0.0% 5.4% 0.5% 0.1% Pupukea 11.6% 35.5% 1.2% 6.6% 0.0% 4.4% 0.4% 0.3% Schofield Barracks 3.6% 6.9% 0.3% 1.6% 0.0% 0.2% 1.0% 0.3% Village Park 58.7% 86.4% 2.1% 36.2% 0.0% 12.0% 0.9% 1.1% Volcano 11.1% 32.7% 1.5% 2.1% 0.0% 6.1% 0.4% 0.2% Wahiawa 44.5% 82.2% 1.5% 17.7% 0.0% 20.7% 1.9% 0.3%
- 12. Geography Asian At least Chinese Filipino Indonesian Japanese Korean Laotian-Thai- alone part- Vietnamese- Asian Cambodian Waialua 51.2% 85.2% 0.8% 35.0% 0.1% 12.4% 0.2% 0.2% Waianae 18.1% 62.2% 1.5% 10.8% 0.0% 4.5% 0.2% 0.4% Waihee-Waiehu 45.3% 76.7% 1.6% 30.6% 0.0% 9.2% 1.0% 0.6% Waikane 17.9% 57.0% 1.9% 7.2% 0.0% 7.6% 0.0% 0.0% Waikapu 44.8% 78.9% 0.6% 21.0% 0.0% 22.4% 1.0% 0.5% Waikoloa Village 17.0% 46.7% 1.2% 7.3% 0.0% 5.0% 0.6% 0.3% Wailea-Makena 9.1% 19.4% 0.7% 4.2% 0.0% 4.2% 0.6% 0.2% Wailua 36.3% 66.4% 0.8% 10.2% 0.0% 21.3% 0.3% 0.0% Wailua Homesteads 21.0% 56.2% 0.8% 8.9% 0.0% 12.5% 0.3% 0.3% Wailuku 40.6% 73.4% 1.3% 12.8% 0.0% 22.5% 1.8% 0.6% Waimalu 53.7% 82.1% 4.7% 11.9% 0.0% 28.7% 3.5% 0.6% Waimanalo 29.6% 65.7% 1.6% 18.3% 0.0% 4.4% 0.5% 0.1% Waimanalo Beach 6.0% 31.9% 1.7% 1.5% 0.0% 1.6% 0.1% 0.0% Waimea (Hawaii County) 18.4% 52.2% 0.9% 9.0% 0.0% 8.7% 0.4% 0.1% Waimea (Kauai County) 44.6% 81.8% 0.3% 12.9% 0.0% 25.2% 0.3% 0.1% Wainaku 50.7% 79.6% 0.5% 27.6% 0.0% 15.1% 0.4% 0.2% Waipahu 65.4% 84.9% 1.3% 50.3% 0.0% 10.5% 0.5% 0.5% Waipio 56.2% 88.8% 3.3% 18.9% 0.0% 23.5% 2.0% 0.4% Waipio Acres 35.0% 72.9% 1.7% 15.3% 0.0% 12.5% 1.5% 1.0% Wheeler AFB 3.5% 8.9% 0.0% 2.0% 0.0% 0.4% 0.8% 0.3% Whitmore Village 65.1% 93.9% 0.8% 57.0% 0.0% 4.9% 0.3% 0.2%