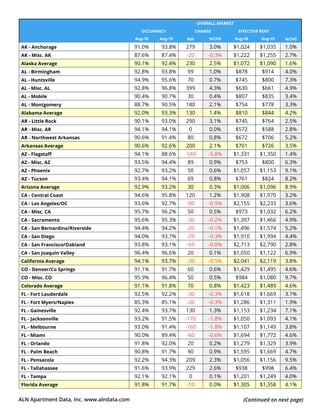
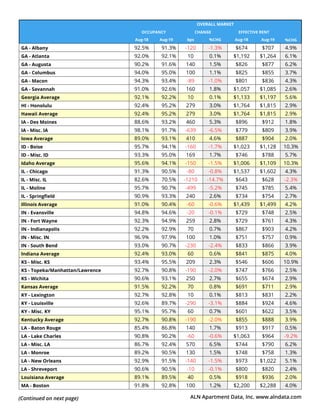
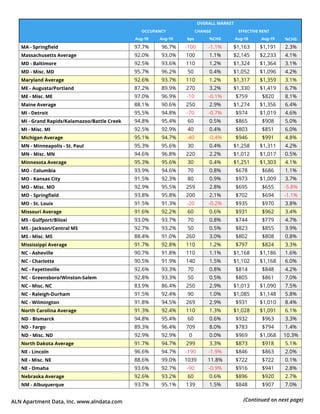
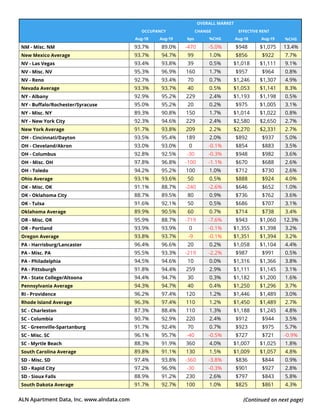
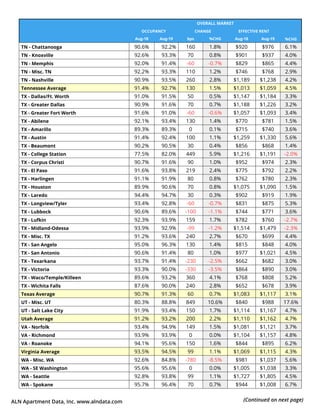
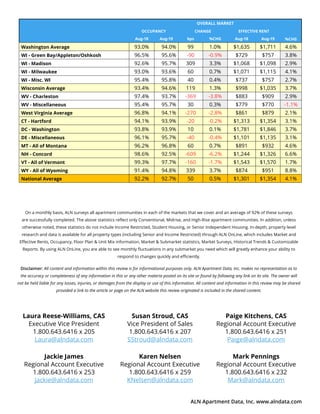
The document is a table providing apartment market data for various cities and states across the United States for August 2018 and August 2019. It includes occupancy rates, change in occupancy rates, and change in effective rent for each location. Some key findings are that occupancy rates increased year-over-year in most locations, with effective rent also increasing in most places between 3-10%. A few locations saw decreases in occupancy rates or effective rents. The data provides a high-level overview of apartment market performance across multiple geographies in the U.S.