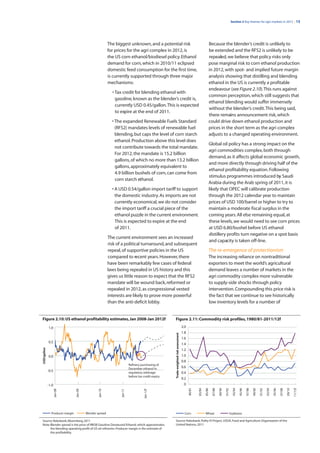
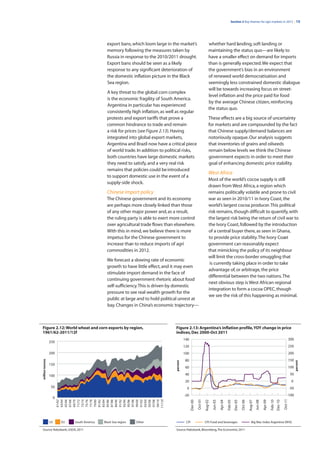
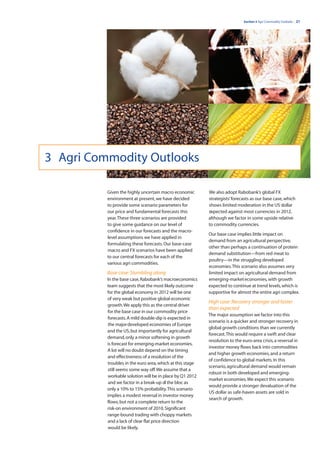
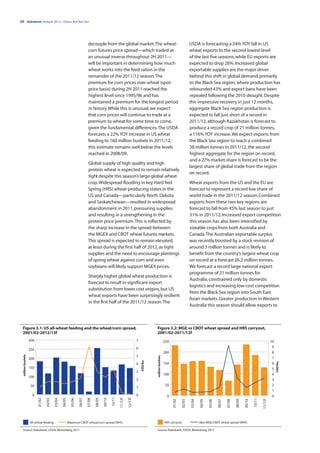
Outlook 2012—Down, But Not Out

Agri Commodity Markets Research
Outlook 2012—Down, But Not Out

                                   Agri Commodity Markets Research


                                                                                                                                                                 Authors:
                                                                                                                                                                 Luke Chandler
                                                                                                                                                                 luke.chandler@rabobank.com

                                                                                                                                                                 Keith Flury
                                                                                                                                                                 keith.flury@rabobank.com

                                                                                                                                                                 Erin FitzPatrick
                                                                                                                                                                 erin.fitzpatrick@rabobank.com

                                                                                                                                                                 Nick Higgins
                                                                                                                                                                 nicholas.higgins@rabobank.com


Rabobank International              Disclaimer: This document is issued by Coöperatieve Centrale Raiffeisen-Boerenleenbank B.A. incorporated in the Netherlands, trading as
                                    Rabobank International (“RI”). The information and opinions contained in this document have been compiled or arrived at from sources
Agri Commodities Market Research    believed to be reliable, but no representation or warranty, express or implied, is made as to their accuracy, completeness or correctness.
                                    This document is for information purposes only and is not, and should not be construed as, an offer or a commitment by RI or any of its
Food & Agribusiness                 affiliates to enter into a transaction, nor is it professional advice. This information is general in nature only and does not take into account
Research and Advisory               an individual’s personal circumstances. All opinions expressed in this document are subject to change without notice. Neither RI, nor other
                                    legal entities in the group to which it belongs, accept any liability whatsoever for any loss howsoever arising from any use of this document
agrimarketsresearch@rabobank.com    or its contents or otherwise arising in connection therewith. This document may not be reproduced, distributed or published, in whole
www.rabotransact.com                or in part, for any purpose, except with the prior written consent of RI. All copyrights, including those within the meaning of the Dutch
                                    Copyright Act, are reserved. Dutch law shall apply. By accepting this document you agree to be bound by the foregoing restrictions.
                                    © Rabobank International Utrecht Branch, Croeselaan 18, 3521 CB, Utrecht, the Netherlands +31 30 216 0000
Contents | i


Contents
                                                                                                                                                                                                 Page


Section 1
Introduction . . . . . . . . . . . . . . . . . . . . . . . . . . . . . . . . . . . . . . . . . . . . . . . . . . . . . . . . . . . . . . . . . . . . . . . . . . . . .                             1
  A review of our forecasts for 2011 . . . . . . . . . . . . . . . . . . . . . . . . . . . . . . . . . . . . . . . . . . . . . . . . . . . . . . . . . . . . . . .                                 3


Section 2
Key themes for agri markets in 2012 . . . . . . . . . . . . . . . . . . . . . . . . . . . . . . . . . . . . . . . . . . . . . . . . . . . . . .                                                    5
  Economic slowdown . . . . . . . . . . . . . . . . . . . . . . . . . . . . . . . . . . . . . . . . . . . . . . . . . . . . . . . . . . . . . . . . . . . . . . . . . . . .                        5
    Biggest losers . . . . . . . . . . . . . . . . . . . . . . . . . . . . . . . . . . . . . . . . . . . . . . . . . . . . . . . . . . . . . . . . . . . . . . . . . . . . . . . . .               5
    US and EU to stumble along . . . . . . . . . . . . . . . . . . . . . . . . . . . . . . . . . . . . . . . . . . . . . . . . . . . . . . . . . . . . . . . . . .                                 6
    Emerging markets to drive demand growth . . . . . . . . . . . . . . . . . . . . . . . . . . . . . . . . . . . . . . . . . . . . . . . . . . .                                                  6
    Doomsday outcome . . . . . . . . . . . . . . . . . . . . . . . . . . . . . . . . . . . . . . . . . . . . . . . . . . . . . . . . . . . . . . . . . . . . . . . . . .                           7
    Economic outlook . . . . . . . . . . . . . . . . . . . . . . . . . . . . . . . . . . . . . . . . . . . . . . . . . . . . . . . . . . . . . . . . . . . . . . . . . . . .                       8
  Speculators and the US dollar . . . . . . . . . . . . . . . . . . . . . . . . . . . . . . . . . . . . . . . . . . . . . . . . . . . . . . . . . . . . . . . . . . .                              9
    Correlation spike . . . . . . . . . . . . . . . . . . . . . . . . . . . . . . . . . . . . . . . . . . . . . . . . . . . . . . . . . . . . . . . . . . . . . . . . . . . . .                   10
    Speculators abandon ags . . . . . . . . . . . . . . . . . . . . . . . . . . . . . . . . . . . . . . . . . . . . . . . . . . . . . . . . . . . . . . . . . . . . .                             10
    Winners and losers . . . . . . . . . . . . . . . . . . . . . . . . . . . . . . . . . . . . . . . . . . . . . . . . . . . . . . . . . . . . . . . . . . . . . . . . . . . .                    10
  Policy risks . . . . . . . . . . . . . . . . . . . . . . . . . . . . . . . . . . . . . . . . . . . . . . . . . . . . . . . . . . . . . . . . . . . . . . . . . . . . . . . . . . . . . .        12
    Fuelling policy speculation . . . . . . . . . . . . . . . . . . . . . . . . . . . . . . . . . . . . . . . . . . . . . . . . . . . . . . . . . . . . . . . . . . .                             12
    The re-emergence of protectionism . . . . . . . . . . . . . . . . . . . . . . . . . . . . . . . . . . . . . . . . . . . . . . . . . . . . . . . . . . .                                       13
    Grains and oilseeds . . . . . . . . . . . . . . . . . . . . . . . . . . . . . . . . . . . . . . . . . . . . . . . . . . . . . . . . . . . . . . . . . . . . . . . . . .                       14
    Chinese import policy . . . . . . . . . . . . . . . . . . . . . . . . . . . . . . . . . . . . . . . . . . . . . . . . . . . . . . . . . . . . . . . . . . . . . . . .                         15
    West Africa . . . . . . . . . . . . . . . . . . . . . . . . . . . . . . . . . . . . . . . . . . . . . . . . . . . . . . . . . . . . . . . . . . . . . . . . . . . . . . . . . . .             15
    Elections . . . . . . . . . . . . . . . . . . . . . . . . . . . . . . . . . . . . . . . . . . . . . . . . . . . . . . . . . . . . . . . . . . . . . . . . . . . . . . . . . . . . .           16
  Capacity constraints . . . . . . . . . . . . . . . . . . . . . . . . . . . . . . . . . . . . . . . . . . . . . . . . . . . . . . . . . . . . . . . . . . . . . . . . . . . .                    17
    Supply squeeze . . . . . . . . . . . . . . . . . . . . . . . . . . . . . . . . . . . . . . . . . . . . . . . . . . . . . . . . . . . . . . . . . . . . . . . . . . . . . . .                  17
    Increased yield volatility . . . . . . . . . . . . . . . . . . . . . . . . . . . . . . . . . . . . . . . . . . . . . . . . . . . . . . . . . . . . . . . . . . . . . .                        18
    Higher price floors . . . . . . . . . . . . . . . . . . . . . . . . . . . . . . . . . . . . . . . . . . . . . . . . . . . . . . . . . . . . . . . . . . . . . . . . . . . .                   19


Section 3
Agri Commodity Outlooks . . . . . . . . . . . . . . . . . . . . . . . . . . . . . . . . . . . . . . . . . . . . . . . . . . . . . . . . . . . . . . . .                                           21
    Base case: Stumbling along . . . . . . . . . . . . . . . . . . . . . . . . . . . . . . . . . . . . . . . . . . . . . . . . . . . . . . . . . . . . . . . . . . .                              21
    High case: Recovery stronger and faster than expected . . . . . . . . . . . . . . . . . . . . . . . . . . . . . . . . . . . . . . . .                                                         21
    Low case: From bad to worse . . . . . . . . . . . . . . . . . . . . . . . . . . . . . . . . . . . . . . . . . . . . . . . . . . . . . . . . . . . . . . . . . .                               22
  Wheat . . . . . . . . . . . . . . . . . . . . . . . . . . . . . . . . . . . . . . . . . . . . . . . . . . . . . . . . . . . . . . . . . . . . . . . . . . . . . . . . . . . . . . . . . .       23
  Corn . . . . . . . . . . . . . . . . . . . . . . . . . . . . . . . . . . . . . . . . . . . . . . . . . . . . . . . . . . . . . . . . . . . . . . . . . . . . . . . . . . . . . . . . . . . .    26
  Soybeans . . . . . . . . . . . . . . . . . . . . . . . . . . . . . . . . . . . . . . . . . . . . . . . . . . . . . . . . . . . . . . . . . . . . . . . . . . . . . . . . . . . . . . .          29
  Palm Oil . . . . . . . . . . . . . . . . . . . . . . . . . . . . . . . . . . . . . . . . . . . . . . . . . . . . . . . . . . . . . . . . . . . . . . . . . . . . . . . . . . . . . . . .        32
  Sugar . . . . . . . . . . . . . . . . . . . . . . . . . . . . . . . . . . . . . . . . . . . . . . . . . . . . . . . . . . . . . . . . . . . . . . . . . . . . . . . . . . . . . . . . . . .     35
  Coffee . . . . . . . . . . . . . . . . . . . . . . . . . . . . . . . . . . . . . . . . . . . . . . . . . . . . . . . . . . . . . . . . . . . . . . . . . . . . . . . . . . . . . . . . . .      38
  Cocoa . . . . . . . . . . . . . . . . . . . . . . . . . . . . . . . . . . . . . . . . . . . . . . . . . . . . . . . . . . . . . . . . . . . . . . . . . . . . . . . . . . . . . . . . . .       41
  Cotton . . . . . . . . . . . . . . . . . . . . . . . . . . . . . . . . . . . . . . . . . . . . . . . . . . . . . . . . . . . . . . . . . . . . . . . . . . . . . . . . . . . . . . . . . .      43
  Livestock . . . . . . . . . . . . . . . . . . . . . . . . . . . . . . . . . . . . . . . . . . . . . . . . . . . . . . . . . . . . . . . . . . . . . . . . . . . . . . . . . . . . . . .         45
    Live cattle . . . . . . . . . . . . . . . . . . . . . . . . . . . . . . . . . . . . . . . . . . . . . . . . . . . . . . . . . . . . . . . . . . . . . . . . . . . . . . . . . . . .           45
    Lean hogs . . . . . . . . . . . . . . . . . . . . . . . . . . . . . . . . . . . . . . . . . . . . . . . . . . . . . . . . . . . . . . . . . . . . . . . . . . . . . . . . . . . .             46


Appendix . . . . . . . . . . . . . . . . . . . . . . . . . . . . . . . . . . . . . . . . . . . . . . . . . . . . . . . . . . . . . . . . . . . . . . . . . . . . . . . .                          49
Section 1 Introduction | 1


 1 Introduction

                                      Rabobank sees agri commodity prices down,              the levels seen in 2008/09. Elevated price
                                      but not out, in 2012. Improved fundamental             levels must persist in order to encourage
                                      balances and uncertain economic conditions             farmers to continue expanding production
                                      are expected to keep prices below the 2011             to keep pace with demand growth and
                                      highs. However, risks to our price forecasts           allowing global inventories to rebuild.
                                      are skewed upwards as reliance upon
                                                                                             Agri commodity demand should remain
                                      nontraditional producers pose an increasing
                                                                                             robust in 2012 as consumptive growth in
                                      threat, and inventories remain near
                                                                                             emerging-market economies continues to
                                      historical lows.
                                                                                             drive the agri complex. Our analysis suggests
                                      We believe the long-term bull run in agri              that supply side risks, from both weather
                                      commodities remains, but expect prices                 and politics, have increased again for 2012
                                      across the complex to ease from their record           and there remains considerable risk of an
                                      highs, continuing their downward trajectory            inflection in both price and volatility levels
                                      in place since mid-2011. Absent further macro          amid adverse production conditions across
                                      deterioration, prices are unlikely to plunge to        the agri complex.


Figure 1.1: Rabobank’s 2012 agri commodity price forecasts

                                    Q1’11     Q2’11       Q3’11       Q4’11f      Spot*         Q1’12f      Q2’12f     Q3’12f          Q4’12f

Wheat (CBOT)           USc/bu        788        748         688         610          579          595         630         615             595
Wheat (Matif)          EUR/tonne     253        234         199         170          179          162         175         172             166
Corn                   USc/bu        674        732         696         620          585          610         645         630             610
Soybeans               USc/bu       1,381      1,363       1,358       1,165      1,122          1,178       1,226      1,260           1,251
Soy oil                USc/lb        57.0       57.3        55.8        49.4       49.3           48.7        50.2       49.1            47.5
Soymeal                USD/ton       260        240         230         300          282          310         290         330             335
Palm oil               MYR/tonne    3,681      3,365       3,100       3,000      3,171          2,800       2,900      3,000           3,100
Sugar                  USc/lb        30.6       24.4        28.7        24.5       23.1           23.5        23.0       22.0            22.0
Coffee                 USc/lb        258        271         257         230          232          220         200         180             170
Cocoa                  USD/tonne    3,322      3,042       2,969       2,400      2,246          2,350       2,450      2,350           2,300
Cotton                 USc/lb        182        168         108          95             91         85          85          80              80

Source: Rabobank, Bloomberg, 2011
2 | Rabobank Outlook 2012—Down, But Not Out


                                              We see lower average prices for all agri                   1. Economic slowdown
                                              commodities covered in our 2012 forecast.
                                                                                                         2. Speculators and the US dollar
                                              However, we see upside, from depressed spot
                                              prices, for corn, wheat, soybeans, sugar and               3. Policy risks
                                              cocoa as fundamentals reassert themselves
                                                                                                         4. Capacity constraints
                                              and market participants continue to come to
                                              grips with the European debt crisis. We see            Given the heightened uncertainty in the
                                              downside to cotton and palm oil prices in the          macro environment, we have decided to
                                              short term. In the livestock sector we expect          frame our price and fundamental forecasts
                                              higher live cattle prices and slightly lower lean      in base, low and high-case scenarios to
                                              hogs prices in 2012.                                   give guidance over the level of confidence
                                                                                                     around our economic forecasts and macro
                                              Our outlook is centred on four key themes
                                                                                                     level assumptions.
                                              for the agri commodity markets in 2012
                                              which we expect to determine commodity
                                              prices. Aside from the inherent weather
                                              uncertainties in agriculture, we identify
                                              these variables as critical for the agri complex
                                              over the next 12 months.


  Rabobank’s 12-month outlook for prices from current levels


                                                                                          Soymeal prices are likely to rebound in 2012 after
  SOYMEAL                                                                                 underperformance relative to soy oil and soybeans in 2011.


                                                                                          Soybean prices are likely to be lower YOY in 2012, but
  SOYBEANS                                                                                remain historically elevated, rationing demand, as global
                                                                                          production declines.


                                                                                          US live cattle prices are expected to fall in Q1 2012 from their
  LIVE CATTLE                                                                             November 2011 highs as a record number of cattle on feed outstrips
                                                                                          demand in the near term.


                                                                                          Although lower than 2011 averages, we expect corn prices to rally
  CORN                                                                                    from current spot prices into Q2 2012 before easing in Q4 2012 on
                                                                                          record production.


                                                                                          Abundant supply of cocoa beans and better expectations for the
  COCOA                                                                                   2011/12 crop are expected to lead prices lower in 2012.


                                                                                          The demand profile for soy oil is relatively recession-resistant,
  SOY OIL                                                                                 which will likely see prices remain elevated in order to slow
                                                                                          demand growth.


                                                                                          Neutral price direction is expected over the next 12 months as the
  WHEAT                                                                                   second largest world wheat crop on record softens the fundamental
                                                                                          outlook, but coarse grains provide support.


                                                                                          Despite our forecast for record large palm oil production in 2012, we
  PALM OIL                                                                                expect the low stock levels of total vegetable oils to limit palm oil’s
                                                                                          price downside.


                                                                                          Momentum in the US lean hog market is expected to wane in 2012
  LEAN HOGS                                                                               as producers increase farrowing to meet demand and Chinese
                                                                                          import growth slows.


                                                                                          We forecast lower international sugar prices in 2012 as the market
  SUGAR                                                                                   shifts into a surplus for the first time in three seasons.


                                                                                          We expect the global cotton industry to be under pressure and
  COTTON                                                                                  prices to fall due to the largest global cotton crop on record.


                                                                                          Prices are forecast to fall in 2012 due to the large harvests expected
  COFFEE                                                                                  in Brazil and Vietnam, but diminished stocks will keep risks high.
Section 1 Introduction | 3


A quick look in the rear-view mirror: A review of our forecasts for 2011

One of the most common questions we get when talking to clients is “how accurate were your forecasts last year?” This is a
very valid question, so before we launch into our 2012 agri markets outlook, we would like to share a quick self-evaluation
of our performance in 2011—the good, the bad and the ugly.
Our 2011 agri markets outlook report, Agri Bull Market Clouded by Macro Uncertainty, released in December 2010,
highlighted seven key themes for the year ahead.
     1. Tightening inventory levels
     2. Supply limitations
     3. Demand growth from emerging markets
     4. China commodity short
     5. Heightened political risk amid tightening food supplies
     6. Fundamentals only part of the story
     7. Sustained heightened volatility
These were the issues we saw as the most important variables likely to influence agri commodity markets in 2011, in
addition to constant supply and demand drivers, such as weather vagaries. Overall, these issues all showed varying degrees
of relevance in 2011, and many of them will remain relevant in 2012, assuming the absence of major weather events.
As last year’s title suggested, from a fundamental viewpoint we held a bullish outlook for the agri complex; our price
forecasts showed an expectation of higher prices for all but one market in 2011. Our top picks for 2011 were corn, soybeans
and coffee, and as it turned out, two out of three ranked at the top of the list in terms of year-on-year price increases, with
coffee the top performer, followed by cotton and corn (see Figure 1.2). Our price forecasts for most commodities were
generally accurate in terms of direction, with only cocoa moving against our forecast due to the outlier event of the
election crisis in Ivory Coast, which we did highlight as a risk, and which created an unexpected rally for prices. Interestingly,
as the situation has normalised and supply chains have restocked, prices have tracked in line with our forecast curve, albeit
at an elevated level (see Figure 1.3).
The other major event of 2011 was the hottest July the US Midwest has seen in over 50 years, which reshaped the supply
side of the balance sheet for the grains complex. This extreme weather event resulted in both a production forecast
downgrade of over 10% and significantly higher prices. Since April, our price forecasts have reflected a much tighter
balance sheet and have quite accurately indicated Q2 as a turning point with quarter-on-quarter declines forecast for Q3
and Q4 (see Figure 1.4).


  Figure 1.2: Rabobank 2011 forecasts (December 2010) vs. actual, 2011
                                       Rabobank 2011 forecasts (December 2010)                         Actual
                                      Q1’11      Q2’11       Q3’11        Q4’11       Q1’11    Q2’11            Q3’11          Q4’11
  Wheat               USc/bu            700         680         675          675        788       748             688              610
  Corn                USc/bu            600         580         550          540        674       732             696              620
  Soybeans            USc/bu           1,300      1,275        1,200       1,185       1,381    1,363            1,358           1,165
  Soy oil             USc/lb             53          54          52              52      57        57              56               49
  Soymeal             USD/ton           355         350         345          340        367       354             353              300
  Palm oil            MYR/tonne        3,650      3,200        2,900       2,750       3,681    3,365            3,100           3,000
  Sugar               USc/lb             28          26          24              22      31        24              29               25
  Coffee              USc/lb            195         195         190          185        258       271             257              230
  Cocoa               USD/tonne        2,550      2,450        2,350       2,300       3,322    3,042            2,969           2,400
  Cotton              USc/lb            135         115          90              85     182       168             108               95


  Source: Rabobank, Bloomberg, 2011
4 | Rabobank Outlook 2012—Down, But Not Out


       Figure 1.3: ICE NY Cocoa; Rabobank forecast vs. actual prices,                                                                Figure 1.4: CBOT Corn; Rabobank forecast vs. actual prices,
       2010-11                                                                                                                       2010-11
                    3,400                                                                                                                                 800
                                                                                                                                                          750
                    3,200
                                                                                                                                                          700
                    3,000                                                                                                                                 650
                                                                                                                                                          600
        USD/tonne


                                                                                                                                      USc/bu
                    2,800                                                                                                                                 550
                                                                                                                                                          500
                    2,600
                                                                                                                                                          450
                    2,400                                                                                                                                 400
                                                                                                                                                          350
                    2,200                                                                                                                                 300
                               Q1'10   Q2'10   Q3'10       Q4'10         Q1'11      Q2'11      Q3'11          Q4'11
                                                                                                                                                                        Q1’10       Q2’10     Q3’10     Q4’10   Q1’11    Q2’11      Q3’11   Q4’11


                      Actual           Dec 2010 forecast                                                                                                  Actual                    Dec 2010 forecast           Apr 2011 forecast

       Source: Rabobank, Bloomberg, 2011                                                                                              Source: Rabobank, Bloomberg, 2011


     Our most accurate price forecasts across the year were for oilseeds (soybeans, soymeal, soy oil and palm oil) and wheat,
     where negative supply-side issues were less of a factor (see Figure 1.5). Our least accurate forecasts were two of the ‘COs’,
     cotton and coffee, where despite the direction of the forecast being correct, the magnitude of the price increases was well
     above our expectations.

                                                                   Figure 1.5: Rabobank quarterly average price forecasts vs.
                                                                   actual price moves in 2011
                                                                             70
                                                                             60
                                                                             50
                                                                             40
                                                                   percent


                                                                             30
                                                                             20
                                                                             10
                                                                              0
                                                                             -10
                                                                             -20
                                                                                   Wheat

                                                                                            Corn

                                                                                                   Soybeans

                                                                                                                 Soy oil

                                                                                                                           Soymeal

                                                                                                                                               Palm oil

                                                                                                                                                                Sugar

                                                                                                                                                                           Coffee

                                                                                                                                                                                      Cocoa

                                                                                                                                                                                               Cotton


                                                                              Rabobank December 2010 forecast                        Actual

                                                                   Source: Rabobank, Bloomberg, 2011


     Our commodity price forecasts are provided as a guide to demonstrate our expectations for price direction throughout
     the year—regularly updated in our Agri Commodity Markets Research Monthly reports. In view of the level of volatility in
     the macroeconomy and the general uncertainty in 2011, our forecasts from a year ago have turned out to be reasonably
     accurate. Our bias for higher prices in the complex proved correct and our top picks—corn, soybeans and coffee—
     performed better than expected. The seven key themes we identified all played a role in price movements during 2011,
     most notably supply limitations and heightened political risk due to their impact on corn and cocoa prices. As these risks
     intensified in Q1 2011, our price forecasts were more accurately revised higher while maintaining a downward bias towards
     the end of 2011. Although our forecasts for 2H 2011 appeared bearish against market estimates and the futures forward
     curve, our expectations for more balanced fundamentals and an easing in prices have largely played out, and we expect
     this to continue into 2012.
Section 2 Key themes for agri markets in 2012 | 5


2 Key themes for agri markets in 2012

           Economic slowdown                                 Biggest losers
           Slowing global economic growth in 2012            We anticipate an increased supply of many
           will only have a modest impact on agri            agri commodities to result in lower prices in
           commodity prices as resilient emerging-           2012, but we do not expect a price collapse
           market demand offsets anaemic growth              due to supportive demand and only a modest
           expectations in the developed world.              build-up of inventories. However, as supply is
           We expect commodities that have a large           forecast to be historically tight for many agri
           speculator long position and those with           commodities, we anticipate supply-side
           a high correlation to global growth,              concerns to remain a major supportive factor
           including livestock and cotton, to be the         for most markets, especially coffee and corn.
           most vulnerable to slowing global growth.         On the demand side of the ledger, we expect
           Commodities with a stable demand base             lower international prices to encourage buying
           and supportive fundamentals, such as corn         and stock-building. In our view, demand loss in
           and coffee, are expected to be the least          the developed world will be inconsequential
           exposed to a contraction in economic growth.      even with an economic downturn, as lower
                                                             prices encourage commercial buying.
           Rabobank sees continued macro uncertainty
                                                             Demand growth in emerging markets is
           with stagnant growth prospects in the EU
                                                             expected to remain robust and a driver
           and the US, and resilient but weaker
                                                             of prices in the agri complex.
           expansion in the emerging-market
           economies in 2012 (see Figure 2.1). We view       We see the cotton and livestock markets
           the prospect of a return to recession as a        as most vulnerable to economic contraction
           considerable risk for both the US and the EU,     and stagnant growth. Total meat and fish
           but we expect any contraction to be shallow.      consumption in the US peaked in 2004 and
           As industry and governments are aware of          has been declining ever since due to altered
           the recession risk and are positioned             diets and reduced incomes. This trend is being
           defensively, we expect a downturn to be           countered by increased meat and fish
           small. Our emerging-market growth forecast        consumption in emerging markets, which is
           projects a level of growth similar to what was    more than enough to offset the reduction in
           seen in the first half of the decade, and while   US consumption. In our view, the higher
           the emerging markets are not likely to be able    valued livestock markets will be exposed to
           to decouple from the developed world, we          demand loss if there are further reductions to
           see domestic consumption prospects and            household incomes in the US. The high share
           proactive governments as reasons these            of speculators in the livestock futures markets
           economies will avoid being dragged into a         is also viewed as a threat since a risk-off sell-
           recession by the developed world economies.       off could pressure the markets. The speculator
                                                             net long in the US livestock markets of
6 | Rabobank Outlook 2012—Down, But Not Out


                                              15 November represented 22% of total open                           US and EU to stumble along
                                              interest, up from 9% in early June, and up                          Rabobank’s macro economists are forecasting
                                              from the 2011 average of 18%. Given the                             economic growth in the US to be slightly
                                              fundamentals, there is a compelling reason                          lower in 2012 as political deadlock and
                                              for livestock values to be elevated currently,                      waning consumer confidence result in
                                              but we see the market as particularly                               economic stagnation. Gross domestic product
                                              vulnerable to macro risks. Since cotton is a                        (GDP) in the US is forecast to grow at 1.5% in
                                              consumer product, the cotton market is also                         2012, down from 1.7% in 2011 and down
                                              highly susceptible to recession, and given the                      from 3.0% in 2010. In the EU the outlook is
                                              forecast fundamentals in the new season, we                         bleaker; we expect debt concerns and stalling
                                              see heightened downside risk. Cotton prices                         member economies to bring about only slim
                                              on the NY market have fallen during the last                        positive growth. EU GDP is expected to slow
                                              seven US recessions going back to 1970                              to 0.4% in 2012 from the 1.6% expected in
                                              (see Figure 2.2). Cotton prices are forecast                        2011 and the 1.8% expected in 2010. Our
                                              lower in 2012 due to better supply and                              modest growth forecast assumes the EU will
                                              lacklustre demand, but weakening economies                          have found a lasting resolution to the debt
                                              could extenuate the downside correction.                            crisis. Elevated risks remain skewed to the
                                                                                                                  downside for both regions as unemployment
                                              Differing underlying fundamentals as well
                                                                                                                  remains high, market sentiment is weak and
                                              as diverse income elasticities of demand
                                                                                                                  social unrest is rising.
                                              will result in varied price reactions among
                                              commodities during recessionary events. We                          We forecast limited demand loss for agri
                                              expect the main economies of the world to                           commodities in both the EU and the US
                                              remain out of recession in 2012, but as risks of                    even in the face of a double-dip recession.
                                              a double-dip recession in both the US and the                       Although real incomes are declining in the
                                              EU are high, we have reviewed the potential                         US and unemployment is high in both
                                              response in the agri complex. In general,                           regions, food remains a small part of
                                              recessions do not impact agri commodities                           discretionary incomes and the consumption
                                              uniformly. In fact, supply dynamics are much                        of most agri commodities is anticipated
                                              more important for price movements, and                             to be stable. High-value products such as
                                              this is expected to be the case in the event of                     livestock or consumer-oriented cotton are
                                              a recession in 2012. Recessions have little                         the most exposed to economic risk and
                                              effect on the demand side in the developed                          could be threatened depending on the
                                              world and economic contractions do not                              scale of a downturn.
                                              generally impact supply, which is much more
                                                                                                                  Emerging markets to drive demand
                                              dependent on long-term prices and weather.
                                                                                                                  growth
                                              The downside risk for commodities is much
                                                                                                                  Rabobank anticipates emerging-market
                                              larger if a sizeable slowdown in emerging
                                                                                                                  growth to ease in 2012 but demand growth
                                              markets occurs, as this is the source for much
                                                                                                                  in agri commodities to remain strong. We
                                              of the expected expansion in consumption.
                                                                                                                  foresee economic growth rates in the


 Figure 2.1: Rabobank GDP quarterly growth estimates and                          Figure 2.2: Performance of the S&P GSCI Agriculture Index over
 forecasts, Q1 2000-Q3 2012                                                       the past seven US recessions, Dec 1969-2009
           15                                                                         600

           10                                                                         500

                                                                                      400
 percent


            5
                                                                                      300
            0
                                                                                      200

            -5                                                                        100

                                                                                         0
           -10
                                                                                                                                                                                                         Oct-11
                                                                                                                                                                              Apr-01
                                                                                                      Apr-73

                                                                                                               Oct-76

                                                                                                                        Apr-80

                                                                                                                                 Oct-83

                                                                                                                                          Apr-87

                                                                                                                                                   Oct-90

                                                                                                                                                            Apr-94

                                                                                                                                                                     Oct-97


                                                                                                                                                                                       Oct-04

                                                                                                                                                                                                Apr-08
                                                                                             Dec-69
                  00Q1

                  01Q1

                  02Q1

                  03Q1

                  04Q1

                  05Q1

                  06Q1

                  07Q1

                  08Q1

                  09Q1

                  10Q1

                  11Q1
                  00Q3

                  01Q3

                  02Q3

                  03Q3

                  04Q3

                  05Q3

                  06Q3

                  07Q3

                  08Q3

                  09Q3

                  10Q3

                 11Q3e

                 12Q3f
                 12Q1f


 e=estimate; f=forecast
                 US   Euro area       China          Brazil                             S&P GSCI Agriculture Index                        Recession

 Source: IMF, Rabobank, 2011                                                      Source: Bloomberg, Rabobank, NBER, 2011
Section 2 Key themes for agri markets in 2012 | 7


                                                                         emerging markets to hover near the bottom                                                                  is significant as household incomes increase
                                                                         of levels seen just before the financial crisis                                                            and demand changes from staple grains to
                                                                         of 2008/09, with emerging-market growth                                                                    more protein from meat. The higher share
                                                                         forecast at 6.5% for 2012, down modestly                                                                   of income devoted to food in China is also a
                                                                         from 6.9% in 2011 and 7.8% in 2010, but                                                                    threat as higher prices can result in significant
                                                                         modestly higher compared with the 2000-                                                                    demand destruction. The ongoing
                                                                         2005 average of 6.0%. In our view, the                                                                     demographic and agricultural conversion
                                                                         emerging-market economies will not be                                                                      from a rural population and fragmented
                                                                         able to decouple from a slowdown in the                                                                    production to an urban population and
                                                                         developed world, but increasing domestic                                                                   intensive food production will continue in
                                                                         demand will play a larger role in growth and                                                               2012. Domestic inflation of food prices is
                                                                         will be supportive for the agri complex. For                                                               forecast to ease in 2012 as international agri
                                                                         Brazil, we expect GDP growth in 2012 of 3.6%,                                                              commodity prices fall. This is likely to support
                                                                         flat from 3.6% in 2011, and we continue to                                                                 further increases in demand in China. In our
                                                                         see global demand for agri commodities                                                                     view, elevated agri commodity prices resulted
                                                                         as a driving force in the Brazilian economy.                                                               in Chinese government destocking in 2011.
                                                                         The changing diets and increasing urban                                                                    The need to restock inventories will be a
                                                                         population in the emerging markets are                                                                     supportive impact for prices and is expected
                                                                         expected to remain the drivers for the agri                                                                to occur despite the modest forecast
                                                                         complex. Demand for oilseeds in emerging                                                                   downturn in economic growth.
                                                                         markets has grown 110% since 1999 while in
                                                                                                                                                                                    Doomsday outcome
                                                                         the developed world the increase has been
                                                                                                                                                                                    Rabobank views the likelihood of a recession
                                                                         12% (see Figure 2.3). Increasing consumption
                                                                                                                                                                                    or major contraction of the Chinese economy
                                                                         of agri commodities in emerging markets has
                                                                                                                                                                                    in 2012 as very slim. However, a contraction
                                                                         played a major role in tightening balance
                                                                                                                                                                                    would have major consequences for both the
                                                                         sheets despite large global harvests in the
                                                                                                                                                                                    global economy and the agri commodity
                                                                         past two seasons, and we expect this trend
                                                                                                                                                                                    complex. Given the Chinese government’s
                                                                         to continue in 2012.
                                                                                                                                                                                    readiness to spend vast reserves to
                                                                         A slowdown in the key Chinese economy in                                                                   support the economy and to acquire agri
                                                                         2012 is not expected to impact the growth                                                                  commodities to alleviate high domestic prices
                                                                         in agri commodity demand as inventories                                                                    and avert social unrest, we would expect
                                                                         are low for many commodities, inflation                                                                    the agri complex to remain supported even
                                                                         is elevated and the government has the                                                                     in the case of slower-than-anticipated
                                                                         means and will to secure supplies on the                                                                   economic growth. A hard landing for China
                                                                         international market to temper and even                                                                    would have profound negative impacts on
                                                                         control domestic food prices (see Figure 2.4).                                                             the agri complex, but any contraction event
                                                                         Food costs represent a higher share of                                                                     would likely only have short-term impacts
                                                                         household income in China relative to the                                                                  on the market.
                                                                         US or the EU. This is an opportunity since the
                                                                         potential to increase agri commodity demand


Figure 2.3: Oilseed consumption EU and US vs. BRICs,                                                                              Figure 2.4: Global GDP and agri commodity demand indexed,
1999/00-2011/12f                                                                                                                  Dec 1986-Dec 2010
                 160                                                                                                                               300                                                                                                                             500
                 150                                                                                                                                                                                                                                                               450
                 140                                                                                                                               250                                                                                                                             400
                 130                                                                                                                                                                                                                                                               350
million tonnes


                                                                                                                                  Dec 1986 = 100


                                                                                                                                                                                                                                                                                         Dec 1986 = 100


                 120                                                                                                                               200                                                                                                                             300
                 110                                                                                                                                                                                                                                                               250
                 100                                                                                                                               150                                                                                                                             200
                  90                                                                                                                                                                                                                                                               150
                  80                                                                                                                               100                                                                                                                             100
                  70                                                                                                                                                                                                                                                                50
                  60                                                                                                                                50                                                                                                                               0
                                                                                                                                                         Dec-86

                                                                                                                                                                  Dec-88

                                                                                                                                                                           Dec-90

                                                                                                                                                                                      Dec-92

                                                                                                                                                                                               Dec-94

                                                                                                                                                                                                        Dec-96

                                                                                                                                                                                                                    Dec-98

                                                                                                                                                                                                                             Dec-00

                                                                                                                                                                                                                                      Dec-02

                                                                                                                                                                                                                                               Dec-04

                                                                                                                                                                                                                                                        Dec-06

                                                                                                                                                                                                                                                                 Dec-08

                                                                                                                                                                                                                                                                          Dec-10
                       99/00

                               00/01

                                       01/02

                                                 02/03

                                                         03/04

                                                                 04/05

                                                                         05/06

                                                                                 06/07

                                                                                         07/08

                                                                                                 08/09

                                                                                                         09/10

                                                                                                                 10/11

                                                                                                                         11/12f


                                                                                                                                                     Corn demand                               Soybeans demand
                   US and EU                   BRICs                                                                                                 Sugar demand                              Global GDP (RHS)

Source: Rabobank, USDA, 2011                                                                                                      Source: USDA, Rabobank, IMF, 2011
8 | Rabobank Outlook 2012—Down, But Not Out


                                              Economic outlook
                                              Recession or slowing economic growth will
                                              be a threat to the agri commodity markets in
                                              2012, but in our view the expected resilient
                                              demand growth from many agri commodity
                                              markets in emerging economies will help
                                              mitigate the impacts from any economic
                                              downturns. We anticipate lower-than-average
                                              stock levels of many agri commodities to
                                              support prices; while harvests are expected
                                              to be large, encouraged by the high prices,
                                              the supply response is still catching up to
                                              demand. In our view, a recession, if it does
                                              occur, would be expected to be shallow
                                              and not to impact agri commodity demand.
                                              However, cotton is viewed as more
                                              susceptible to a downturn, and livestock
                                              consumption can also be impacted by
                                              recession, but we see emerging-market
                                              demand expansion as more than sufficient
                                              to make up for demand losses in the
                                              developed world. We anticipate lower prices
                                              in 2012 as a function of better supply; this
                                              will support demand despite the heightened
                                              global macro uncertainty.
Section 2 Key themes for agri markets in 2012 | 9


Speculators and the US dollar                            likely against most other commodities in
Weak fundamentals for the US dollar should               2012. Loose monetary policy conditions in
produce a period of further devaluation                  the US following two rounds of quantitative
versus most other currencies throughout                  easing in 2008 and 2010, ongoing record
2012, providing upside support for most                  low interest rates, high unemployment and
agri markets. But as we have seen in 2011,               anaemic growth expectations for the US
fundamentals do not always matter.                       economy are expected to see most other
Rabobank’s base-case macro and foreign                   currencies outperform the US dollar over
exchange forecasts suggest that a weaker                 the next 12 months. However, we do expect
US dollar environment will reappear again                to see some recovery of the US dollar against
in 2012. While global financial market and               major commodity currencies in 2012, which
macroeconomic uncertainty remain a                       we believe are overvalued.
significant risk to our forecasts, particularly
                                                         These weaker fundamentals for the US dollar
if the trend of widespread risk aversion
                                                         look set to reassert themselves in 2012, and
continues from 2011 into 2012, a generally
                                                         while the US Federal Open Market Committee
weaker US dollar should be a supportive
                                                         (FOMC) has not indicated they will implement
factor for the agri complex in the year ahead.
                                                         another round of quantitative easing stimulus
Unsurprisingly, we do not expect the                     (QE3) at this stage; they have not ruled it
weakness of the US dollar to be uniform                  out either, and we expect this to remain in
in magnitude or even direction, with the                 play throughout 2012. Even without QE3,
potential for short-term upside against                  US Federal Reserve policy measures look
the euro afflicted by political paralysis and            set to remain loose, with US Federal Reserve
disunity in the member bloc. However, against            Chairman Bernanke explicitly stating that
other currencies we see further downside for             the federal funds rate was set to remain at
the US dollar from current levels, improving             an “exceptionally low level at least through
both the purchasing power of emerging-                   mid-2013” given conditional economic
                                                                    ,
market importers and the competitiveness                 conditions. Our forecasts do not see a case
of US agricultural exporters against many                for strong enough growth in 2012 to move
of their key competitors (see Figure 2.5). We            FOMC policy from current levels. A risk to
would expect most prices within the agri                 this view is the possibility that the European
complex to appreciate in a weaker US dollar              Central Bank could become the lender of
environment. We highlight corn, wheat,                   last resort which would have a longer term
soybeans and lean hogs as the biggest                    drag on the euro, balancing the poor US
winners in the complex as the US export                  dollar fundamentals.
market improves on a weaker dollar.
                                                         Recovery from the current challenges appears
Once the dust settles on the EU debt crisis,             likely to be protracted and hence we see
we expect focus to return to weaker                      loose monetary policy and a weak US dollar
fundamentals for the US dollar, with downside            as capable of buttressing the US economy.


 Figure 2.5: Rabobank FX forecasts, 2012

                          Q1’12   Q2’12       Q3’12          Q4’12

 EUR/USD                   1.33    1.39           1.45        1.48

 USD/JPY                  78.00   79.00       82.00          83.00

 GBP/USD                   1.56    1.62           1.69        1.74

 USD/CHF                   0.93    0.90           0.90        0.91

 AUD/USD                   1.00    0.98           0.97        0.95

 NZD/USD                   0.76    0.75           0.74        0.73

 USD/CAD                   1.00    0.99           0.98        0.98


 Source: Rabobank, 2011
10 | Rabobank Outlook 2012—Down, But Not Out


                                                                                                                  ‘Flight to safety’ has become a common                                                                                                                   complex and key macro indicators jumping
                                                                                                                  catch cry in 2011 and, given the ongoing                                                                                                                 sharply to reflect the focus of the EU debt
                                                                                                                  macroeconomic uncertainty, risk aversion                                                                                                                 crisis (see Figure 2.7). As this continues to
                                                                                                                  may well continue to be a key theme in 2012.                                                                                                             play out, we expect uncertainty to remain
                                                                                                                  This macro uncertainty—primarily the result                                                                                                              elevated, resulting in a continuation of high
                                                                                                                  of the EU debt crisis, but also influenced by                                                                                                            correlation between most asset classes
                                                                                                                  bipartisan politics in the US and mounting                                                                                                               continuing into 1H 2012.
                                                                                                                  worries of a Chinese economic slowdown—
                                                                                                                                                                                                                                                                          Speculators abandon ags
                                                                                                                  has created a risk-on/risk-off trading
                                                                                                                                                                                                                                                                          Speculative money flows will largely be
                                                                                                                  environment in all markets over the past
                                                                                                                                                                                                                                                                          determined by the macro environment in
                                                                                                                  12 months. Risk-off has meant a withdrawal
                                                                                                                                                                                                                                                                          2012, with a clear resolution in the euro area
                                                                                                                  of funds from emerging market assets and
                                                                                                                                                                                                                                                                          needed to restore confidence levels amongst
                                                                                                                  currencies, as they are perceived to be higher
                                                                                                                                                                                                                                                                          investors. Over the past 12 months, we have
                                                                                                                  in risk than the US dollar, despite growth
                                                                                                                                                                                                                                                                          seen diverging dynamics: the first half of the
                                                                                                                  prospects in these markets remaining much
                                                                                                                                                                                                                                                                          year saw surging agri markets attracting
                                                                                                                  stronger than in most developed economies.
                                                                                                                                                                                                                                                                          additional investor inflows as an inflationary
                                                                                                                  For agricultural prices, this has compounded
                                                                                                                                                                                                                                                                          hedge amid rising world food prices, while a
                                                                                                                  price volatility as speculators have not only
                                                                                                                                                                                                                                                                          flight to safety resulted in significant net
                                                                                                                  shifted into and out of the underlying agri
                                                                                                                                                                                                                                                                          outflows of investor capital from agri markets
                                                                                                                  markets, but also between the commodity
                                                                                                                                                                                                                                                                          in the second half of the year. Looking ahead,
                                                                                                                  currencies and the US dollar (see Figure 2.6).
                                                                                                                                                                                                                                                                          a sudden and complete return of investor
                                                                                                                  Looking ahead to 2012, the challenge
                                                                                                                                                                                                                                                                          money into the agri complex appears
                                                                                                                  becomes one of macro uncertainty and
                                                                                                                                                                                                                                                                          diminished as the macro uncertainty is likely
                                                                                                                  whether we continue to see periods of
                                                                                                                                                                                                                                                                          to remain for some time to come. We also
                                                                                                                  extreme risk aversion continuing in 2012.
                                                                                                                                                                                                                                                                          expect there will be less of a constructive
                                                                                                                  Correlation spike                                                                                                                                       fundamental story in agri markets in 2012 as
                                                                                                                  The extreme macro uncertainty has resulted                                                                                                              fundamentals appear more in balance than in
                                                                                                                  in all asset classes becoming even more                                                                                                                 recent seasons.
                                                                                                                  intertwined over the past 12 months. Broader
                                                                                                                                                                                                                                                                          Winners and losers
                                                                                                                  themes such as liquidity, political risk, financial
                                                                                                                                                                                                                                                                          Based on Rabobank’s forecast of a weaker US
                                                                                                                  stability, austerity measures and social unrest
                                                                                                                                                                                                                                                                          dollar against most developed and emerging-
                                                                                                                  have all resulted in agri markets, currencies,
                                                                                                                                                                                                                                                                          market currencies over the next 12 months,
                                                                                                                  equities and other asset classes becoming
                                                                                                                                                                                                                                                                          commodities produced and exported from
                                                                                                                  highly correlated for most of 2H 2011. Recent
                                                                                                                                                                                                                                                                          the US are the most likely to benefit. Further
                                                                                                                  developments have escalated fears of
                                                                                                                                                                                                                                                                          devaluation of the US dollar in 2012 will add
                                                                                                                  contagion. Globally, there are considerable
                                                                                                                                                                                                                                                                          support to what we expect to be resilient
                                                                                                                  concerns as to whether individual commodity
                                                                                                                                                                                                                                                                          emerging-market demand for agricultural
                                                                                                                  or asset class fundamentals have become
                                                                                                                                                                                                                                                                          commodities (see Figure 2.8). Recent years
                                                                                                                  mostly irrelevant as focus has shifted from risk
                                                                                                                                                                                                                                                                          have seen considerable decoupling of
                                                                                                                  appetite to risk aversion. In September 2011,
                                                                                                                                                                                                                                                                          emerging-market currencies from the US
                                                                                                                  we saw the correlations between the agri


  Figure 2.6: Managed money net long positions in agri                                                                                                                                                   Figure 2.7: Correlation between the agri complex and key macro
  commodities vs. S&P GSCI Agriculture Index, Jan 2007-Nov 2011                                                                                                                                          indicators, Jan 2007-Sep 2011
                               600                                                                                                                                          1,400                                                                      0.7
                                                                                                                                                                                                         daily price correlation to MSCI World Index


                               550                                                                                                                                          1,200                                                                      0.6
  S&P GSCI Agriculture Index


                               500                                                                                                                                          1,000                                                                      0.5
                                                                                                                                                                                    thousand contracts


                               450                                                                                                                                           800                                                                       0.4
                               400                                                                                                                                           600                                                                       0.3
                               350                                                                                                                                           400                                                                       0.2
                               300                                                                                                                                           200                                                                       0.1
                               250                                                                                                                                             0                                                                         0
                                                                                                                                                 Jan-11
                                                                                                                                                          May-11
                                                                                                                                                                   Sep-11
                                     Jan-07
                                              May-07
                                                       Sep-07
                                                                Jan-08
                                                                         May-08
                                                                                  Sep-08
                                                                                           Jan-09
                                                                                                    May-09
                                                                                                             Sep-09
                                                                                                                      Jan-10
                                                                                                                               May-10
                                                                                                                                        Sep-10


                                                                                                                                                                                                                                                              2007          2008       2009         2010           2011    Sep-2011


                                                                                                                                                                                                                                                        S&P GSCI Agriculture Index      CBOT Corn           NY ICE Sugar

                                S&P GSCI Agriculture Index                                               Managed money net long (RHS)                                                                                                                   CBOT Wheat            Average (Rabobank coverage)

  Source: CFTC, Bloomberg, 2011                                                                                                                                                                          Source: Rabobank, Bloomberg, 2011
Section 2 Key themes for agri markets in 2012 | 11


dollar, which enables additional purchasing
power in a weaker US dollar environment.
In the instance of China, one of the key
destinations for US agricultural exports, looser
regulatory control has seen the Chinese
renminbi gain 7%-8% versus the US dollar
since mid-2010 and over 23% since 2005. We
are forecasting a near-record 4 million tonnes
of corn to be exported to China in the
2011/12 season and, given domestic supply
concerns and inflationary pressure from
historically high grain prices, a weaker US
dollar versus the renminbi may encourage
further imports to help meet burgeoning
domestic demand. Similarly, we also see
additional demand support from a weaker
US dollar for soybeans, pork and beef.

A weaker US dollar can also alter trade flows
by providing improved competitiveness for
US agricultural exports on the world market.
Commodities we see as most likely to benefit
from this are the key US grains and oilseeds
such as corn, soybeans and, to a lesser degree,
wheat. US beef and pork exports will also
likely benefit from a devaluation of the US
dollar, although market access tends to be a
more potent determining factor for these
markets. While the US dollar is forecast to
weaken against most currencies, we are
forecasting it to strengthen against the
Australian and New Zealand dollars and to
hold fairly stable relative to the Canadian
dollar. Although these commodity currencies
are generally defined by their economies’
reliance on metal and energy exports,
agricultural exports from these countries can
compete with US exports for global market
share. For example, wheat exports from
Australia will likely benefit from a weakening
Australian dollar relative to the US dollar.


 Figure 2.8: USD index and S&P GSCI Agriculture Index, 1993-2011


     120
                                                                                  550
     110
                                                                                  450
     100
                                                                                  350
      90

                                                                                  250
      80

      70                                                                          150
                                        2001


                                                                           2011
           1993

                   1995

                          1997

                                 1999


                                               2003

                                                      2005

                                                             2007

                                                                    2009


       USD index                                               S&P GSCI Agriculture Index

 Source: Rabobank, Bloomberg, 2011
12 | Rabobank Outlook 2012—Down, But Not Out


                                           Policy risks                                         world will see pressure to cut subsidies to
                                           Global agricultural markets are being                farmers who are operating in an environment
                                           increasingly politicised, impacting global           of near-record agri market prices. With this
                                           agricultural trade, contributing to heightened       in mind, forecasting the political risks to the
                                           supply uncertainty and lifting price volatility.     world’s food basket, and the prices at which
                                           Geopolitical factors, such as the 2010/11            it is available, will become a more complex
                                           Black Sea region grain export bans, and a            task in 2012.
                                           return of civil war to the Ivory Coast, had
                                                                                                We see corn and cocoa as especially
                                           significant impacts on agricultural markets
                                                                                                vulnerable to political risks in 2012, although
                                           (see Figure 2.9). We believe that 2012 will
                                                                                                fundamentals are improving for both as
                                           once again see political intervention as an
                                                                                                producers responded to higher prices by
                                           important determiner of winners and losers
                                                                                                increasing production in 2011. The risk
                                           in the agri complex.
                                                                                                spectrum for the agri complex is skewed
                                           It is important to note the difference between       further upward in 2012 as political risks pose
                                           the ongoing political battles in the arena of        larger threats to global trade balances.
                                           general fiscal policy and political changes
                                                                                                Fuelling policy speculation
                                           directly applicable to the agri complex.
                                                                                                The 2012 US Presidential Elections represent
                                           Our particular focus is on the potential
                                                                                                the largest potential stumbling point for US
                                           for protectionist responses to exaggerate
                                                                                                agricultural support mechanisms in several
                                           supply shocks.
                                                                                                years. Despite market rhetoric, the US has the
                                           Protectionist responses to weather anomalies,        fourth-lowest producer support estimate as
                                           which are likely to increase as the threat of        a percentage of GDP in the OECD, indicating
                                           climate change looms larger, are on the rise.        comparatively low net transfers to the agri
                                           Market sensitivity to rising food inflation in       complex. However, as rounds of budgetary
                                           the developing world is increasing. Upcoming         negotiations should bring about substantial
                                           presidential elections in the US pose a risk         reductions in US agricultural subsidies from
                                           to renewable fuel subsidies. Perhaps most            2012 onwards, support is likely to decrease
                                           important of all, the over-indebted developed        even further.


  Figure 2.9: Policy risk hotspots in 2012


                                                                                      Black Sea
                                                                                 region export bans


                                                                                                              Chinese strategic reserves
                               Ethanol policy review                                                          and self-sufficiency


                                                                                              Sugar export quotas to
                                                                                              support domestic prices
                                                             Civil wars and cocoa-OPEC


                                                  Export tariffs and
                                                  industrial action


  Source: Rabobank, 2011
Section 2 Key themes for agri markets in 2012 | 13


                                                            The biggest unknown, and a potential risk                                                             Because the blender’s credit is unlikely to
                                                            for prices for the agri complex in 2012, is                                                           be extended and the RFS2 is unlikely to be
                                                            the US corn ethanol/biodiesel policy. Ethanol                                                         repealed, we believe that policy risks only
                                                            demand for corn, which in 2010/11 eclipsed                                                            pose marginal risk to corn ethanol production
                                                            domestic feed consumption for the first time,                                                         in 2012, with spot- and implied future margin
                                                            is currently supported through three major                                                            analysis showing that distilling and blending
                                                            mechanisms:                                                                                           ethanol in the US is currently a profitable
                                                                                                                                                                  endeavour (see Figure 2.10). This runs against
                                                              • Tax credit for blending ethanol with
                                                                                                                                                                  common perception, which still suggests that
                                                                gasoline, known as the blender’s credit is,
                                                                                                                                                                  ethanol blending would suffer immensely
                                                                currently USD 0.45/gallon. This is expected
                                                                                                                                                                  without the blender’s credit. This being said,
                                                                to expire at the end of 2011.
                                                                                                                                                                  there remains announcement risk, which
                                                              • The expanded Renewable Fuels Standard                                                             could drive down ethanol production and
                                                                (RFS2) mandates levels of renewable fuel                                                          prices in the short term as the agri complex
                                                                blending, but caps the level of corn starch                                                       adjusts to a changed operating environment.
                                                                ethanol. Production above this level does
                                                                                                                                                                  Global oil policy has a strong impact on the
                                                                not contribute towards the total mandate.
                                                                                                                                                                  agri commodities complex, both through
                                                                For 2012, the mandate is 15.2 billion
                                                                                                                                                                  demand, as it affects global economic growth,
                                                                gallons, of which no more than 13.2 billion
                                                                                                                                                                  and more directly through driving half of the
                                                                gallons, approximately equivalent to
                                                                                                                                                                  ethanol profitability equation. Following
                                                                4.9 billion bushels of corn, can come from
                                                                                                                                                                  stimulus programmes introduced by Saudi
                                                                corn starch ethanol.
                                                                                                                                                                  Arabia during the Arab spring of 2011, it is
                                                              • A USD 0.54/gallon import tariff to support                                                        likely that OPEC will calibrate production
                                                                the domestic industry. As imports are not                                                         through the 2012 calendar year to maintain
                                                                currently economical, we do not consider                                                          prices of USD 100/barrel or higher to try to
                                                                the import tariff a crucial piece of the                                                          maintain a moderate fiscal surplus in the
                                                                ethanol puzzle in the current environment.                                                        coming years. All else remaining equal, at
                                                                This is expected to expire at the end                                                             these levels, we would need to see corn prices
                                                                of 2011.                                                                                          at USD 6.80/bushel before US ethanol
                                                                                                                                                                  distillery profits turn negative on a spot basis
                                                            The current environment sees an increased
                                                                                                                                                                  and capacity is taken off-line.
                                                            risk of a political turnaround, and subsequent
                                                            repeal, of supportive policies in the US                                                              The re-emergence of protectionism
                                                            compared to recent years. However, there                                                              The increasing reliance on nontraditional
                                                            have been remarkably few cases of federal                                                             exporters to meet the world’s agricultural
                                                            laws being repealed in US history and this                                                            demand leaves a number of markets in the
                                                            gives us little reason to expect that the RFS2                                                        agri commodity complex more vulnerable
                                                            mandate will be wound back, reformed or                                                               to supply-side shocks through policy
                                                            repealed in 2012, as congressional vested                                                             intervention. Compounding this price risk is
                                                            interests are likely to prove more powerful                                                           the fact that we continue to see historically
                                                            than the anti-deficit lobby.                                                                          low inventory levels for a number of


Figure 2.10: US ethanol profitability estimates, Jan 2008-Jan 2012f                                    Figure 2.11: Commodity risk profiles, 1980/81-2011/12f
             1.0                                                                                                                        2.0
                                                                                                                                        1.8
                                                                                                       Trade-weighted risk assessment


                                                                                                                                        1.6
             0.5
                                                                                                                                        1.4
USD/gallon


                                                                                                                                        1.2
             0.0                                                                                                                        1.0
                                                                                                                                        0.8
                                                                            Refinery purchasing of
                                                                            December ethanol in                                         0.6
             -0.5                                                           regulatory arbitrage                                        0.4
                                                                            before tax credit expiry
                                                                                                                                        0.2
             -1.0                                                                                                                        0
                                                                                                                                              80/81


                                                                                                                                                      83/84

                                                                                                                                                              85/86

                                                                                                                                                                      87/88

                                                                                                                                                                              89/90

                                                                                                                                                                                      91/92

                                                                                                                                                                                                93/94

                                                                                                                                                                                                        95/96

                                                                                                                                                                                                                97/98

                                                                                                                                                                                                                        99/00

                                                                                                                                                                                                                                01/02

                                                                                                                                                                                                                                        03/04

                                                                                                                                                                                                                                                05/06

                                                                                                                                                                                                                                                        07/08

                                                                                                                                                                                                                                                                09/10

                                                                                                                                                                                                                                                                        11/12f
                    Jan-08


                                 Jan-09


                                                   Jan-10


                                                                   Jan-11


                                                                                        Jan-12f


               Producer margin            Blender spread                                                                                  Corn                Wheat                           Soybeans

Source: Rabobank, Bloomberg, 2011                                                                      Source: Rabobank, Polity IV Project, USDA, Food and Agriculture Organization of the
Note: Blender spread is the price of RBOB Gasoline-Denatured Ethanol, which approximates               United Nations, 2011
      the blending operating profit of US oil refineries. Producer margin is the estimate of
      the profitability.
14 | Rabobank Outlook 2012—Down, But Not Out


                                           commodities, with protectionist policy                     becomes an increasing aim of the
                                           decisions more easily resulting in trade                   government. The risk of an economic
                                           deficits or supply shortages. Supply                       slowdown and a reduction in support
                                           also tends to be less reliable in these                    programmes would have only a marginal
                                           nontraditional export countries due to                     effect on imports, as the government
                                           weather vulnerabilities, logistical constraints            would remain incentivised to encourage
                                           and a lower degree of social stability, all                domestic consumption.
                                           factors which lend themselves to a greater
                                                                                                   Grains and oilseeds
                                           tendency towards political intervention.
                                                                                                   In 2012, a record share of world grain exports
                                           Unsurprisingly, this results in markets having
                                                                                                   will come from the Black Sea region and
                                           to factor in risk premiums to account for the
                                                                                                   South America, potentially surpassing the
                                           uncertainty for both producers and
                                                                                                   share of the EU and the US (see Figure 2.12).
                                           consumers, thereby heightening near-
                                                                                                   This creates higher political risk and volatility
                                           term volatility.
                                                                                                   in markets as they grapple with the feast or
                                           We see grains, oilseeds and cocoa as the                famine nature of exports from these rapidly
                                           commodities in the agri complex most at risk            developing regions.
                                           in 2012. Our custom assessment of trade-
                                                                                                   A large part of this political risk is derived
                                           weighted geopolitical risks for sections of
                                                                                                   from the grains complex being regarded as
                                           the agri complex highlights the increasing
                                                                                                   a strategic national imperative, particularly
                                           political risk inherent to the corn and
                                                                                                   true for the Black Sea region. This leaves
                                           soybeans markets as marginal production
                                                                                                   agri markets increasingly dependent on
                                           shifts from the developed to the developing
                                                                                                   interventionist governments in the Black
                                           world (see Figure 2.11). We have generally seen
                                                                                                   Sea region, the main exporters of which
                                           improving risk profiles for soft commodities
                                                                                                   are Russia, Ukraine and Kazakhstan. Best
                                           though they have higher absolute levels,
                                                                                                   demonstrating their potential for
                                           despite being exacerbated by higher
                                                                                                   protectionist actions were the export bans
                                           exportable quantities which skews our metric
                                                                                                   imposed by Russia from 2010 to 2011,
                                           higher. Low stocks-to-use ratios across the
                                                                                                   Kazakhstan in 2008, and Ukraine in 2007
                                           agri complex would further aggravate the
                                                                                                   and 2010/11.
                                           price effects of any changes in the political
                                           situation in the agri complex, such as:                 Additionally, the Ukrainian government
                                                                                                   recently enacted laws to facilitate control over
                                               • The potential for grain export bans or the
                                                                                                   the country’s exports in conjunction with a
                                                 resumption of prohibitive export tariffs
                                                                                                   relaxation of export duties. The fact that
                                                 in the Black Sea region is compounded
                                                                                                   CBOT Wheat prices rose 15.6% in the two
                                                 by the likelihood the policies of the
                                                                                                   days spanning the imposition of the Russian
                                                 constituent countries would move
                                                                                                   export ban demonstrates the immediate
                                                 in parallel.
                                                                                                   impact such moves can have on markets.
                                               • With large shares of global grain and             This move came in spite of market
                                                 oilseed supply flowing from Brazil                positioning already anticipating a yield
                                                 and Argentina, there is a possibility that        reduction of 8% following the previous
                                                 a particularly damaging La Niña could             month’s USDA WASDE report.
                                                 encourage these governments to enact
                                                                                                   As the trend towards an increasingly
                                                 policies to support domestic stocks and
                                                                                                   important role of nontraditional and more
                                                 usage. Trucking industrial action in
                                                                                                   risky suppliers continues, substantial risk
                                                 Argentina in October 2011 highlighted
                                                                                                   premiums have been, and must continue
                                                 this susceptibility. Prohibitive export tariffs
                                                                                                   to be, built into grain and oilseed prices.
                                                 on soybeans in Argentina continue to
                                                                                                   Increasingly strong buying from major
                                                 create tension between the government
                                                                                                   importers will ensure that any supply
                                                 and farmers.
                                                                                                   disruptions from these regions will be met
                                               • West Africa remains politically volatile and      with significant price rises.
                                                 we see further protectionist steps being
                                                                                                   As marginal increases in world production
                                                 taken in 2012 as Ivory Coast considers
                                                                                                   come increasingly from countries with higher
                                                 establishing a single-buyer policy.
                                                                                                   levels of political risk, the market tends to
                                                 Production concentration in this region
                                                                                                   apply higher risk premiums to prices in the
                                                 heightens this risk.
                                                                                                   short term as the chance of supply
                                               • Changes in Chinese engagement in the              disruptions increases. We see this tendency
                                                 import market are likely to be supportive         being compounded by political
                                                 of prices, as domestic food-price stability       overreactions, mainly taking the form of
Section 2 Key themes for agri markets in 2012 | 15


                                                 export bans, which loom large in the market’s                              whether hard landing, soft landing or
                                                 memory following the measures taken by                                     maintaining the status quo—are likely to
                                                 Russia in response to the 2010/2011 drought.                               have a smaller effect on demand for imports
                                                 Export bans should be seen as a likely                                     than is generally expected. We expect that
                                                 response to any significant deterioration of                               the government’s bias in an environment
                                                 the domestic inflation picture in the Black                                of renewed world democratisation and
                                                 Sea region.                                                                seemingly less constrained domestic dialogue
                                                                                                                            will be towards increasing focus on street-
                                                 A key threat to the global corn complex
                                                                                                                            level inflation and the price paid for food
                                                 is the economic fragility of South America.
                                                                                                                            by the average Chinese citizen, reinforcing
                                                 Argentina in particular has experienced
                                                                                                                            the status quo.
                                                 consistently high inflation, as well as regular
                                                 protests and export tariffs that prove a                                   These effects are a big source of uncertainty
                                                 common hindrance to trade and remain                                       for markets and are compounded by the fact
                                                 a risk for prices (see Figure 2.13). Having                                that Chinese supply/demand balances are
                                                 integrated into global export markets,                                     notoriously opaque. Our analysis suggests
                                                 Argentina and Brazil now have a critical piece                             that inventories of grains and oilseeds
                                                 of world trade. In addition to political risks,                            remain below levels we think the Chinese
                                                 both countries have large domestic markets                                 government expects in order to meet their
                                                 they need to satisfy, and a very real risk                                 goal of enhancing domestic price stability.
                                                 remains that policies could be introduced
                                                                                                                            West Africa
                                                 to support domestic use in the event of a
                                                                                                                            Most of the world’s cocoa supply is still
                                                 supply-side shock.
                                                                                                                            drawn from West Africa, a region which
                                                 Chinese import policy                                                      remains politically volatile and prone to civil
                                                 The Chinese government and its economy                                     war as seen in 2010/11 in Ivory Coast, the
                                                 are perhaps more closely linked than those                                 world’s largest cocoa producer. This political
                                                 of any other major power and, as a result,                                 risk remains, though difficult to quantify, with
                                                 the ruling party is able to exert more control                             the largest risk being the return of civil war to
                                                 over agricultural trade flows than elsewhere.                              the Ivory Coast, followed by the introduction
                                                 With this in mind, we believe there is more                                of a central buyer there, as seen in Ghana,
                                                 impetus for the Chinese government to                                      to provide price stability. The Ivory Coast
                                                 increase than to reduce imports of agri                                    government can reasonably expect
                                                 commodities in 2012.                                                       that mimicking the policy of its neighbour
                                                                                                                            will limit the cross-border smuggling that
                                                 We forecast a slowing rate of economic
                                                                                                                             is currently taking place in order to take
                                                 growth to have little effect, and it may even
                                                                                                                            advantage of, or arbitrage, the price
                                                 stimulate import demand in the face of
                                                                                                                            differential between the two nations. The
                                                 continuing government rhetoric about food
                                                                                                                            next obvious step is West African regional
                                                 self-sufficiency. This is driven by domestic
                                                                                                                            integration to form a cocoa OPEC, though
                                                 pressure to see real wealth growth for the
                                                                                                                            we see the risk of this happening as minimal.
                                                 public at large and to hold political unrest at
                                                 bay. Changes in China’s economic trajectory—


Figure 2.12: World wheat and corn exports by region,                                 Figure 2.13: Argentina’s inflation profile, YOY change in price
1961/62-2011/12f                                                                     indices, Dec 2000-Oct 2011
                                                                                               140                                                                                                                                  300
                 250
                                                                                               120                                                                                                                                  250
                 200                                                                           100                                                                                                                                  200
                                                                                                80                                                                                                                                  150
million tonnes


                                                                                     percent


                                                                                                                                                                                                                                          percent


                 150
                                                                                                60                                                                                                                                  100

                 100                                                                            40                                                                                                                                   50
                                                                                                20                                                                                                                                   0
                  50                                                                             0                                                                                                                                  -50
                                                                                               -20                                                                                                                             -100
                      0
                                                                                                               Oct-01


                                                                                                                                                                                                                           Oct-11
                          11/12f
                           61/62
                           63/64
                           65/66
                           67/68
                           69/70
                           71/72
                           73/74
                           75/76
                           77/78
                           79/80
                           81/82
                           83/84
                           85/86
                           87/88
                           89/90
                           91/92
                           93/94
                           95/96
                           97/98
                           99/00
                           01/02
                           03/04
                           05/06
                           07/08
                           09/10


                                                                                                      Dec-00


                                                                                                                        Aug-02
                                                                                                                                 Jun-03
                                                                                                                                          Apr-04
                                                                                                                                                   Feb-05
                                                                                                                                                            Dec-05
                                                                                                                                                                     Oct-06
                                                                                                                                                                              Aug-07
                                                                                                                                                                                       Jun-08
                                                                                                                                                                                                Apr-09
                                                                                                                                                                                                         Feb-10
                                                                                                                                                                                                                  Dec-10


                 US       EU   South America   Black Sea region   Other                         CPI                     CPI: Food and beverages                                  Big Mac Index Argentina (RHS)

Source: Rabobank, USDA, 2011                                                         Source: Rabobank, Bloomberg, The Economist, 2011
16 | Rabobank Outlook 2012—Down, But Not Out


                                           The risks of production concentration in
                                           such volatile countries mean there is a
                                           significant upside skew to the cocoa price,
                                           contingent upon changes in the West African
                                           political situation.

                                           Elections
                                           Elections provide significant scope,
                                           outside the expected changes to agricultural
                                           policy, to catalyse protectionist policy
                                           implementation for short-term economic
                                           gain. Any such policy action, be it new tariffs
                                           or accommodative domestic policy, can be
                                           easily justified as responding to perceptions
                                           of global economic uncertainty to ensure
                                           domestic stability. We will monitor a number
                                           of specific elections during 2012 in which we
                                           see potential surprises for markets and
                                           resulting price effects for agri commodities
                                           (see Figure 2.14).


                                               Figure 2.14: Selected political events, 2012

                                                                    Estimated date          Assessed agri            Event description
                                                                                            market impact

                                               US                   3 January               Low                      First Republican party primary in Iowa

                                               Egypt                January-March           Low                      Parliamentary election

                                               Russia               4 March                 Low-moderate             Presidential and local elections

                                               US                   6 March                 Low                      Super Tuesday, 10 states; Republican party candidate

                                               Iran                 29 March                Moderate                 Parliamentary election

                                               France               22 April                Moderate                 Presidential elections, first round

                                               France               10 June                 Moderate                 Parliamentary elections, first round

                                               Mexico               1 July                  Moderate                 Presidential and parliamentary elections

                                               India                July                    Low                      Presidential elections (elected by parliament)

                                               Kazakhstan           August                  Moderate                 Parliamentary elections

                                               Turkey               August                  Low                      Presidential elections

                                               Brazil               7 October               Moderate                 Municipal elections, first round

                                               Ukraine              28 October              High                     Parliamentary elections
                                                                    October 2012-
                                               China                                        Moderate                 Communist party internal leadership selection
                                                                    March 2013
                                               US                   6 November              Moderate                 Presidential, House and 1/3 of Senate elections

                                               Ghana                December                Moderate                 Presidential and parliamentary elections


                                               Source: Rabobank, relevant governments, Bloomberg, New York Times, 2011
Section 2 Key themes for agri markets in 2012 | 17


Capacity constraints                                                                               heavily on higher-risk production regions
Supplies of a number of agri commodities will                                                      such as the Black Sea region. At the same
remain historically low in 2012 as the world’s                                                     time, the break-even price in these countries,
capacity to respond to elevated prices by                                                          many of which are in historically low-cost
increasing production continues to be                                                              areas, is increasing as production costs rise
constrained. Many agricultural markets                                                             and credit remains tight. We expect these
remain susceptible to supply-side shocks                                                           supply constraints to be compounded by the
as inventory levels remain tight—though                                                            already low inventory levels, which will
not at historical lows for most commodities—                                                       continue to be supportive of agri commodity
and high production costs, lack of land                                                            prices in 2012 (see Figure 2.15). This is reflected
availability and capital restrictions limit                                                        by our base-case price forecasts, where
a recovery in inventories.                                                                         we expect to see a slight easing in most
                                                                                                   commodities, but a very soft landing with
We forecast global ending stocks to decline
                                                                                                   prices remaining at historically elevated levels.
in 2011/12 for five of the eight commodities
included in our coverage, most notably in                                                          Supply squeeze
coffee (-24%), soybeans (-11%) and corn (-7%).                                                     Supplies of most agri commodities leading
More modest declines are forecast for wheat                                                        into 2012 remain precariously tight with
(-3%) and cocoa (-2%), while stocks are                                                            some at or near record low stocks-to-use
forecast to build for cotton (20%), palm                                                           ratios. The USDA forecasts the world’s total
oil (12%) and sugar (11%). Most of the                                                             grain and oilseed stocks-to-use ratio to
commodities for which we forecast to see a                                                         decline in 2011/12 to below 20%—the lowest
decline in stocks despite record high or near                                                      level since 2007/08. This is despite the USDA’s
record high production also experienced                                                            forecast for the global grain and oilseed area
smaller incremental growth in production.                                                          harvested to increase by the largest amount
This is unlike previous cyclical commodity                                                         since 2008/09 and to reach a record large
bull rallies where production increased at                                                         755 million hectares. The primary driver across
a pace sufficient to meet growing demand                                                           the complex is the tightening of the corn
and replenish stocks. Global grain and                                                             balance sheet for a third consecutive year,
oilseed stocks-to-use ratio, for instance,                                                         bringing the stocks-to-use ratio to the lowest
have remained below the long-term average                                                          level in nearly 40 years. The persistent low
for the past 10 years, despite elevated year-                                                      level of global corn stocks in the face of
on-year increases in production.                                                                   record high prices and production will
                                                                                                   continue to be a key price determinant across
Much of the low-hanging fruit in terms of
                                                                                                   the entire complex in 2012, despite a sharp
production growth through land expansion
                                                                                                   year-on-year increase in global wheat
and yield advancements has been exploited,
                                                                                                   production. With corn production unable
causing output growth to be more expensive
                                                                                                   to surpass consumption for a second
and have a higher risk profile. In 2012, we
                                                                                                   consecutive year, the ability to replenish
expect production growth will be hindered
                                                                                                   inventories of crops which lost planted area
by the limited availability of global arable
                                                                                                   to corn in 2011—as soybeans did—will also
land, which is causing the world to rely more
                                                                                                   be challenged. As a result, we expect corn


 Figure 2.15: Global grain and oilseed stocks-to-use and 5-year
 average YOY change in production , 1969/70-2011/12f
           35
                                                                                                             80
                                                                                                                   YOY change (million tonnes)


           30                                                                                                60
 percent


                                                                                                             40
           25

                                                                                                             20
           20
                                                                                                              0

           15                                                                                                -20
                69/70


                        75/76

                                79/80

                                        83/84

                                                87/88

                                                        91/92

                                                                95/96

                                                                           99/00

                                                                                   03/04

                                                                                           07/08

                                                                                                    11/12f


           Stocks-to-use                                                5-year average change in production

 Source: Rabobank, USDA, 2011
18 | Rabobank Outlook 2012—Down, But Not Out


                                                                         to lead the grains and oilseeds complex                                                                  as Europe and the US), which also have the
                                                                         for the beginning of 2012, keeping the                                                                   smallest amount of production constraints,
                                                                         soybean-to-corn price ratio historically                                                                 has flatlined, pushing an increased share of
                                                                         low and challenging wheat’s historical                                                                   production growth to countries such as
                                                                         premium to corn.                                                                                         Russia, Brazil, Ukraine and Argentina.
                                                                                                                                                                                  The world’s reliance on these emerging
                                                                         Risk aversion may limit the amount of
                                                                                                                                                                                  agricultural producers is expected to increase
                                                                         capital deployed to increase agri commodity
                                                                                                                                                                                  to a record high 18% in 2011/12, reducing
                                                                         production in 2012 (see Figure 2.16).
                                                                                                                                                                                  traditional exporting countries’ share to
                                                                         Continued uncertainty surrounding the
                                                                                                                                                                                  below 40% for the first time on record.
                                                                         economic and political outlook for 2012
                                                                         is likely to curb the amount of capital                                                                  As their market share has increased in recent
                                                                         deployed in the global agriculture sector.                                                               years, so too has the variance in global yields
                                                                         At the farmgate level, producers will be                                                                 for corn, soybeans and wheat (see Figure 2.17).
                                                                         hesitant to invest in large purchases or land                                                            While it is still too early to determine yield
                                                                         expansion as they are uncertain of future                                                                levels for the 2012/13 crop, the outlook for
                                                                         returns. Political debates surrounding                                                                   winter crops in the Black Sea region is already
                                                                         the continuation of many government                                                                      being closely monitored due to adverse
                                                                         programmes which support the agriculture                                                                 planting conditions. Over 30% of Ukraine’s
                                                                         sector further fuel this uncertainty. This theme                                                         new crop winter grain could be lost due to
                                                                         of conservatism will play out more strongly                                                              the current drought.
                                                                         in regions that are deemed to be higher risk
                                                                                                                                                                                  As global agri commodity production
                                                                         by investors who are withdrawing from
                                                                                                                                                                                  continues to expand into emerging markets,
                                                                         emerging markets in a ‘flight to safety’. From
                                                                                                                                                                                  so too will the battle for acres which persists
                                                                         an agricultural perspective, this will impact
                                                                                                                                                                                  in developed economies such as the US and
                                                                         those countries that have shown the largest
                                                                                                                                                                                  the EU. This battle is likely to intensify in 2012
                                                                         growth in production in recent years: the
                                                                                                                                                                                  as the increase in grain area harvested in 2011
                                                                         emerging markets. Additionally, a more
                                                                                                                                                                                  (at the expense of oilseeds) did not result in a
                                                                         conservative outlook for the economic
                                                                                                                                                                                  sufficient production response to replenish
                                                                         growth in emerging markets will likely
                                                                                                                                                                                  stocks. Yet at the same time, the stocks-to-use
                                                                         limit the volume growth in loans to the
                                                                                                                                                                                  ratios of vegetable oils are likely to fall to their
                                                                         agriculture sector.
                                                                                                                                                                                  lowest levels in nearly 40 years for a second
                                                                         Increased yield volatility                                                                               consecutive season. This will likely cause
                                                                         The market share of global agricultural                                                                  ending stocks of both grains and oilseeds in
                                                                         production capacity in countries with higher                                                             2011/12 to show a year-on-year decline for
                                                                         yield variance will continue to grow in 2012.                                                            the first time since 2003/04. We expect corn
                                                                         We expect the market share of regions with                                                               values to offer Northern Hemisphere farmers
                                                                         elevated production risks, such as the Black                                                             higher profits than other row crops, further
                                                                         Sea region and Argentina, to rise further in                                                             reducing the area available to plant to
                                                                         2012. The production capacity in traditional                                                             oilseeds and cotton.
                                                                         agri commodity producing countries (such


 Figure 2.16: Brazil financial system loans to agriculture and                                                                                   Figure 2.17: Global yield variance and production shares
 YOY change in Brazil’s total area planted, 2002/03-2011/12f
                     4                                                                                          20                                         5                                                                                  22
                                                                                                                18
                                                                                                                                                                                                                                              20
                                                                                                                     YOY Change in BRL billion


                     3                                                                                          16                                         4
  million hectares


                     2                                                                                          14                                                                                                                            18
                                                                                                                                                 percent


                                                                                                                                                                                                                                                   percent


                                                                                                                12
                     1                                                                                          10                                         3                                                                                  16
                                                                                                                 8
                     0                                                                                           6                                                                                                                            14
                                                                                                                                                           2
                     -1                                                                                          4
                                                                                                                                                                                                                                              12
                                                                                                                 2
                     -2                                                                                          0                                         1                                                                                  10
                          02/03

                                  03/04

                                          04/05

                                                  05/06

                                                          06/07

                                                                     07/08

                                                                             08/09

                                                                                     09/10e

                                                                                              10/11f

                                                                                                       11/12f


                                                                                                                                                               81/82


                                                                                                                                                                          86/87


                                                                                                                                                                                      91/92


                                                                                                                                                                                                  96/97


                                                                                                                                                                                                              01/02


                                                                                                                                                                                                                         06/07


                                                                                                                                                                                                                                     11/12f


                                                                                                                                                               Global yield variance of corn, soybeans and wheat
                     YOY change area planted                      Agriculture loans to Brazil (RHS)                                                            Argentina, Brazil and Black Sea region share of global production (RHS)

  Source: Rabobank, CONAB, Bloomberg, 2011                                                                                                       Source: Rabobank, USDA, 2011
Section 2 Key themes for agri markets in 2012 | 19


Higher price floors                                                   potential as prices still remain below the
The cost to produce agri commodities will                             highs achieved in 2008. Furthermore, the
continue to increase in 2012, raising farmers’                        diminishing availability of new arable land
break-even levels and creating higher floor                           will push farmers to invest more in crop input
prices. Higher production costs will limit the                        technologies such as seeds and equipment
downside price potential for most agri                                to increase production through higher yields.
commodities in 2012 as prices must persist                            This more capital-intensive per hectare cost
above break-even in order to encourage                                of growing crops against a backdrop of risk
farmers to increase production. The cost                              aversion by lenders will increase the price
to produce crops such as wheat and corn                               incentive required by farmers.
(globally weighted by production) has
roughly doubled over the past 10 years.
Nearly all of the cost components—such as
fertiliser, energy and land—are expected to
remain elevated for the 2012 season. Not
only have average global production costs
increased, but the gap between low-cost
producing countries and marginal producers
has also narrowed. For instance, the
cost advantage of producing wheat in
Russia as compared to the US fell from
USD 250/hectare to less than USD 50/hectare
in 2011. This trend of diminishing cost
advantages of countries with a higher risk
profile is likely to continue in 2012, which
will consequently limit their ability to offer
exports at a discounted price relative to
higher-cost producing countries.

We expect this higher cost structure to
persist in 2012, driven by higher energy prices
and strong farmer demand due to the high
profits achieved in 2011 (see Figure 2.18).
Fundamentals in both the energy and
fertiliser markets will remain supportive of
prices in 2012 as capacity growth is slow to
respond to demand growth. Global fertiliser
consumption is likely to have risen 2.5% to
176.4 million nutrient tonnes in 2011/12—a
second year of record high demand. Although
we do not expect fertiliser prices to reach new
highs in 2012, we do see further upside price


  Figure 2.18: Index of global corn and wheat production costs
  and prices, 2000-2011f

             400

             350

             300
  2000=100


             250

             200

             150

             100

              50
                   2000 2001 2002 2003 2004 2005 2006 2007 2008 2009 2010 2011f


               Wheat production costs         Corn production costs
               CBOT Wheat                     CBOT Corn

  Source: Rabobank, IHS Global Insight, USDA, Bloomberg, 2011
Section 3 Agri Commodity Outlooks | 21


3 Agri Commodity Outlooks

          Given the highly uncertain macro economic        We also adopt Rabobank’s global FX
          environment at present, we have decided          strategists’ forecasts as our base case, which
          to provide some scenario parameters for          shows limited moderation in the US dollar
          our price and fundamental forecasts this         expected against most currencies in 2012,
          year. These three scenarios are provided         although we factor in some upside relative
          to give some guidance on our level of            to commodity currencies.
          confidence in our forecasts and the macro-
                                                           Our base case implies little impact on
          level assumptions we have applied in
                                                           demand from an agricultural perspective,
          formulating these forecasts. Our base-case
                                                           other than perhaps a continuation of protein
          macro and FX scenarios have been applied
                                                           demand substitution—from red meat to
          to our central forecasts for each of the
                                                           poultry—in the struggling developed
          various agri commodities.
                                                           economies. This scenario also assumes very
          Base case: Stumbling along                       limited impact on agricultural demand from
          In the base case, Rabobank’s macroeconomics      emerging-market economies, with growth
          team suggests that the most likely outcome       expected to continue at trend levels, which is
          for the global economy in 2012 will be one       supportive for almost the entire agri complex.
          of very weak but positive global economic
                                                           High case: Recovery stronger and faster
          growth. We apply this as the central driver
                                                           than expected
          for the base case in our commodity price
                                                           The major assumption we factor into this
          forecasts. A mild double-dip is expected in
                                                           scenario is a quicker and stronger recovery in
          the major developed economies of Europe
                                                           global growth conditions than we currently
          and the US, but importantly for agricultural
                                                           forecast. This would require a swift and clear
          demand, only a minor softening in growth
                                                           resolution to the euro-area crisis, a reversal in
          is forecast for emerging-market economies.
                                                           investor money flows back into commodities
          A lot will no doubt depend on the timing
                                                           and higher growth economies, and a return
          and effectiveness of a resolution of the
                                                           of confidence to global markets. In this
          troubles in the euro area, which at this stage
                                                           scenario, agricultural demand would remain
          still seems some way off. We assume that a
                                                           robust in both developed and emerging-
          workable solution will be in place by Q1 2012
                                                           market economies. We expect this scenario
          and we factor in a break-up of the bloc as
                                                           would provide a stronger devaluation of the
          only a 10% to 15% probability. This scenario
                                                           US dollar as safe-haven assets are sold in
          implies a modest reversal in investor money
                                                           search of growth.
          flows, but not a complete return to the
          risk-on environment of 2010. Significant
          range-bound trading with choppy markets
          and a lack of clear flat price direction
          would be likely.
22 | Rabobank Outlook 2012—Down, But Not Out


                                           Low case: From bad to worse
                                           This is our downside scenario for world
                                           growth and demand. Here we factor in a
                                           prolonged EU debt crisis, with the debt
                                           concerns spreading to the core countries
                                           of the bloc. Contagion fears paralyse markets
                                           in Europe with knock-on effects globally
                                           and sustained risk-off environment results.
                                           Importantly for our agri complex forecasts,
                                           in this scenario we factor in a substantial
                                           contraction in emerging-market growth
                                           which would significantly crimp demand and
                                           imports of key agri commodities. Consumers
                                           would be forced to transition to lower cost
                                           sources of calories and proteins. In this
                                           scenario, a stronger US dollar environment
                                           would likely persist in 2012 as liquidity and
                                           safe-haven assets are sought by investors.
Section 3 Agri Commodity Outlooks: Wheat | 23


WHEAT

                                   Q3’11     Q4’11f       Q1’12f    Q2’12f   Q3’12f   Q4’12f                     12-month outlook from spot
CBOT wheat           USc/bu        688       610          595       630      615      595
Matif wheat          EUR/tonne     199       170          162       175      172      166

             800
             750                                                                               Low case                Base case                   High case
             700                                                                               Support from coarse     Wheat prices continue       Winter wheat
                                                                                               grain markets fades     to be supported by          abandonment and
             650                                                                               more quickly than       coarse grain prices―        yield deterioration
             600                                                                               expected                particularly in the US      exceed expectations
USc/bu


             550                                                                                                                                   as drought in the
                                                                                               At-trend exports from   Global demand               southern states of
             500                                                                               the major producers     accelerates in 2011/12,     the US intensifies
             450                                                                               drive 2012/13 global    largely offsetting the
                                                                                               stocks-to-use           fourth largest global       Drought conditions
             400                                                                                                                                   intensify, severely
                                                                                               above 33%               wheat crop on record
             350                                                                                                                                   affecting crops in
             300                                                                               Crop conditions         Poor winter wheat           the Black Sea region
                                                                                               improve in spring,      planting conditions in
                   2010                      2011                   2012                       and global yields       the US and Ukraine          US corn fundamentals
                                                                                               exceed our sub-trend,   result in sub-trend         tighten more than
                                                                                               base-case forecast      crops―but not a total       expected, forcing
            Historical           Base case          Low/high case     Spot
                                                                                                                       crop failure                prices into a
                                                                                                                                                   rationing mode

         Source: Bloomberg, Rabobank


                                                        Lower wheat prices are forecast for 2012 than            risk to our base-case forecasts come from
                                                        we have seen in 2011, however from current               production uncertainty for the 2012/13
                                                        spot levels our view is neutral. While a tight           season, with incremental wheat production
                                                        feed-grain balance sheet is expected to                  being generated in more politically volatile
                                                        provide some support to wheat prices,                    and less reliable climatic regions as discussed
                                                        particularly in the US, elsewhere we see the             in our capacity constraints section.
                                                        sharp recovery in wheat production having
                                                                                                                 Global wheat production is forecast to
                                                        a bearish impact on prices, relative to the
                                                                                                                 increase 6% to 684 million tonnes in the
                                                        levels achieved in 2011.
                                                                                                                 2011/12 season, the second largest crop on
                                                        Wheat fundamentals on their own reflect a                record. With the Northern Hemisphere crop
                                                        bearish situation from current price levels;             in the bin, the only production uncertainty
                                                        although high protein and high quality                   remaining at this stage of the wheat season
                                                        supplies are less abundant, there will be                is in the Southern Hemisphere countries of
                                                        ample supplies to meet global demand needs               Argentina and Australia. Despite the ongoing
                                                        in the season ahead. The outlook for the                 threat from a strengthening La Niña weather
                                                        2012/13 season is not so clear with winter               pattern, production in both countries does
                                                        wheat planting conditions in a number of                 not appear at risk, and harvest is now well
                                                        regions far from ideal.                                  underway. However, global wheat
                                                                                                                 consumption is forecast to reach a record
                                                        CBOT wheat prices are forecast to average
                                                                                                                 high of 676 million tonnes in 2011/12, up
                                                        14% lower YOY in 2012 as sharply higher
                                                                                                                 4% YOY—offsetting fewer supplies of feed
                                                        world production results in strong export
                                                                                                                 grains—which we expect will limit the
                                                        competition and a build-up in inventories
                                                                                                                 recovery in global wheat inventory levels to
                                                        for the 2011/12 season. Our base case for
                                                                                                                 just a 2% increase YOY. Despite the increase
                                                        wheat prices indicates a mostly neutral view
                                                                                                                 in stocks, record high global wheat demand
                                                        from current levels, following a strong sell-
                                                                                                                 is forecast to keep the stocks-to-use ratio
                                                        off in 2H 2011. We do not expect a further
                                                                                                                 unchanged from last season at 30%. It is
                                                        collapse in prices, while ample supplies
                                                                                                                 worth noting that this remains well off the
                                                        will prevent upside potential, in the absence
                                                                                                                 low of 20% in 2007/08 that triggered record
                                                        of crop failure in 2012. A weaker US dollar—
                                                                                                                 high wheat prices.
                                                        as outlined in our base-case macro
                                                        assumptions—will likely provide some                     Wheat prices in the US are expected to be
                                                        support for CBOT prices, while a lack                    more a function of the domestic corn market
                                                        of export competitiveness in the EU will                 and less affected by the global wheat
                                                        see Matif prices under pressure. We do not               dynamics than prices elsewhere. Tight
                                                        anticipate significant variation between our             corn fundamentals in the US, following
                                                        scenarios from the demand side of the ledger,            the extreme heat of summer 2011 and
                                                        with wheat demand relatively inelastic and               subsequent yield downgrades, are expected
                                                        generally a function of supply. The most                 to support US wheat prices as domestic prices
24 | Rabobank Outlook 2012—Down, But Not Out


                                                                            decouple from the global market. The wheat-                                                             USDA is forecasting a 24% YOY fall in US
                                                                            corn futures price spread—which traded at                                                               wheat exports to the second lowest level
                                                                            an unusual inverse throughout 2H 2011—                                                                  of the last five seasons, while EU exports are
                                                                            will be important in determining how much                                                               expected to drop 26%. Increased global
                                                                            wheat works into the feed ration in the                                                                 exportable supplies are the major driver
                                                                            remainder of the 2011/12 season. The                                                                    behind this shift in global demand, primarily
                                                                            premium for corn prices over wheat (spot-                                                               to the Black Sea region, where production has
                                                                            price basis) during 2H 2011 reached the                                                                 rebounded 43% and export bans have been
                                                                            highest level since 1995/96 and has                                                                     repealed following the 2010 drought. Despite
                                                                            maintained a premium for the longest period                                                             this impressive recovery in just 12 months,
                                                                            in history. While this is unusual, we expect                                                            aggregate Black Sea region production is
                                                                            that corn prices will continue to trade at a                                                            expected to fall just short of a record in
                                                                            premium to wheat for some time to come,                                                                 2011/12, although Kazakhstan is forecast to
                                                                            given the fundamental differences. The USDA                                                             produce a record crop of 21 million tonnes,
                                                                            forecasts a 22% YOY increase in US wheat                                                                a 116% YOY increase. We expect exports from
                                                                            feeding to 160 million bushels in 2011/12;                                                              the Black Sea region to reach a combined
                                                                            this estimate remains well below the levels                                                             38 million tonnes in 2011/12, the second
                                                                            reached in 2008/09.                                                                                     highest aggregate for the region on record,
                                                                                                                                                                                    and a 27% market share is forecast to be the
                                                                            Global supply of high quality and high
                                                                                                                                                                                    largest share of global trade from the region
                                                                            protein wheat is expected to remain relatively
                                                                                                                                                                                    on record.
                                                                            tight despite this season’s large global wheat
                                                                            crop. Widespread flooding in key Hard Red                                                               Wheat exports from the US and the EU are
                                                                            Spring (HRS) wheat-producing states in the                                                              forecast to represent a record low share of
                                                                            US and Canada—particularly North Dakota                                                                 world trade in the 2011/12 season. Combined
                                                                            and Saskatchewan—resulted in widespread                                                                 exports from these two key regions are
                                                                            abandonment in 2011, pressuring supplies                                                                forecast to fall from 45% last season to just
                                                                            and resulting in a strengthening in the                                                                 31% in 2011/12. Increased export competition
                                                                            protein price premium. This is reflected by                                                             this season has also been intensified by
                                                                            the sharp increase in the spread between                                                                sizeable crops from both Australia and
                                                                            the MGEX and CBOT wheat futures markets.                                                                Canada. The Australian exportable surplus
                                                                            This spread is expected to remain elevated,                                                             was recently boosted by a stock revision of
                                                                            at least during the first half of 2012, as tight                                                        around 3 million tonnes and is likely to
                                                                            supplies and the need to encourage plantings                                                            benefit from the country’s largest wheat crop
                                                                            of spring wheat against corn and even                                                                   on record at a forecast 26.2 million tonnes.
                                                                            soybeans will likely support MGEX prices.                                                               We forecast a record large national export
                                                                                                                                                                                    programme of 21 million tonnes for
                                                                             Sharply higher global wheat production is
                                                                                                                                                                                    Australia, constrained only by domestic
                                                                             forecast to result in significant export
                                                                                                                                                                                    logistics and increasing low-cost competition
                                                                             substitution from lower cost origins, but US
                                                                                                                                                                                    from the Black Sea region into South East
                                                                             wheat exports have been surprisingly resilient
                                                                                                                                                                                    Asian markets. Greater production in Western
                                                                             in the first half of the 2011/12 season. The
                                                                                                                                                                                    Australia this season should allow exports to


 Figure 3.1: US all-wheat feeding and the wheat/corn spread,                                                                               Figure 3.2: MGE vs CBOT wheat spread and HRS carryout,
 2001/02-2012/13f                                                                                                                          2001/02-2011/12f
                    300                                                                                                       7                              250                                                                                             10
                                                                                                                              6                                                                                                                               9
                    250
                                                                                                                                                             200                                                                                              8
  million bushels


                                                                                                                              5
                                                                                                                                           million bushels


                    200                                                                                                                                                                                                                                       7
                                                                                                                                  USD/bu


                                                                                                                                                                                                                                                                  USD/bu


                                                                                                                              4                              150                                                                                              6
                    150                                                                                                                                                                                                                                       5
                                                                                                                              3
                                                                                                                                                             100                                                                                              4
                    100
                                                                                                                              2                                                                                                                               3
                     50                                                                                                                                       50                                                                                              2
                                                                                                                              1
                                                                                                                                                                                                                                                              1
                      0                                                                                                       0                                0                                                                                              0
                                                                                                    10/11
                          01/02

                                  02/03

                                          03/04

                                                  04/05

                                                            05/06

                                                                    06/07

                                                                            07/08

                                                                                    08/09

                                                                                            09/10


                                                                                                            11/12f

                                                                                                                     12/13f


                                                                                                                                                                                                                                            10/11
                                                                                                                                                                   01/02

                                                                                                                                                                            02/03

                                                                                                                                                                                    03/04

                                                                                                                                                                                            04/05

                                                                                                                                                                                                    05/06

                                                                                                                                                                                                            06/07

                                                                                                                                                                                                                    07/08

                                                                                                                                                                                                                            08/09

                                                                                                                                                                                                                                    09/10


                                                                                                                                                                                                                                                    11/12f


                    All-wheat feeding                     Maximum CBOT wheat/corn spread (RHS)                                                               HRS carryout                   Max MGE/CBOT wheat spread (RHS)

 Source: Rabobank, USDA, Bloomberg, 2011                                                                                                   Source: Rabobank, USDA, Bloomberg, 2011
Section 3 Agri Commodity Outlooks: Wheat | 25


                                                         exceed last season’s levels. Canadian exports                                  conditions and sub-trend emergence levels
                                                         are forecast to jump 9.1% to 18 million tonnes                                 heighten the risk of crop losses in these
                                                         despite the growing uncertainty being                                          regions in 2012/13. This production
                                                         caused by the expected abolishment of the                                      uncertainty is likely to provide some
                                                         single exporter policy next season.                                            support to deferred contracts for both the
                                                                                                                                        Matif and CBOT markets; however, conditions
                                                         European wheat prices look set to have the
                                                                                                                                        in the Northern Hemisphere spring will be
                                                         most potential for downside due to lower-
                                                                                                                                        the key in determining yields and production.
                                                         cost export competition from the Black Sea
                                                                                                                                        Without a significant supply-side shock in
                                                         region, although a weaker euro may provide
                                                                                                                                        2012/13, we do not expect prices to return
                                                         a partial buffer early in 2012. European, and
                                                                                                                                        to highs seen in 2010 or 2011.
                                                         most notably French, wheat exports slumped
                                                         early in the 2011/12 season as Black Sea
                                                         region exports dominated market share into
                                                         the key North African importer destinations,
                                                         and we expect these exports will remain
                                                         under pressure in 2012. We expect EU wheat
                                                         stocks to climb 13% YOY, likely bounding
                                                         Matif futures prices well below the highs
                                                         of 2011 and above the lows of 2009. A range
                                                         of EUR 125/tonne to EUR 196/tonne is
                                                         expected, given the weaker fundamental
                                                         situation next season.
                                                         Our initial estimates for 2012/13 suggest it
                                                         may be difficult to replicate this season’s near-
                                                         record production next season as we model
                                                         area planted globally unchanged to slightly
                                                         lower on the basis of significantly weaker
                                                         wheat prices year-on-year and increased
                                                         competition for planted area from other row
                                                         crops. Assuming trend yield at this early stage
                                                         of the season in most regions, our initial
                                                         estimates suggest a 3% YOY decline in global
                                                         wheat production to 662 million tonnes in
                                                         the 2012/13 season—still the fourth-largest
                                                         global wheat averages on record. Adverse
                                                         winter wheat planting conditions in Ukraine,
                                                         and in the southern US due to ongoing
                                                         drought, suggest it will be difficult to achieve
                                                         trend yield this season. Additional poor crop


Figure 3.3: YOY changes in Black Sea region, US and EU exports,                               Figure 3.4: World wheat production and yield, excluding China
2008/09-2012/13f                                                                              and India, 2000/01-2012/13f
                                                                                                               550                                                                                                              2.9
                  20
                  15                                                                                           500                                                                                                              2.8
                                                                                              million tonnes


                  10                                                                                                                                                                                                            2.7
                                                                                                                                                                                                                                      tonnes/ha
million tonnes


                                                                                                               450
                      5
                                                                                                                                                                                                                                2.6
                      0
                                                                                                               400
                      -5                                                                                                                                                                                                        2.5

                  -10                                                                                          350                                                                                                              2.4
                  -15
                                                                                                               300                                                                                                              2.3
                  -20
                                                                                                                                                                                                      10/11
                                                                                                                     00/01

                                                                                                                             01/02

                                                                                                                                     02/03

                                                                                                                                             03/04

                                                                                                                                                     04/05

                                                                                                                                                             05/06

                                                                                                                                                                      06/07

                                                                                                                                                                              07/08

                                                                                                                                                                                      08/09

                                                                                                                                                                                              09/10


                                                                                                                                                                                                              11/12f

                                                                                                                                                                                                                       12/13f


                           08/09      09/10            10/11      11/12f     12/13f

                                             Black Sea region                                                  Global production excl. China, India, US                               Global yield excl. China, India (RHS)

                 US        EU      Ukraine          Russia      Kazakhstan                                     US production                                                          Trend line

Source: Rabobank, USDA, 2011                                                                  Source: Rabobank, USDA, 2011
26 | Rabobank Outlook 2012—Down, But Not Out


CORN

CBOT               Q2’11     Q3’11         Q4’11f      Q1’12f       Q2’12f       Q3’12f   Q4’12f                      12-month outlook from spot
USc/bu             732       696           620         610          645          630      610


             800
             750                                                                                   Low case                 Base case                High case
             700                                                                                   Corn plantings           Further US corn          New crop US corn
             650                                                                                   exceed 95 million        yield reductions         acreage is less than
             600                                                                                   acres in the US, with    force increasing         93 million acres and
USc/bu


                                                                                                   prices falling to USD    reliance on volatile     yields disappoint
             550                                                                                   5.00/bushel on record    emerging-market
             500                                                                                   crop expectations        exports                  Policy changes
                                                                                                                                                     restrict Ukrainian/
             450                                                                                   Importer demand is       Ethanol production       Argentine corn
             400                                                                                   weaker amid              hits record levels,      exports
             350                                                                                   economic downturn;       despite blenders’
                                                                                                   USD rally hinders        credit lapsing at        High oil prices and
             300                                                                                                                                     low USD, drive US
                   2010                     2011                     2012                          exports                  the end of 2011
                                                                                                                                                     ethanol demand to
                                                                                                   Weak La Niña helps       China imports            5.2 billion bushels
                                                                                                   South American corn      4 million tonnes of US
            Historical         Base case            Low/high case         Spot                     exports hit 34 million   corn despite record
                                                                                                   tonnes                   domestic crop


         Source: Bloomberg, Rabobank


                                                        Rabobank forecasts lower year-on-year CBOT                    see corn prices test USD 7.00/bushel during
                                                        corn prices in 2012. However, we do expect                    Q2 2012.
                                                        a seasonal uptick in prices, averaging
                                                                                                                      Rabobank forecasts continued reductions
                                                        USD 6.45/bushel in Q2 2012 before easing to
                                                                                                                      to the USDA’s corn ending stocks projections
                                                        USD 6.10/bushel in Q4 2012. We expect this
                                                                                                                      as use creeps higher on strong ethanol
                                                        mid-to-late year fall will result from 2012/13
                                                                                                                      margins and relatively strong exports, while
                                                        acreage expectations being ratcheted higher
                                                                                                                      simultaneously, there is also a significant risk
                                                        in the US. Our forecast 2011/12 US corn
                                                                                                                      of further yield downgrades in the final 2011
                                                        ending stocks-to-use ratio would be the
                                                                                                                      crop report due in January 2012. In broad
                                                        lowest on record and provide strong price
                                                                                                                      terms, most categories of US demand have
                                                        support in the near term.
                                                                                                                      been strong or strengthening since the start
                                                        Q2/Q3 2012 corn prices will prove difficult to                of the 2011/12 marketing year in August. We
                                                        forecast as the US corn complex moves from                    expect that to continue, with total US corn
                                                        a strong deficit to a moderate surplus, with                  use in 2011/12 forecast to reach 12.8 billion
                                                        prices highly path-dependent as the market                    bushels, a 1.9% decrease from 2010/11
                                                        attempts to guide 2012/13 acreage in the US.                  levels. Key risks to our forecast include the
                                                        Although a long way out, we see our corn                      possibility of negligible La Niña effects and
                                                        price forecasts likely to be more a function                  subsequently strong South American exports,
                                                        of South American weather and supply                          as we currently forecast a lower export
                                                        expectations for the US 2012 crop than                        outcome than the USDA for the continent.
                                                        economic outcomes. Ethanol production                         Fundamentals show oil prices to be a key
                                                        responses to oil price changes remain our                     driver of future corn prices, as we foresee
                                                        main mechanism to bring economic                              greater corn demand from ethanol
                                                        variability into the corn complex.                            production than the USDA for 2011/12
                                                                                                                      and further increases in 2012/13. Margin
                                                        Our low case would also involve the winding
                                                                                                                      contractions from falling oil prices are a
                                                        back of the increases in protein consumption
                                                                                                                      key risk to our forecast.
                                                        we have assumed for the developing world.
                                                        If weaker-than-expected growth outcomes                       The ongoing role of speculative/managed
                                                        are realised in the developed world, as                       money in the agri complex, and in corn
                                                        assumed in our low case, we could see oil                     markets more specifically, will play an
                                                        prices dropping below USD 100/barrel                          important role in price discovery for corn in
                                                        and a significant reduction in corn prices                    the coming year. Current net long positions
                                                        towards USD 5.00/bushel as ethanol                            of managed money are near the lows set in
                                                        demand is reduced. Under our high case,                       July 2010, and we expect it to be difficult for
                                                        where the global economy experiences                          significant liquidations in speculative net
                                                        resurgent growth, we would see higher oil                     long positions to occur from these levels as
                                                        prices, strengthening demand and rebuilding                   structural longs remain. Analysis of origin-
                                                        of stocks. These macro conditions would                       buying suggests a price floor of approximately
Section 3 Agri Commodity Outlooks: Corn | 27


                                                                              USD 6.00 will hold until 2012/13 crop acreage                                                reach 5.2 billion bushels as corn acreage is
                                                                              and conditions are well established.                                                         expanded at the expense of soybeans, with
                                                                                                                                                                           our forecast near-term futures price ratio
                                                                              Further out the curve, our downward bias
                                                                                                                                                                           between the two commodities continuing
                                                                              for prices strengthens with the 2012/13
                                                                                                                                                                           to favour corn. Given unchanged oil prices,
                                                                              marketing year likely to produce the largest
                                                                                                                                                                           ethanol production should remain near
                                                                              global corn crop on record. Rabobank
                                                                                                                                                                           capacity and meet our forecast, as corn
                                                                              projects that an equal record of 93.5 million
                                                                                                                                                                           remains in the USD 6.00/bushel to
                                                                              acres will be planted in the US, further
                                                                                                                                                                           USD 7.00/bushel range. Our base-case
                                                                              displacing soybeans as producers capitalise
                                                                                                                                                                           economic growth assumptions would,
                                                                              on strong price incentives and increase corn
                                                                                                                                                                           without increased disturbance in the
                                                                              acreage in marginal production regions.
                                                                                                                                                                           Middle East, see Brent Crude oil prices stay
                                                                              Our state-by-state models suggest that the                                                   in the USD 100/barrel to USD 110/barrel
                                                                              majority of the 1.7 million planted acreage                                                  range during 2012.
                                                                              increase will be from nontraditional
                                                                                                                                                                           US corn export sales, with a strong pace
                                                                              producer states.
                                                                                                                                                                           set for 2011/12, should be supported by a
                                                                              We forecast an additional 850,000 acres                                                      weakening US dollar. We forecast exports
                                                                              of corn to be planted in North Dakota as it                                                  to be 1.62 billion bushels, 25 million bushels
                                                                              recovers from the severe flooding of 2011.                                                   ahead of current USDA expectations. There
                                                                              There is significant income risk as farmers                                                  remains a risk that sales are cancelled as
                                                                              planting corn for the first time receive crop                                                buyers switch to cheaper origins once crops
                                                                              insurance returns in line with county yields                                                 are more certain. Structural factors such
                                                                              rather than proven yields. This uncertainty,                                                 as China’s ability to import only US corn
                                                                              along with resilient spring wheat prices,                                                    as well as geographical advantages in
                                                                              caps our expectation of increased                                                            exporting to Mexico, where a drought is
                                                                              substitution in North Dakota.                                                                forecast to have reduced the 2011/12
                                                                                                                                                                           expected crop by 3.5 million tonnes from
                                                                              Although a long way off, we forecast US
                                                                                                                                                                           prior USDA estimates, should support
                                                                              yields of 154 bushels/acre based on our
                                                                                                                                                                           export sales in Q1 2012.
                                                                              state-by-state model. This figure was
                                                                              impacted by the increased acreage from                                                       Rabobank forecasts that the USDA will
                                                                              marginal states. Following this, our                                                         have to increase feed demand to 4.7 billion
                                                                              production forecast is 13.25 billion bushels,                                                bushels from the current 4.6 billion bushel
                                                                              a 7.9% increase on our 2011/12 forecast.                                                     estimate. The November WASDE report
                                                                                                                                                                           stated that the USDA has underestimated
                                                                              We forecast a record 5.1 billion bushels of
                                                                                                                                                                           US domestic corn demand in 20 out of
                                                                              corn to be used in ethanol production
                                                                                                                                                                           30 years of analysis, which Rabobank
                                                                              during the 2011/12 marketing year as
                                                                                                                                                                           considers worth highlighting. The average
                                                                              distillers operate on strong margins at full
                                                                                                                                                                           error is 215 million bushels. This supports
                                                                              pace despite the risk caused by the imminent
                                                                                                                                                                           our view that domestic use estimates will
                                                                              withdrawal of the blender’s credit. Corn use
                                                                                                                                                                           be increased in the new year. We forecast
                                                                              for ethanol production in 2012/13 is likely to
                                                                                                                                                                           4.5 billion bushels of US feed demand in


Figure 3.5: US corn planted area and yield, 2000/01-2012/13f                                                                                         Figure 3.6: Matrix of estimated ethanol production profitability
                                                                                                                                                     (in USD/gallon)
                100                                                                                                             170
                                                                                                                                                     Brent crude price
                                                                                                                                                                                          80          90        100        110       120
                 95                                                                                                             160                  (USD/barrel)
                                                                                                                                                     Ethanol price1
                                                                                                                                                                                         2.05        2.28      2.52       2.76       2.99
                                                                                                                                      bushels/acre
million acres


                 90                                                                                                             150                  (USD/gallon)

                 85                                                                                                             140                                           5.5        0.03        0.27       0.50       0.74      0.98
                 80                                                                                                             130
                                                                                                                                                                              6.0        -0.15       0.08       0.32       0.56      0.79
                 75                                                                                                             120                  Corn price
                                                                                                                                                     (USD/bushel)
                                                                                                                                                                              6.5        -0.34      -0.10       0.13       0.37      0.61
                 70                                                                                                             110
                      00/01


                                                                                                      10/11
                              01/02
                                      02/03
                                              03/04
                                                      04/05
                                                              05/06
                                                                      06/07
                                                                              07/08
                                                                                      08/09
                                                                                              09/10


                                                                                                              11/12f
                                                                                                                       12/13f


                                                                                                                                                                              7.0        -0.52      -0.29      -0.05       0.19      0.42
                                                                                                                                                     1
                                                                                                                                                      RBOB gasoline/Brent crude relationship based upon OLS regression
                                                                                                                                                     Figure assumes a DDG price of USD 220/tonne and an RBOB gasoline/ethanol spread of
                                                                                                                                                     USD 0.10/gallon.
                 Area planted                  Yield (RHS)

Source: Rabobank, USDA, 2011                                                                                                                         Source: Bloomberg, USDA, Rabobank
28 | Rabobank Outlook 2012—Down, But Not Out


                                           2012/13 as DDG substitution increases and                                 either our or the USDA’s forecast, there
                                           the cattle herd shrinks.                                                  will be some form of government
                                                                                                                     intervention. We see several likely
                                           Our global production outlook for corn in
                                                                                                                     catalysts that could bring further export
                                           2011/12 is relatively large from a historical
                                                                                                                     limitations into effect:
                                           perspective, with Brazil, Ukraine and
                                           Argentina helping to moderate weakened                                      • The government decides that domestic
                                           expectations for the US crop, albeit with                                     prices are too high and acts to support
                                           greater downside risk than seen in previous                                   domestic consumption,
                                           years. Although record crops are expected
                                                                                                                       • The current poor outlook for the 2012/13
                                           in many countries, world trade (excluding
                                                                                                                         wheat crop deteriorates further and
                                           the US) during the remainder of the
                                                                                                                         resulting export bans cover the entire
                                           2011/12 marketing year is likely to see
                                                                                                                         grains complex,
                                           supply availability skewed to the downside
                                           as political considerations operate in                                      • No IMF funding deal is struck and the
                                           conjunction with uncertain environmental                                      Ukrainian government sees the record
                                           outcomes. In addition, we see potential for                                   high price for exports and re-introduces
                                           yields in Argentina to be reduced by an                                       tariffs to assuage cash flow issues.
                                           adverse La Niña weather pattern.
                                                                                                                     Rabobank forecasts 2012/13 will see
                                           We expect 27.5 million tonnes of corn                                     global corn production of 885 million
                                           to be exported from South America in                                      tonnes, a 3.4% increase on our 2011/12
                                           2011/12. Argentina continues to operate                                   forecast and the highest on record. This
                                           in a pressured economic environment with                                  forecast builds on our greatly increased
                                           persistently high inflation and persistent                                acreage figure for the US and sees an
                                           government intervention in the foreign                                    extra 3 million tonnes in exports from
                                           exchange market. Further economic stress                                  South America as soybeans are displaced
                                           may promote more widespread industrial                                    in a situation analogous to that in the US.
                                           action, causing substantial stress to a world                             Ukrainian production estimates are
                                           corn complex which relies on strong                                       tempered by strong incentives to plant
                                           Argentine exports. We will monitor this                                   more barley and sunflower and
                                           closely and adjust our forecasts as necessary.                            consequently, we have reduced our export
                                                                                                                     forecast to 9.3 million tonnes for 2012/13.
                                           In a year of a record corn production,
                                                                                                                     We expect global corn trade to be resurgent
                                           Ukrainian exports remain uncertain with the
                                                                                                                     as China imports a record 7 million tonnes
                                           USDA currently expecting 12 million tonnes
                                                                                                                     and the world economy pulls itself to its
                                           to be exported in the 2011/12 marketing year.
                                                                                                                     feet. At this point, we forecast ending
                                           Our analysis suggests 11 million tonnes will
                                                                                                                     stocks to be 123.8 million tonnes with
                                           be more realistic, with 9.5 million tonnes
                                                                                                                     a stocks-to-use ratio of 12.6% relieving
                                           our low case, which would put significant
                                                                                                                     some of the pressure we forecast ahead
                                           upward pressure on corn prices. Given the
                                                                                                                     for 2011/12.
                                           need to raise the government-mandated
                                           export cap of 10.5 million tonnes to meet


                                               Figure 3.7: Global corn exports, US vs ROW, 1972/73-2012/13f

                                                                120                                                        60

                                                                100                                                        50
                                               million tonnes


                                                                80
                                                                                                                           40
                                                                                                                                percent


                                                                60
                                                                                                                           30
                                                                40
                                                                                                                           20
                                                                20

                                                                 0                                                         10
                                                                       80/81


                                                                       90/91


                                                                       00/01


                                                                       10/11
                                                                       72/73
                                                                       74/75
                                                                       76/77
                                                                       78/79

                                                                       82/83
                                                                       84/85
                                                                       86/87
                                                                       88/89

                                                                       92/93
                                                                       94/95
                                                                       96/97
                                                                       98/99

                                                                       02/03
                                                                       04/05
                                                                       06/07
                                                                       08/09

                                                                      12/13f


                                                                 US   ROW     Rest of world share of exports (ROW)

                                               Source: Rabobank, USDA, 2011
Section 3 Agri Commodity Outlooks: Soybeans | 29


SOYBEANS

CBOT                         Q3’11         Q4’11f     Q1’12f        Q2’12f     Q3’12f   Q4’12f                     12-month outlook from spot
Soybeans           USc/bu    1,358         1,165      1,178         1,226      1,260    1,251
Soy oil            USc/lb    55.8          49.4       48.7          50.2       49.1     47.5
Soymeal            USD/ton   230           300        310           290        330      335

           1,400                                                                                 Low case                Base case                  High case
                                                                                                 Record large US corn    US soybean planted         China’s imports
           1,300                                                                                 harvest results in      area declines to a         grow 15% or more
                                                                                                 our low-case corn       5-year low of less         YOY and exceed
                                                                                                 price level of          than 74 million acres      60 million tonnes
           1,200
USc/bu


                                                                                                 USD 5.00/bushel         in 2012/13
                                                                                                                                                    South American
           1,100                                                                                 Chinese imports fall    The South American         production below
                                                                                                 below the USDA’s        exportable surplus         133 million tonnes
                                                                                                 56.5 million tonne      is record large at
           1,000                                                                                                                                    USD 1/gallon
                                                                                                 forecast in 2011/12     56 million tonnes
                                                                                                                         in 2011/12                 biodiesel credit
             900                                                                                 US soybean 2012/13                                 extended in 2012
                   2010                     2011                     2012                        planted area remains    Chinese import
                                                                                                 flat YOY or rises       growth accelerates
            Historical         Base case            Low/high case       Spot
                                                                                                 above 75 million        12% YOY in 2011/12 to
                                                                                                 acres                   58.5 million tonnes

         Source: Bloomberg, Rabobank


                                                        Soybean prices in 2012 are poised to fall from             Based on our analysis of the corn balance
                                                        the levels seen in 2011 but are likely to remain           sheet, we forecast corn prices will continue
                                                        historically elevated even though slowing                  to outperform soybean prices during the
                                                        global growth threatens to temper demand.                  beginning of 2012 as corn must win the US
                                                        Our base case shows significant upside for                 battle for acres. We expect soybean planted
                                                        deferred prices from spot, as soybeans                     area to lose more than 1 million acres to corn
                                                        strengthen relative to corn in 2H 2012. Based              and decline to 73.9 million acres in 2012/13—
                                                        on our low case, we view soybeans as the                   the smallest area planted since 2007/08.
                                                        most defensive commodity in the grain                      A rebound in soybean yields to a trend of
                                                        and oilseed complex, given their relative                  44 bushels/acre would mitigate the drop in
                                                        underperformance in 2011 and the large                     planted area, resulting in a 5% YOY increase in
                                                        emerging-market demand profile. However,                   production to 3.21 billion bushels. This would
                                                        with our forecast for lower corn prices                    cause the market to be even more sensitive
                                                        in 2012, we expect the spillover bullish                   to adverse weather developments as a result
                                                        sentiment which was a key driver for                       of yields playing such a pivotal role in
                                                        soybean prices during 2011 to fade.                        determining whether or not US soybean
                                                                                                                   production will increase in 2012/13 or decline
                                                        Yet a floor price will be set based on South
                                                                                                                   for a third consecutive year. This 5% YOY
                                                        America’s production costs and Chinese
                                                                                                                   increase in US production would allow US
                                                        import demand, as US farmers plant a record
                                                                                                                   exports to increase by less than 5 million
                                                        large corn acreage in 2012/13 largely at the
                                                                                                                   tonnes—far below the average annual pace
                                                        expense of soybean area. We expect this will
                                                                                                                   needed to reach the growing Chinese import
                                                        cause the US to concede its position as the
                                                                                                                   demand. This will require South America to
                                                        world’s largest soybean exporter to Brazil for
                                                                                                                   increase production in 2012/13 by at least
                                                        a second consecutive year and will shift price
                                                                                                                   2 million tonnes in order to prevent a further
                                                        seasonality to reflect South America’s crop
                                                                                                                   drawdown in global soybean ending stocks.
                                                        calendar. Consequently, we believe the
                                                        soybean-to-corn price ratio will reverse from              The ability of global soybean production
                                                        historically low levels as early as Q2 2012—               to grow in 2012/13 is likely to be affected
                                                        albeit at lower absolute year-on-year values.              by South American capacity constraints.
                                                        This lower price outlook for soybeans in 2012              Favourable weather and increased soybean
                                                        will be limited, given the supply constraints              plantings in Brazil are supportive of record
                                                        inherent in soybeans’ expansion into new                   high production and exports available from
                                                        territories which have a higher break-even                 South America for 2011/12. We forecast the
                                                        price floor and higher political risks. Downside           combined soybean production of Brazil,
                                                        price risk will also be mitigated by the                   Argentina, and Paraguay to reach a record
                                                        relatively inelastic biodiesel demand for                  high of 134 million tonnes in 2011/12, further
                                                        soy oil and by China’s declining soybean                   solidifying the region’s importance in meeting
                                                        production, which will be supportive of                    global demand. However, there are signs that
                                                        its need to increase imports year-on-year.                 the pace of land expansion is slowing in Brazil
30 | Rabobank Outlook 2012—Down, But Not Out


                                                                                        and Argentina, creating a biannual battle for                                                                                   appreciation and higher input costs are
                                                                                        acreage. From 2000/01 to 2007/08, the                                                                                           reducing the cost advantages of expanding
                                                                                        combined harvested soybean area in these                                                                                        soybean production in Brazil. Since we expect
                                                                                        three countries increased by an average of                                                                                      the Brazilian real to remain volatile and
                                                                                        7% (even when accounting for a year-on-year                                                                                     stronger in 2012, the cost advantage of
                                                                                        decline as a result of the global financial                                                                                     buying inputs in domestic currency while
                                                                                        crisis). Since then, harvested soybean area                                                                                     selling crops in US dollars is diminishing.
                                                                                        has only risen by an average of 4%. As farmers                                                                                  Consequently, incentivising Brazilian farmers
                                                                                        slow the pace of their land expansion, the                                                                                      to undertake further acreage expansion will
                                                                                        battle for acres between major row crops in                                                                                     require a higher CBOT soybean price. For
                                                                                        Brazil, which has prevailed for many years in                                                                                   instance, in the state of Mato Grosso, where
                                                                                        the US, is clearly becoming a biannual event.                                                                                   soybean production growth increased the
                                                                                        For instance, in the Brazilian states that                                                                                      most in 2011/12, the cost of production for
                                                                                        typically produce the highest soybean                                                                                           soybeans was less than USD 9/bushel. When
                                                                                        yields (such as Paraná), corn plantings have                                                                                    transportation to port is included, costs
                                                                                        increased at the expense of soybeans in                                                                                         increase to USD 11/bushel. We expect this
                                                                                        2011/12. Although the increase in corn                                                                                          break-even cost to increase in 2012, which will
                                                                                        plantings has not been enough to cause                                                                                          give CBOT soybean prices limited downside
                                                                                        total soybean area to decline in year-on-year                                                                                   below the USD 11/bushel, based on our
                                                                                        terms—in fact we expect the Brazilian                                                                                           forecast for the Brazilian real to remain strong
                                                                                        soybean harvested area will reach a record                                                                                      during 1H 2012 before declining in 2H 2012.
                                                                                        high in 2011/12—it does signify that the
                                                                                                                                                                                                                        The demand profile for soy oil may potentially
                                                                                        capacity to augment soybean supplies is
                                                                                                                                                                                                                        diverge from soymeal in 2012 as the growth
                                                                                        becoming increasingly constrained. As a
                                                                                                                                                                                                                        in demand for biodiesel and emerging-
                                                                                        result, a higher floor price will be needed
                                                                                                                                                                                                                        market food consumption of soy oil outpaces
                                                                                        to incentivise the increased production
                                                                                                                                                                                                                        the growth in feed demand for soymeal. We
                                                                                        necessary to replenish the global soybean
                                                                                                                                                                                                                        believe soy oil prices are least exposed to the
                                                                                        balance sheet in 2012/13.
                                                                                                                                                                                                                        potential economic slowdown in 2012 due to
                                                                                        We believe that in order to offer South                                                                                         their smaller exposure to EU and US markets,
                                                                                        American farmers the profit margins required                                                                                    which account for one-quarter of total
                                                                                        to further expand soybean planted area in                                                                                       demand as opposed to their more than
                                                                                        2012/13, CBOT soybean prices must remain                                                                                        one-third share of demand for soymeal.
                                                                                        above USD 10/bushel in Q3 2012—which is                                                                                         This exposure can be further reduced to
                                                                                        roughly the break-even cost needed to bring                                                                                     18% if the relatively inelastic demand of
                                                                                        on new soybean area in Brazil. Although Brazil                                                                                  biodiesel is excluded.
                                                                                        is positioned as a more cost-efficient soybean
                                                                                                                                                                                                                        In our low case, in which economic growth
                                                                                        producer (particularly because their yields
                                                                                                                                                                                                                        in developed economies significantly
                                                                                        have been larger than those of US farmers
                                                                                                                                                                                                                        underperforms that in emerging markets, soy
                                                                                        for the past two seasons), this gap is quickly
                                                                                                                                                                                                                        oil prices would perform comparatively well,
                                                                                        closing. Rising land values, currency
                                                                                                                                                                                                                        given their large exposure to emerging


  Figure 3.8: US soybean area planted and production,                                                                                                                      Figure 3.9: Corn and soybean area harvested in Brazil and
  1998/99-2012/13f                                                                                                                                                         Argentina and ratio of soybean/corn area harvested,
                                                                                                                                                                           1987/88-2011/12f
                  80                                                                                                                               3.5
                                                                                                                                                                                              70                                                                                                              3.0

                                                                                                                                                   3.2                                        60
                  75                                                                                                                                                                                                                                                                                          2.5
                                                                                                                                                                           million hectares
                                                                                                                                                         billion bushels


                                                                                                                                                                                              50
  million acres


                                                                                                                                                   2.9
                                                                                                                                                                                              40                                                                                                              2.0
                  70
                                                                                                                                                                                                                                                                                                                    ratio


                                                                                                                                                   2.6                                        30                                                                                                              1.5
                  65                                                                                                                                                                          20
                                                                                                                                                   2.3
                                                                                                                                                                                                                                                                                                              1.0
                                                                                                                                                                                              10
                  60                                                                                                                               2.0
                                                                                                                                                                                               0                                                                                                              0.5
                                        00/01
                        98/99
                                99/00


                                                01/02
                                                        02/03
                                                                03/04
                                                                        04/05
                                                                                05/06
                                                                                         06/07
                                                                                                 07/08
                                                                                                         08/09
                                                                                                                 09/10
                                                                                                                         10/11
                                                                                                                                 11/12f
                                                                                                                                          12/13f


                                                                                                                                                                                                     87/88

                                                                                                                                                                                                             89/90
                                                                                                                                                                                                                     91/92

                                                                                                                                                                                                                             93/94
                                                                                                                                                                                                                                     95/96

                                                                                                                                                                                                                                             97/98
                                                                                                                                                                                                                                                     99/00

                                                                                                                                                                                                                                                             01/02

                                                                                                                                                                                                                                                                     03/04
                                                                                                                                                                                                                                                                             05/06

                                                                                                                                                                                                                                                                                     07/08
                                                                                                                                                                                                                                                                                             09/10
                                                                                                                                                                                                                                                                                                     11/12f


                   Area planted                         Production (RHS)                                                                                                                      Corn            Soybeans                       Ratio soybean to corn area (RHS)

  Source: Rabobank, USDA, 2011                                                                                                                                             Source: Rabobank, USDA, 2011
Section 3 Agri Commodity Outlooks: Soybeans | 31


                                                                          market economies. US soymeal demand is                                      consumption of animal protein. Food inflation
                                                                          forecast to fall for a fifth consecutive year                               during 2011 has not reached the same levels
                                                                          to the lowest level since 1999/2000 due to                                  seen in 2007 (in fact it has started to decline
                                                                          relatively flat year-on-year grain-consuming                                at the end of 2011) but remains historically
                                                                          animal units and the increased availability of                              elevated. China’s food inflation has largely
                                                                          DDGs. The volume of DDGs which substitutes                                  been driven by pork prices, which reached
                                                                          total soymeal feed demand is estimated to                                   record highs in 2011 as disease reduced
                                                                          be 20% to 30%. This implies that animal                                     availability. This, in turn, gave farmers a price
                                                                          feed demand for US soymeal could have                                       incentive to increase pork inventories, which
                                                                          potentially reached a record high in 2010/11                                we view as supportive of China’s soybean
                                                                          were it not for the displacement by DDGs in                                 import demand in 2012. The outlook for soy
                                                                          the feed ration. With our forecast for another                              oil demand growth is also uncertain for 2012
                                                                          record-breaking year of ethanol production                                  as crush margins have remained negative
                                                                          in 2011/12, soymeal demand will continue                                    despite the government’s removal of price
                                                                          to decline.                                                                 caps. Yet, we expect China’s year-on-year
                                                                                                                                                      decline in soybean production in 2011/12 will
                                                                          The degree to which the soy oil share
                                                                                                                                                      continue to be supportive of soybean import
                                                                          increases hinges largely on the outlook
                                                                                                                                                      demand. The uncertainty lies in the extent to
                                                                          for biodiesel production (primarily in the
                                                                                                                                                      which China’s demand will increase, which
                                                                          US) with significant downside, given the
                                                                                                                                                      will largely depend on how the global
                                                                          likelihood that the USD 1/gallon tax incentive
                                                                                                                                                      economic situation unfolds.
                                                                          will expire at the end of 2011, as well as
                                                                          upside risk if energy prices rise significantly in
                                                                          2012. US biodiesel producers achieved record
                                                                          high profit margins in 2011, which are likely
                                                                          to deteriorate in 2012, causing year-on-year
                                                                          production decline to be the third highest
                                                                          on record. This will be more than offset by an
                                                                          increase in production in Brazil and Argentina,
                                                                          where mandates have been increased to
                                                                          B5 and B7, respectively. Brazil may potentially
                                                                          increase their blend requirements to B7 on
                                                                          the way to B20 by 2020.

                                                                          The largest downside price risk to soybeans
                                                                          will be the potential for China’s demand
                                                                          growth for soybeans to slow or decrease in
                                                                          2012 should the global economic situation
                                                                          deteriorate, as in our low case, and threaten a
                                                                          slowdown to China’s economy. In 2007, when
                                                                          China’s food inflation skyrocketed, consumers
                                                                          responded by decreasing their per capita


Figure 3.10: Combined US, Brazil and Argentina soy oil exports                                                               Figure 3.11: CBOT soy oil share of crush margin,
and industrial domestic use, 2001/02-2011/12f                                                                                Jan 2002-Nov 2011
                 14
                                                                                                                                       50
                 12
                                                                                                                                       45
                 10
million tonnes


                                                                                                                             percent


                  8                                                                                                                    40

                  6
                                                                                                                                       35
                  4
                                                                                                                                       30
                  2

                  0                                                                                                                    25
                       00/01

                               01/02

                                          02/03

                                                  03/04

                                                          04/05

                                                                  05/06

                                                                           06/07

                                                                                   07/08

                                                                                           08/09

                                                                                                   09/10

                                                                                                           10/11f

                                                                                                                    11/12f


                                                                                                                                        2002


                                                                                                                                               2004

                                                                                                                                                        2005

                                                                                                                                                                 2006

                                                                                                                                                                             2007

                                                                                                                                                                                     2008

                                                                                                                                                                                             2009

                                                                                                                                                                                                     2010

                                                                                                                                                                                                             2011


                 Exports               Industrial domestic use

Source: Rabobank, USDA, 2011                                                                                                 Source: Rabobank, Bloomberg, 2011
32 | Rabobank Outlook 2012—Down, But Not Out


PALM OIL

MDE-BURSA              Q2’11     Q3’11        Q4’11f     Q1’12f        Q2’12f         Q3’12f   Q4’12f                      12-month outlook from spot
MYR/tonne              3,365     3,100        3,000      2,800         2,900          3,000    3,100


              4,000
                                                                                                        Low case                 Base case              High case
                                                                                                        Exports of rapeseed      Palm oil production    La Niña strengthens
              3,500                                                                                     oil and soy oil          grows 5% YOY in        with a negative
MYR/tonne


                                                                                                        increase in 2011/12      2011/12 to more than   impact to palm oil
                                                                                                        as opposed to our        50 million tonnes      yields in Malaysia
              3,000                                                                                     forecast for a decline                          and Indonesia
                                                                                                                                 Global soy oil
                                                                                                        Weak economic            exports fall to 9.3    Oil prices rise and
              2,500
                                                                                                        growth in China and      million tonnes―the     spur increased
                                                                                                        India causes their       largest YOY decline    biodiesel production
                                                                                                        import demand to         since 2008/09          in the EU/US
                                                                                                        decline YOY
              2,000                                                                                                              Global palm oil        Global soybean
                      2010                     2011                     2012                            Energy prices fall       stocks-to-use          production does
                                                                                                        and reduce biodiesel     increase YOY in        not increase 2% as
                                                                                                        demand to less than      2011/12 to 11.4%       forecast for 2012/13
               Historical         Base case            Low/high case           Spot                     12%-13% of global        but remain
                                                                                                        vegetable oils           historically low


            Source: Bloomberg, Rabobank


                                                         Global production of palm oil is poised for                       alternative vegetable oils is forecast to decline
                                                         another year of growth in 2011/12, surpassing                     in 2011/12, which will benefit palm oil as end
                                                         50 million tonnes for the first time in history,                  users seek lower cost alternatives to soy oil
                                                         allowing prices to ease and spurring demand.                      and rapeseed oil. Although it is likely that
                                                         While in isolation this would signify a bearish                   prices will be pressured in the short term, we
                                                         price reaction, declining availability of                         expect the seasonal slowdown in palm oil
                                                         alternative vegetable oils will continue to                       production during 1H 2012 to lead to a price
                                                         create an elevated increase in global demand                      rebound in 2H 2012.
                                                         for palm oil and prevent a significant build-up
                                                                                                                           The biggest downside risk to our price
                                                         of ending stocks. We expect the increase in
                                                                                                                           forecast for palm oil in 2012 is the political risk
                                                         palm oil production to be largely weighted at
                                                                                                                           surrounding biodiesel production, which
                                                         the beginning of the marketing year, driven
                                                                                                                           accounts for approximately 12% to 13% of
                                                         by harvest seasonality and the potential
                                                                                                                           global vegetable oil consumption. Our low
                                                         negative impact of La Niña.
                                                                                                                           case prices assume a curtailment in mandates
                                                         Malaysia’s palm oil production—which                              or financial incentives for biodiesel
                                                         constitutes 44% of global exports—has                             production in major soy oil exporting
                                                         outpaced its 12-month moving average since                        countries in 2012, which would increase
                                                         March 2011, rising to the second-highest                          exportable surpluses of commodities such
                                                         monthly level on record in October at                             as soy oil and rapeseed oil. On the other hand,
                                                         1.91 million tonnes. At the same time, stocks                     as vegetable oils have become increasingly
                                                         rose to the fourth-highest level on record.                       correlated to oil prices in recent years, this
                                                         Going forward, we expect that production                          link to energy markets also gives potential
                                                         seasonality and detrimental weather could                         for price upside in 2012 in our high case.
                                                         potentially cause monthly output to fall
                                                                                                                           Global palm oil demand is largely driven by
                                                         nearly 20% below the 12-month moving
                                                                                                                           consumption in China and India where we
                                                         average. This will be partially offset by the
                                                                                                                           see a relatively smaller risk of economic
                                                         elevated stock levels, but a larger-than-
                                                                                                                           slowdown in 2012. China’s palm oil
                                                         expected export pace or La Niña could give
                                                                                                                           consumption has only shown year-on-year
                                                         further upside potential to our price forecasts.
                                                                                                                           declines in two of the past 15 years, with last
                                                         Our base case prices factor in continued                          season marking the largest year-on-year
                                                         strong global demand growth for vegetable                         decline over this time period. It also marked
                                                         oils, which will be supportive of palm oil                        the slowest year-on-year percentage growth
                                                         prices in 2012, driven by increased biodiesel                     in China’s total vegetable oil consumption in
                                                         production, Chinese demand and weather                            15 years, which we expect will result in a
                                                         risks. Across the oilseed complex, we expect                      rebound in 2011/12. Food-price inflation has
                                                         the oil share to perform particularly well in                     begun to decline in China, and crush margins
                                                         2012 as the demand profile for oils versus                        have become less negative. As in past years of
                                                         meals diverges further. The output of                             reduced demand growth, we expect this will
Section 3 Agri Commodity Outlooks: Palm oil | 33


Figure 3.12: Monthly Malaysia palm oil production and 12-month                                                                Figure 3.13: Palm oil and Brent crude oil prices and correlation,
moving average, 2000-2011                                                                                                     2001-2011

                  2.0                                                                                                                          0.5                                                                                                                                                    160
                                                                                                                                               0.4                                                                                                                                                    140
                  1.8
                                                                                                                                               0.3                                                                                                                                                    120
                  1.6
                                                                                                                                               0.2                                                                                                                                                    100
million tonnes


                                                                                                                               correlation
                  1.4


                                                                                                                                                                                                                                                                                                            prices
                                                                                                                                               0.1                                                                                                                                                     80
                  1.2
                                                                                                                                               0.0                                                                                                                                                     60
                  1.0                                                                                                                         -0.1                                                                                                                                                     40
                  0.8                                                                                                                         -0.2                                                                                                                                                     20
                  0.6                                                                                                                         -0.3                                                                                                                                                      0
                                  2001


                                                                                                                      2011


                                                                                                                                                     2001

                                                                                                                                                              2002

                                                                                                                                                                         2003

                                                                                                                                                                                     2004

                                                                                                                                                                                                2005

                                                                                                                                                                                                           2006

                                                                                                                                                                                                                          2007

                                                                                                                                                                                                                                         2008

                                                                                                                                                                                                                                                        2009

                                                                                                                                                                                                                                                                       2010

                                                                                                                                                                                                                                                                                      2011
                        2000


                                            2002

                                                     2003

                                                              2004

                                                                       2005

                                                                               2006

                                                                                       2007

                                                                                               2008

                                                                                                        2009

                                                                                                               2010
                                                                                                                                              Correlation                           Brent crude oil price, USD/bbl (RHS)
                   Monthly production                          12-month moving average                                                             MDEX palm oil price, tens of USD/tonne (RHS)

Source: MPOB, Bloomberg, Rabobank, 2011                                                                                       Source: Rabobank, Bloomberg, 2011


                                                                               cause China’s demand growth for palm oil to                                                      in 2011/12. However, relative to other agri
                                                                               rebound in 2011/12. Using a conservative 5%                                                      commodities, this demand profile is less at
                                                                               YOY increase, this would push China’s palm                                                       risk for a decline based on our economic
                                                                               oil imports to a record high of more than                                                        outlook for 2012.
                                                                               6 million tonnes. However, there may be
                                                                                                                                                                                Palm oil prices will continue to be
                                                                               considerable upside to this assumption,
                                                                                                                                                                                underpinned by soy oil prices and, to a
                                                                               particularly as the last year-on-year decline,
                                                                                                                                                                                lesser extent, rapeseed oil prices. In our
                                                                               which occurred in 2001/02, was met with
                                                                                                                                                                                view, palm oil’s price discount relative to
                                                                               a more than 1 million tonne increase in
                                                                                                                                                                                soy oil will continue to find resistance above
                                                                               2002/03—making even the USDA’s forecast
                                                                                                                                                                                USD 300/tonne—a level not surpassed since
                                                                               for a 7% YOY increase look conservative. We
                                                                                                                                                                                the global financial crisis in 2008. End-users
                                                                               see less risk of a slowdown in India’s palm oil
                                                                                                                                                                                were aggressive buyers of palm oil in 2011 as
                                                                               import demand as they have shifted to
                                                                                                                                                                                its discount dropped below USD 150/tonne.
                                                                               increasing reliance on palm oil in order to
                                                                                                                                                                                We believe this price relationship will persist
                                                                               fulfil vegetable oil demand, which is poised
                                                                                                                                                                                in 2012, keeping price movements in palm oil
                                                                               to expand to a record large 46% of the total
                                                                                                                                                                                dependent on developments in the broader
                                                                               in 2011/12. In our view, palm oil imports to
                                                                                                                                                                                oilseed and vegetable oil complex.
                                                                               India have a larger risk of falling short of
                                                                               expectations than those to China given the                                                       We expect that the year-on-year decline in
                                                                               relatively strong domestic oilseed production                                                    US soybean production in combination with


Figure 3.14: Palm oil and soy oil prices and spread, 2000-2011                                                               Figure 3.15: YOY change in global vegetable oil exports,
                                                                                                                             2000/01-2011/12f
                 1,600                                                                                                                        5
                 1,400                                                                                                                        4
                 1,200
                                                                                                                                              3
                                                                                                                             million tonnes


                 1,000
USD/tonne


                  800                                                                                                                         2
                  600                                                                                                                         1
                  400
                                                                                                                                              0
                  200
                    0                                                                                                                         -1
                 -200                                                                                                                         -2
                                                                                                                      2011
                                     2001
                           2000


                                              2002

                                                       2003

                                                                2004

                                                                        2005

                                                                                2006

                                                                                        2007

                                                                                               2008

                                                                                                        2009

                                                                                                               2010


                                                                                                                                                      00/01

                                                                                                                                                                01/02

                                                                                                                                                                            02/03

                                                                                                                                                                                        03/04

                                                                                                                                                                                                   04/05

                                                                                                                                                                                                                  05/06

                                                                                                                                                                                                                                 06/07

                                                                                                                                                                                                                                                07/08

                                                                                                                                                                                                                                                               08/09

                                                                                                                                                                                                                                                                              09/10

                                                                                                                                                                                                                                                                                             10/11f

                                                                                                                                                                                                                                                                                                        11/12f


                 Soy oil premium to palm oil                           MDEX palm oil                  CBOT soy oil                            Palm oil                  Rapeseed oil                        Soy oil

Source: Rabobank, Bloomberg, 2011                                                                                            Source: USDA, Rabobank, 2011
34 | Rabobank Outlook 2012—Down, But Not Out


                                           increased biodiesel consumption in the
                                           US, Brazil and Argentina will reduce global
                                           exportable surpluses of soy oil by 6% in 2012.
                                           Rapeseed oil availability will also be reduced
                                           as global rapeseed production falls by more
                                           than 7%—a result of a second consecutive
                                           year-on-year decline in rapeseed yields. As
                                           these production shortfalls are met with
                                           continued demand growth, palm oil will
                                           account for a record large share of the world’s
                                           vegetable oil use in 2011/12 at more than
                                           34%. As a result, we expect that the record
                                           large palm oil production will fail to create
                                           a substantial build-up in ending stocks and
                                           will require prices to remain elevated in 2012
                                           in order to prevent demand from increasing
                                           above current expectations. We see the
                                           political uncertainty surrounding biodiesel
                                           production as the biggest downside risk
                                           to our price forecast, particularly the
                                           USD 1/gallon tax credit for US producers
                                           which is set to expire at the end of 2011.
                                           Weather poses the largest upside risk to our
                                           price forecast as a strengthening La Niña
                                           could reduce palm oil production in the
                                           coming months more than expected or
                                           cause South America’s soybean yields
                                           to fall below trendline.
Section 3 Agri Commodity Outlooks: Sugar | 35


SUGAR

ICE               Q2’11      Q3’11         Q4’11f      Q1’12f       Q2’12f      Q3’12f   Q4’12f                       12-month outlook from spot
USc/lb            24         29            24.5        23.5         23          22       22


             35
                                                                                                  Low case                  Base case                  High case
             30
                                                                                                  The 2012 Brazilian        Larger Northern            New season crop defies
             25                                                                                   Centre/South cane         Hemisphere and             expectations; lower-
                                                                                                  crush exceeds             Indian crops shift         than-expected Thai,
                                                                                                  expectations: larger                                 Indian or Brazilian
USc/lb


             20                                                                                                             globe into a surplus,
                                                                                                  surplus, weaker prices                               supplies cause a smaller
                                                                                                                            weighing on                surplus/4th consecutive
             15                                                                                                             international prices
                                                                                                  International demand                                 deficit season
             10                                                                                   expectations from         Ethanol demand              Policy action supports
                                                                                                  China are not met:                                    market; Indian or EU
                                                                                                                            in Brazil and tight
              5                                                                                   larger domestic crop                                  governments allow
                                                                                                  suffices, government-     inventories temper
                                                                                                                            downside bias               smaller exports than
              0                                                                                   buying wanes                                          expected
                  2010                      2011                     2012                         Deteriorating economic    Demand is robust as
                                                                                                                                                        Investor confidence
                                                                                                  conditions result in      prices fall and users       returns and the sugar
                                                                                                  investor liquidation      restock                     market is viewed as
            Historical         Base case            Low/high case        Spot
                                                                                                  in futures markets                                    undervalued, leading
                                                                                                                                                        to buying

         Source: Bloomberg, Rabobank


                                                         We forecast lower international sugar prices in              ICE #11 contract averaged USc 28/pound in
                                                         2012 as the market shifts into a surplus for the             2009/10—resulted in a stock drawdown and
                                                         first time in three seasons. With global ending              pushed users to rely on inventories and hand-
                                                         stocks expected to increase above the 10-year                to-mouth buying. The pent-up demand
                                                         average for the first time since 2008/09, we                 surfaced as prices fell in late 2011, and we
                                                         anticipate NY raw sugar prices will ease and                 expect further demand increases in 2012.
                                                         reach an average level of USc 0.22/pound in
                                                                                                                      In our view, the dominant factor in the sugar
                                                         Q4. Even with the 6 million tonne surplus
                                                                                                                      market in 2012 will be the improved supply
                                                         forecast for 2011/12, we expect volatility to
                                                                                                                      situation, a function of larger crops outside
                                                         remain elevated and the current risk premium
                                                                                                                      of Brazil, and likely a reaction to higher
                                                         to linger until mid-year when crop sizes are
                                                                                                                      prices of the past two seasons. Our forecast
                                                         more certain. In our view, the forecast
                                                                                                                      for total global sugar production in 2011/12
                                                         increased supply will result in lower prices,
                                                                                                                      is 174.5 million tonnes, up 5% from the
                                                         but a number of supportive factors will
                                                                                                                      previous season and the fourth consecutive
                                                         prevent the collapse of values. Increased
                                                                                                                      increase. Better beet crops in the EU and
                                                         demand from global importers and the
                                                                                                                      Russia, as well as increased production in
                                                         ethanol industry in Brazil are anticipated to be
                                                                                                                      Thailand and India, resulted in 6.2 million
                                                         major supportive factors in the new season.
                                                                                                                      more tonnes of sugar, enough to offset the
                                                         Also, the forecast surplus will not be enough
                                                                                                                      lack of growth in Brazilian production year-
                                                         to replenish the 19.8 million tonnes of deficit
                                                                                                                      on-year. With the largest surplus forecast for
                                                         of the past three seasons, and while the
                                                                                                                      2011/12 since 2006/07, when prices averaged
                                                         stocks-to-use ratio is expected to increase in
                                                                                                                      USc 10.3/pound, we expect prices on the NY
                                                         2011/12, it is forecast to be five percentage
                                                                                                                      markets will struggle to remain above the
                                                         points below the 10-year average.
                                                                                                                      USc 25/pound level in 2012,assuming benign
                                                         Given our bias for easing sugar prices in 2012,              weather conditions and no major negative
                                                         we expect the buying support to grow and                     weather events.
                                                         remain resilient even in the case of a
                                                                                                                      The demand for ethanol in Brazil and the
                                                         widespread economic downturn. Our forecast
                                                                                                                      competition between Brazilian drivers and
                                                         demand growth in 2011/12 of 1.6% is a
                                                                                                                      global sugar importers is expected to be a
                                                         function of lower prices encouraging buying
                                                                                                                      major factor in downside support for the
                                                         and is up from the 0.8% increase in the
                                                                                                                      sugar price in 2012. The size of the 2012
                                                         previous season. When the sugar market went
                                                                                                                      Brazilian cane crop is the most important
                                                         into deficit from 2008/09 to 2010/11, annual
                                                                                                                      variable in the equation of how much sugar
                                                         demand growth averaged only 0.3%. We
                                                                                                                      will be available for export and how much
                                                         foresee the need for many international
                                                                                                                      will be available for biofuel use, but the prices
                                                         buyers to come on the market in 2012 to
                                                                                                                      of the products will determine the share of
                                                         restock diminished inventories. In our view,
                                                                                                                      the cane crop devoted to each. Our early
                                                         the elevated prices of the past season—the
                                                                                                                      projections suggest the Centre/South cane
36 | Rabobank Outlook 2012—Down, But Not Out


                                                                                             harvest could be slightly lower than                                                                             likely be another supportive demand-side
                                                                                             500 million tonnes, up from the 2011 estimate                                                                    factor in 2012. In 2011/12, Chinese sugar
                                                                                             of 490 million tonnes, but still below the                                                                       production is forecast to increase 9% from
                                                                                             record of 556 million tonnes reached in                                                                          the previous season on better weather
                                                                                             2010/11. The early projections of cane supply                                                                    and an increase in planted area. Domestic
                                                                                             suggest the market for ethanol will be tight                                                                     consumption is forecast to increase 2.3% in
                                                                                             and that there will be strong competition                                                                        2011/12 with the domestic crop representing
                                                                                             between the two products.                                                                                        81% of total demand. Depleted stocks and
                                                                                                                                                                                                              the expected domestic deficit of 2.0 million-
                                                                                             How much of the cane crop will be used
                                                                                                                                                                                                              2.5 million tonnes mean that imports are
                                                                                             to produce ethanol is a function of the
                                                                                                                                                                                                              forecast to rise to 3 million tonnes, up from
                                                                                             international price of sugar and the USD/BRL
                                                                                                                                                                                                              2.8 million the previous season.
                                                                                             exchange rate. If the ICE #11 contract falls too
                                                                                             far, mills in Brazil will focus on ethanol instead                                                               In our base case prices, we see strong support
                                                                                             of sugar, assuming a fixed currency exchange                                                                     for raw sugar values, given the expectations
                                                                                             rate. We estimate the current price level for                                                                    for demand growth and the modest build-up
                                                                                             mills to change from sugar production to                                                                         of stocks. We forecast prices to average
                                                                                             ethanol production at near USc 22/pound.                                                                         USc 23.5/pound in 2011/12, a historically
                                                                                             In the medium term, we assume this support                                                                       high price, but down USc 4.5/pound from the
                                                                                             level will fluctuate between USc 18/pound                                                                        previous season’s average. We see downside
                                                                                             and USc 22/pound. In our view, there will                                                                        risk bias being moderated by demand
                                                                                             be strong support in the international sugar                                                                     expectations and the increasing competition
                                                                                             price at levels that encourage ethanol                                                                           of ethanol for cane sugar in Brazil.
                                                                                             production over sugar production. Given our
                                                                                                                                                                                                              In our high case, better economic growth
                                                                                             outlook on ethanol prices, we forecast this
                                                                                                                                                                                                              and a weaker devaluation of the US dollar
                                                                                             support level to be near our USc 22/pound
                                                                                                                                                                                                              will add further support for the sugar market.
                                                                                             price forecast for raw sugar. Looking further
                                                                                                                                                                                                              With a stronger US dollar, the value of sugar
                                                                                             out the curve, the growing flex-fuel fleet in
                                                                                                                                                                                                              in Brazilian reais will fall, meaning that
                                                                                             Brazil and diminished investment in sugar
                                                                                                                                                                                                              international futures contracts—all priced in
                                                                                             capacity will likely keep the domestic market
                                                                                                                                                                                                              US dollars—will have to increase to offset the
                                                                                             tight. The government has implemented
                                                                                                                                                                                                              falls in real value for Brazilian mills. Speculator
                                                                                             some legislation to support ethanol output
                                                                                                                                                                                                              interest in sugar could also add a supportive
                                                                                             and has threatened more policy measures,
                                                                                                                                                                                                              element if economic growth expectations are
                                                                                             but in our view, the main deciding factor in
                                                                                                                                                                                                              revised higher; the speculator net long
                                                                                             the production of ethanol will be the price
                                                                                                                                                                                                              positions were heavily liquidated in 2H due to
                                                                                             of sugar on the NY market. A shortfall of sugar
                                                                                                                                                                                                              heightened market uncertainty. Speculators
                                                                                             for ethanol on the Brazilian market due to
                                                                                                                                                                                                              may increase the net long position if bullish
                                                                                             elevated sugar prices may result in further
                                                                                                                                                                                                              economic growth triggers a risk-on
                                                                                             corn ethanol imports from the US as in 2011.
                                                                                                                                                                                                              environment but we expect this to be
                                                                                             Chinese sugar inventories are at very low                                                                        tempered by the better supply expected
                                                                                             levels currently, and government-buying will                                                                     in the new season.


  Figure 3.16: Global sugar production and surplus/deficit,                                                                                                            Figure 3.17: Brazilian ethanol and sugar price inter-relationship
  2000/01-2011/12f
                    10                                                                                                                               200                                 26
                                                                                                                                                     180
                     5                                                                                                                               160                                 24
                                                                                                                                                     140
                                                                                                                                                                       NY sugar prices


                                                                                                                                                                                         22
  million tonnes


                     0                                                                                                                               120
                                                                                                                                                           raw value


                                                                                                                                                     100                                 20
                    -5                                                                                                                                80
                                                                                                                                                      60                                 18
                   -10                                                                                                                                40
                                                                                                                                                                                         16
                                                                                                                                                      20
                   -15                                                                                                                                 0                                 14
                                                                                                                                                                                                    0.90         1.00          1.10         1.20          1.30   1.40
                                                                                                                                2010/11
                          2000/01

                                    2001/02

                                              2002/03

                                                        2003/04

                                                                    2004/05

                                                                              2005/06

                                                                                        2006/07

                                                                                                  2007/08

                                                                                                            2008/09

                                                                                                                      2009/10


                                                                                                                                          2011/12f


                                                                                                                                                                                                                        Anhydrous ethanol price (BRL/L)


                                                                                                                                                                                              Sugar equiv. (BRL1.60/USD)         Sugar equiv. (BRL1.75/USD)
                   Surplus/deficit                                Production                                                                                                                  Sugar equiv. (BRL1.90/USD)

  Source: Rabobank, FO Licht, 2011                                                                                                                                     Source: Rabobank, Bloomberg, 2011
Section 3 Agri Commodity Outlooks: Sugar | 37


In the sugar futures markets, prices have been
greatly impacted by macro concerns in 2011,
and this is expected to remain a major price
driver in 2012. If further negative macro
events occur and our low case of risk-off and
a higher US dollar becomes reality, sugar
prices could over-correct as they did in
May 2010 when they fell to USc 13.67/pound.
The speculator net long position, while low
relative to historic averages, could still be
liquidated further, putting major pressure
on prices. A stronger US dollar environment
would also be unfriendly for international
prices. However, even with negative
conditions, the lower prices would likely
generate increased buying support.

We anticipate high volatility in 2012, which
will partially be a function of heightened
political risk which remains a dominant
feature of the global sugar market. While we
forecast a larger crop for India in 2012 and the
potential for 4 million tonnes of exports, the
Indian government policy of allowing exports
only when domestic supply is assured, and
generally in incremental amounts, increases
uncertainty on the global market. The EU is
also expected to influence the international
market with government action as the bloc
may face a shortage of sugar in 2012 with
imports unlikely to reach demand
expectations. The domestic EU crop in
2011/12 is forecast at 17.4 million tonnes, up
from 15.1 million tonnes the previous season,
but this additional supply is out of quota
and cannot therefore be used for human
consumption. Given the supply issues the
EU experienced in 2011, we anticipate policy
action if a shortfall is expected, but what the
EU will do, and to what extent, is unknown.


 Figure 3.18: No. 11 Sugar managed money net long position
 and price, 2000/01-2011/12f
                      250                                                                                                                                           40
                                                                                                                                                                    35
                      200
                                                                                                                                                                    30
 thousand contracts


                      150
                                                                                                                                                                    25
                                                                                                                                                                         USc/lb


                      100                                                                                                                                           20
                                                                                                                                                                    15
                       50
                                                                                                                                                                    10
                        0
                                                                                                                                                                     5
                      -50                                                                                                                                            0
                            Nov-06
                            Mar-07
                                     Jul-07
                                              Nov-07
                                                       Mar-08
                                                                Jul-08
                                                                         Nov-08
                                                                                  Mar-09
                                                                                           Jul-09
                                                                                                    Nov-09
                                                                                                              Mar-10
                                                                                                                       Jul-10
                                                                                                                                Nov-10
                                                                                                                                         Mar-11
                                                                                                                                                  Jul-11
                                                                                                                                                           Nov-11


                       Managed money net long position                                                       No. 11 Sugar price (RHS)

 Source: Rabobank, CFTC, Bloomberg, 2011
38 | Rabobank Outlook 2012—Down, But Not Out


COFFEE

ICE                            Q2’11           Q3’11           Q4’11f           Q1’12f              Q2’12f             Q3’12f        Q4’12f                                                       12-month outlook from spot
USc/lb                         271             257             230              220                 200                180           170

                        350

                        300                                                                                                                                Low case                                              Base case                                    High case
                                                                                                                                                           Better-than-expected                                  A large 2012 Brazilian                       Weather conditions
                        250
                                                                                                                                                           2011/12 Colombian                                     crop shifts the globe                        affect the Brazilian
                                                                                                                                                           crop and increased                                    back to surplus and                          crop, exacerbating
USc/lb


                        200
                                                                                                                                                           2012/13 production                                    alleviates tight supply                      tight supply situation
                        150                                                                                                                                build Arabica supply
                                                                                                                                                                                                                 Demand growth                                Low stock levels
                        100                                                                                                                                Recession weakens                                     continues at 2.5%,                           aggravate any
                                                                                                                                                           consumption growth                                    supporting values                            production disruption,
                         50                                                                                                                                in emerging markets;                                                                               encouraging
                                                                                                                                                           demand weakens,                                       Last year’s elevated                         speculative buying
                           0                                                                                                                               production increases                                  prices support
                               2010                               2011                                   2012                                                                                                    increased marginal                           The Vietnamese
                                                                                                                                                           Recession fears                                       production growth                            government enacts a
                                                                                                                                                           prompt a speculator                                   in the medium term                           buying programme to
                        Historical                Base case                Low/high case                   Spot
                                                                                                                                                           sell-off, resulting in                                                                             support Robusta prices
                                                                                                                                                           futures liquidation


           Source: Bloomberg, Rabobank


                                                                                   Coffee prices are forecast to fall in 2012 due                                                                 anticipate Arabica prices to revert to 2009
                                                                                   to the large harvests expected in Brazil and                                                                   levels in 2012, due to the risks of production
                                                                                   Vietnam, but diminished stocks will keep risks                                                                 and low inventories. However, it is our view
                                                                                   skewed to the upside. Unlike after past coffee                                                                 that the elevated prices from 2010/11 will
                                                                                   price rallies, we do not foresee a collapse of                                                                 have resulted in increasing marginal gains in
                                                                                   prices as it will take a couple of seasons to                                                                  production and helping lift stock levels.
                                                                                   replenish stocks and reverse the decade-long                                                                   Consequently, we expect the 2011/12
                                                                                   trend of falling stock levels. The stocks-to-use                                                               season—a low season for the Brazilian crop,
                                                                                   ratio has fallen from 44% in 2002/03—the                                                                       but the largest off-season crop ever—to be a
                                                                                   height of the coffee crisis—to our forecast                                                                    nadir in the medium term for the stocks-to-
                                                                                   18% in 2011/12, the lowest on record.                                                                          use ratio. While increases in planted area will
                                                                                   Strong global demand is also supportive                                                                        only yield output growth in three to four
                                                                                   of prices and continues to grow at a brisk                                                                     years’ time, the better prices have also
                                                                                   2.5% annually.                                                                                                 encouraged better husbandry as well as
                                                                                                                                                                                                  increased use of inputs, both of which
                                                                                       We anticipate the 2011/12 coffee season will
                                                                                                                                                                                                  are supportive for increasing output in
                                                                                       be characterised by razor-thin stocks and high
                                                                                                                                                                                                  the short term.
                                                                                       risks, but in our view this is a turning point in
                                                                                       a decade-long trend of shrinking supply. Even                                                              Brazilian production has increased notably in
                                                                                       with a large Brazilian crop, we do not                                                                     the past as a result of higher prices, and we


         Figure 3.19: Global coffee ending stock and stocks-to-use,                                                                                Figure 3.20: Coffee inventories and NY futures price,
         2000/01-2011/12f                                                                                                                          Jul 1995-Jul 2011
                        60                                                                                                          50                            8                                                                                                                            320
                                                                                                                                    45
                        50                                                                                                                                        7                                                                                                                            280
                                                                                                                                    40
                                                                                                                                                                  6                                                                                                                            240
                                                                                                                                    35
                        40
         million bags


                                                                                                                                                   million bags


                                                                                                                                    30                            5                                                                                                                            200
                                                                                                                                         percent


                                                                                                                                                                                                                                                                                                     USc/lb


                        30                                                                                                          25                            4                                                                                                                            160
                                                                                                                                    20
                        20                                                                                                                                        3                                                                                                                            120
                                                                                                                                    15
                                                                                                                                                                  2                                                                                                                             80
                                                                                                                                    10
                        10
                                                                                                                                     5                            1                                                                                                                             40
                          0                                                                                                          0                            0                                                                                                                              0
                               00/01

                                       01/02

                                               02/03

                                                       03/04

                                                               04/05

                                                                       05/06

                                                                               06/07

                                                                                         07/08

                                                                                                 08/09

                                                                                                          09/10


                                                                                                                                                                                                                                                                                        2011
                                                                                                                                                                                                                  2001
                                                                                                                  10/11f

                                                                                                                           11/12f


                                                                                                                                                                                                                                                            2007
                                                                                                                                                                                                                                                                   2008
                                                                                                                                                                                                                                                                          2009
                                                                                                                                                                                                                                                                                 2010
                                                                                                                                                                      1995
                                                                                                                                                                             1996
                                                                                                                                                                                    1997
                                                                                                                                                                                           1998
                                                                                                                                                                                                   1999
                                                                                                                                                                                                          2000


                                                                                                                                                                                                                         2002
                                                                                                                                                                                                                                2003
                                                                                                                                                                                                                                       2004
                                                                                                                                                                                                                                              2005
                                                                                                                                                                                                                                                     2006


         Note: 1 bag=60 kilogrammes                                                                                                                Note: 1 bag=60 kilogrammes
                                                                                                                                                                      ICE Coffee stocks            US green coffee stocks
                        Ending stocks                   Stocks-to-use (RHS)
                                                                                                                                                                      NY front month coffee price (RHS)

         Source: Rabobank, 2011                                                                                                                    Source: Bloomberg, Rabobank, 2011
Section 3 Agri Commodity Outlooks: Coffee | 39


anticipate the country will respond to current                                                                        also anticipate consumption growth in origin
international values with a jump in output.                                                                           countries to remain robust. Global coffee
The Brazilian crop has increased 80% since                                                                            demand is forecast to increase 2.4% in
1981 while area has actually decreased 12.5%.                                                                         2011/12, up from 2.1% the previous season
However, it has not been a uniform fall as                                                                            and flat with the 10-year average of 2.5%. In
higher coffee prices have led to increased                                                                            our view, coffee demand will be supported
area harvested. The coffee rally of 1986                                                                              by lower prices in 2012 and increases in
resulted in a harvest area increase of 17%                                                                            consumption at origin, especially in Brazil.
three seasons later, while four years after the                                                                       Coffee consumption in Brazil has been
1997 rally, harvest area in the country had                                                                           growing at a 3.9% annual average in
grown 14%.                                                                                                            the past 10 seasons, and we foresee use
                                                                                                                      expanding by 4.1% in 2012. Based on our
Arabica production has been increasing
                                                                                                                      models, Brazil will replace the US as the
slower than coffee demand growth. Global
                                                                                                                      largest consumer of coffee in five years.
production for the variety has increased only
11% from 2001/02 to 2011/12, while total                                                                              While coffee is not an essential component
coffee demand has increased 29% in the                                                                                of the human diet (though this is subject to
same period. The difference has been made                                                                             debate), the income elasticity of demand for
up by increased Robusta production and                                                                                the product is low; during the financial crisis
stock drawdown. Reduced production from                                                                               of 2007-2009 the demand for coffee
Colombia in the past three seasons has                                                                                continued to grow, albeit at a slightly slower
exacerbated the low Arabica stocks situation                                                                          pace. Coffee imports and purchases were
and has been a catalyst for the 2010/11 price                                                                         skewed during the crisis as companies drew
rally. In 2012, Arabica supply will be more                                                                           down stocks and consumers altered buying
abundant because of the larger forecast                                                                               habits, but the amount of coffee consumed
Brazilian crop, but as this supply will not come                                                                      increased 2.2% and 1.1% in 2007/08 and
on-line until the start of May, volatility and risk                                                                   2008/09, respectively. However, this growth
remains elevated. Our early projection for the                                                                        is down from the previous five-year average
2012 Brazilian crop is 59 million 60kg bags,                                                                          of 3.2%. The resilience of coffee demand was
46 million bags of which is expected to be                                                                            illustrated during the severe recession of
Arabica, and 7 million bags washed. The                                                                               2007-2009, and we assume this robust
coming Brazilian crop is bearish given its size,                                                                      demand will remain even in the face of
but the previous record harvest in 2010                                                                               weaker and uncertain economic conditions
occurred as prices were rallying to record                                                                            in 2012. Given the resilience of consumption,
highs. In our view, the difference is that higher                                                                     we expect prices in 2012 to be determined
prices of the past season will result in larger                                                                       much more by supply-side dynamics.
increases in production in other producer
                                                                                                                      Arabica prices are influenced by the
countries in 2012.
                                                                                                                      movements in the US dollar and the Brazilian
Our base case of slowing economic growth                                                                              real and our expectations of a weaker US
in the US and the EU is not expected to have                                                                          dollar in 2012 are mildly friendly for coffee
a measurable impact on coffee demand; we                                                                              prices. A falling US dollar is supportive for


 Figure 3.21: Coffee currencies and NY futures price,
 Apr 2010-Oct 2011
                                                                                                                          0.058   .70    330
                                                                                                                          0.057   .68    310
                                                                                                                          0.056   .66    290
                                                                                                                          0.055   .64    270
                                                                                                                          0.054   .62    250
                                                                                                                          0.053    .60   230
                                                                                                                          0.052   .58    210
                                                                                                                          0.051   .56    190
                                                                                                                          0.050   .54    170
                                                                                                                          0.049   .52    150
                                                                                                                          0.048   .50    130
                                                                  Jan-11
                                                                  Feb-11
                                                                  Mar-11
                                                                           Apr-11
                                                                           May-11
                                                                                     Jun-11
                                                                                               Jul-11
                                                                                              Aug-11
                                                                                                        Sep-11
                                                                                                                 Oct-11
                                                                                                                 Nov-11
   Apr-10
            Jun-10
                     Jul-10
                              Aug-10
                                       Sep-10
                                                Oct-10
                                                Nov-10
                                                         Dec-10


               BRL/USD                                   COP/USD                    NY front month coffee (USc/lb)

 Source: Bloomberg, Rabobank, 2011
40 | Rabobank Outlook 2012—Down, But Not Out


                                           coffee futures prices in NY as it means lower
                                           costs for international buyers, promoting
                                           sales, and a falling dollar generally
                                           encourages fund-buying in the commodity
                                           markets. Speculators use the agri complex
                                           as both a hedge against the falling US
                                           currency and a supporting factor.

                                           The Brazilian real is expected to appreciate in
                                           2012, and this generally supports the Arabica
                                           market. As Brazil accounts for approximately
                                           40% of total global Arabica output and half
                                           of total Arabica exports, moves in the Brazilian
                                           currency are an important factor in coffee
                                           prices, on both the ICE and BMF Arabica
                                           future exchanges. A stronger Brazilian real
                                           is supportive for Arabica prices as growers
                                           in Brazil receive less value for the commodity
                                           and are not inclined to sell. The relationship
                                           between the currency and prices on the
                                           terminal market breaks down when strong
                                           fundamental indicators move the market. We
                                           anticipate currency moves to be supportive
                                           for the coffee markets in 2012, but currency
                                           markets will likely be overshadowed by
                                           fundamental factors as supply is very tight
                                           and production risks are high.
Section 3 Agri Commodity Outlooks: Cocoa | 41


COCOA

ICE                   Q2’11     Q3’11         Q4’11f      Q1’12f                 Q2’12f                 Q3’12f                     Q4’12f                                                                             12-month outlook from spot
USD/tonne             3,042     2,969         2,400       2,350                  2,450                  2,350                      2,300


              3,500

              3,000
                                                                                                                                                                        Low case                                                    Base case                          High case
                                                                                                                                                                        Larger-than-expected                                        Record carry-over from             New government
              2,500                                                                                                                                                     crops from West Africa                                      2010/11 season; large              buyer established
                                                                                                                                                                        add to high buffer                                          product stocks                     in Ivory Coast,
USD/tonne


              2,000                                                                                                                                                     stocks, pushing prices                                      pressure terminal                  compromising supply
                                                                                                                                                                        lower                                                       markets                            certainty
              1,500
                                                                                                                                                                        Economic contraction                                        Emerging-market                    Increased chocolate
              1,000                                                                                                                                                     results in lower                                            demand for powder                  and cocoa-based
                                                                                                                                                                        chocolate and cocoa-                                        products underpins                 product consumption
                500                                                                                                                                                     based production,                                           the entire complex                 exceeds forecasts,
                                                                                                                                                                        crimping demand                                                                                causing inventory
                  0                                                                                                                                                                                                                 US/EU chocolate                    drawdown
                                                                                                                                                                        Better supply                                               consumption remains
                      2010                     2011                                   2012
                                                                                                                                                                        expectations liquidate                                      stagnant with                      West African short
                                                                                                                                                                        large commercial long                                       lacklustre performance             crops diminished by
               Historical         Base case            Low/high case                      Spot                                                                          position in terminal                                        in cocoa butter market             detrimental weather,
                                                                                                                                                                        markets                                                                                        pushing market into
                                                                                                                                                                                                                                                                       large deficit

            Source: Bloomberg, Rabobank


                                                            Abundant supply of cocoa beans and better                                                                                                             supplements. The growth in demand for
                                                            expectations for the 2011/12 crops are                                                                                                                cocoa powder products is expected to come
                                                            expected to lead prices lower in 2012. This                                                                                                           from emerging markets.
                                                            downside, as prices pass two-year lows,
                                                                                                                                                                                                                  There is no consistent pattern for cocoa bean
                                                            follows concerns about West African
                                                                                                                                                                                                                  terminal markets in a recession since supply
                                                            output dwindling.
                                                                                                                                                                                                                  dynamics are generally more important for
                                                            The cocoa bean market is vulnerable                                                                                                                   prices. During the 2007-2009 recession, cocoa
                                                            to economic contraction as chocolate                                                                                                                  prices on the ICE exchange in the US ended
                                                            confectionery is subject to demand                                                                                                                    higher. However, during this period cocoa
                                                            destruction when incomes are under                                                                                                                    grindings fell as many chocolate makers
                                                            pressure. Given the expectations of weak                                                                                                              decreased the size of consumer products or
                                                            economic growth in the EU and the US, we                                                                                                              used substitutes for cocoa. Some of the
                                                            foresee consumer chocolate demand in these                                                                                                            decrease in grindings can also be attributed
                                                            regions to be flat in 2012. However, the cocoa                                                                                                        to manufacturers drawing down stocks.
                                                            bean market is somewhat insulated from                                                                                                                Looking to 2012, we anticipate EU and US
                                                            weakness in chocolate consumption due to                                                                                                              grindings falling from 2011 levels, but total
                                                            the increasing demand for cocoa powder,                                                                                                               global grindings to increase 3.7% in 2011/12,
                                                            which is found in a variety of products, from                                                                                                         driven mostly by the powder market.
                                                            chocolate drinks and ice cream to health


                                                              Figure 3.22: Cocoa grindings and YOY GDP change in mature
                                                              markets, Jun 2000-Sep 2011

                                                                                550                                                                                                                                                       10
                                                                                                                                                                                                                                           8
                                                                                500                                                                                                                                                        6
                                                              thousand tonnes


                                                                                                                                                                                                                                           4
                                                                                450                                                                                                                                                        2
                                                                                                                                                                                                                                               percent


                                                                                                                                                                                                                                           0
                                                                                400                                                                                                                                                       -2
                                                                                                                                                                                                                                          -4
                                                                                350                                                                                                                                                       -6
                                                                                                                                                                                                                                          -8
                                                                                300                                                                                                                                                      -10
                                                                                               Mar-01
                                                                                                        Dec-01


                                                                                                                                                                                                                                Sep-11
                                                                                      Jun-00


                                                                                                                 Sep-02
                                                                                                                          Jun-03
                                                                                                                                    Mar-04
                                                                                                                                             Dec-04
                                                                                                                                                      Sep-05
                                                                                                                                                               Jun-06
                                                                                                                                                                         Mar-07
                                                                                                                                                                                  Dec-07
                                                                                                                                                                                           Sep-08
                                                                                                                                                                                                    Jun-09
                                                                                                                                                                                                             Mar-10
                                                                                                                                                                                                                       Dec-10


                                                                                Combined US and EU grindings                                                        EU (RHS)                                 US (RHS)

                                                              Source: Rabobank, IMF, NCA, ECA, 2011
42 | Rabobank Outlook 2012—Down, But Not Out


                                                         The cocoa bean market could be impacted                                                 capacity by the major producing regions was
                                                         in 2012 by policy moves in Ivory Coast as                                               leading to a global deficit. The average front-
                                                         the new government may play a larger role                                               month price in NY between 2004 and 2007
                                                         in the procurement and trade of cocoa. The                                              was USD 1,591/tonne while between 2008
                                                         government announced in early November                                                  and 2011 it was USD 2,826/tonne, 78% higher.
                                                         2011 that farmers will receive a guaranteed                                             Concerns that farmers in West Africa would
                                                         cocoa bean price of between 50% and 60%                                                 abandon plantations or switch production to
                                                         of the international terminal price. This is                                            rubber supported terminal markets. It seems
                                                         not expected to have a significant impact as                                            the high prices have worked; helped by
                                                         grower prices are already at or above these                                             supportive weather, Ivory Coast production
                                                         levels. The Ivory Coast government has stated                                           reached a record in 2010/11, and government
                                                         that the export tax is capped at 22%, down                                              officials say a large crop is also expected for
                                                         from a 25.3% average in 2008/09, and the                                                2011/12. Even with the positive impacts of
                                                         lower tax will allow growers to realise greater                                         La Niña, production would not reach such
                                                         returns. The new government has outlined                                                levels if plantations had been abandoned
                                                         a plan in which exporters must pre-purchase                                             or switched to rubber. Price signals have
                                                         beans before the harvest begins as a way                                                increased output, and alongside supportive
                                                         to have funds to guarantee the farmer price.                                            weather, this is a bearish outcome in a world
                                                         The uncertainty about the government’s                                                  eating only marginally more chocolate.
                                                         plans is impacting the market, and since
                                                         the country accounts for one-third of global
                                                         output, unpredictable government
                                                         interventions will inject volatility into
                                                         the international terminal markets.
                                                         Due to a large carry-over of cocoa beans from
                                                         2010/11 and sizeable crops expected for the
                                                         2011/12 main harvest, the supply of cocoa
                                                         beans looks bearish in the short term. With
                                                         flat chocolate consumption, we anticipate
                                                         the butter ratio, which in the EU fell to below
                                                         1.0 in November, to continue to remain under
                                                         pressure in 2012. Powder ratios are expected
                                                         to continue to drive the markets. This dynamic
                                                         has been the focal point of the cocoa market
                                                         in the past year and we expect this to
                                                         continue in early 2012.

                                                         In our view, the price of cocoa beans rose to a
                                                         new norm in the past four years, as the market
                                                         became concerned that underinvestment in


  Figure 3.23: NY Cocoa prices, Nov 2000-Nov 2011                                                         Figure 3.24: NY Cocoa commercial long position and price,
                                                                                                          1995-2011
              4,000                                                                                                            160                                                                             4,000
              3,500                                                                                                            140                                                                             3,500

              3,000                                                                                                            120                                                                             3,000
                                                                                                          thousand contracts
  USD/tonne


                                                                                                                               100                                                                             2,500
                                                                                                                                                                                                                       USD/tonne


              2,500

              2,000                                                                                                             80                                                                             2,000
                                                                                                                                60                                                                             1,500
              1,500
                                                                                                                                40                                                                             1,000
              1,000
                                                                                                                                20                                                                              500
               500
                                                                                                   2011
                             2001
                      2000


                                    2002

                                           2003

                                                  2004


                                                         2005

                                                                2006

                                                                       2007


                                                                              2008

                                                                                     2009


                                                                                            2010


                                                                                                                                 0                                                                                0
                                                                                                                                                                                                        2011
                                                                                                                                                            2001
                                                                                                                                  1995

                                                                                                                                         1997


                                                                                                                                                 1999


                                                                                                                                                                   2003


                                                                                                                                                                               2005


                                                                                                                                                                                       2007


                                                                                                                                                                                               2009


                 NY cocoa price              4-year average                                                                      Commercial long position                 NY front month cocoa price (RHS)

  Source: Bloomberg, Rabobank, 2011                                                                       Source: Rabobank, CFTC, 2011
Section 3 Agri Commodity Outlooks: Cotton | 43


COTTON

ICE                Q2’11     Q3’11         Q4’11f      Q1’12f       Q2’12f      Q3’12f   Q4’12f                        12-month outlook from spot
USc/lb             168       108           95          85           85          80       80


             200
             180                                                                                  Low case                   Base case                    High case
             160                                                                                  Demand continues to        Better 2011 crops            Better-than-expected
             140                                                                                  weaken for cotton as       increase supply and          economic growth
             120                                                                                  garment sales fall due     weigh on prices              spurs demand
USc/lb


                                                                                                  to economic
             100                                                                                  contraction                Lower international          Lower prices result in
              80                                                                                                             prices support               lower-than-expected
                                                                                                  Higher USD reduces         demand growth                Southern Hemisphere
              60
                                                                                                  apparel imports into                                    planting, shrinking
              40                                                                                  the US, cutting cotton     Planted area growth          supply supporting
              20                                                                                  consumption rates          continues in 2012 with       prices after 2H 2012
                                                                                                                             prices still high relative
               0                                                                                  Further risk-off prompts   to historic averages         Planting in the US is
                   2010                     2011                     2012                         more investor                                           unable to reach
                                                                                                  liquidation in NY                                       estimates due to
                                                                                                  futures market; current                                 continued drought
            Historical         Base case            Low/high case        Spot                     33,157 longs = 13%                                      in Texas
                                                                                                  open interest


         Source: Bloomberg, Rabobank


                                                         In 2012, we expect the global cotton industry                 synthetic fibre will come under the same
                                                         to be under pressure and prices to fall due to                pressure as cotton as the apparel industry
                                                         the largest global crop ever and stagnant                     faces reduced demand growth.
                                                         demand. In our view, downside price
                                                                                                                       We forecast global cotton consumption in
                                                         movements in 2012 will be tempered in
                                                                                                                       2011/12 to increase 1.5% while production
                                                         Q1 by the battle for acres in the Northern
                                                                                                                       for the 2011/12 season is expected to be
                                                         Hemisphere growing regions and concerns
                                                                                                                       6.6% higher than the previous season. The
                                                         about the impact of dryness on US plantings.
                                                                                                                       largest contributor to demand growth is
                                                         As a consumer good and not a food product,                    expected to be emerging markets, especially
                                                         cotton is more susceptible to economic                        China. Apparel demand in China has not
                                                         downturns than the rest of the agri complex,                  slowed as it has in the US; while the Chinese
                                                         and this was evident in price movements                       economy cooled in 2011, buyers purchased
                                                         during the past recessions. In our view, cotton               a record amount of textiles. Growth is
                                                         demand will be squeezed on both sides in                      forecast to slow further in 2012 in China,
                                                         2012, as high prices for the fibre in the past                but we anticipate the consumption of
                                                         season resulted in higher priced yarn and                     apparel will remain strong. Although global
                                                         textiles; high unemployment and concerns                      demand for cotton and textiles is being
                                                         about household incomes have also resulted                    increasingly driven by China, the country
                                                         in increasingly cost-conscious consumers.                     cannot absorb all of the fibre. We expect
                                                         Garments made from higher priced cotton                       prices will have to move lower in order to
                                                         are reaching retail outlets as the growth in the              stimulate demand outside of China.
                                                         US and EU economies remains anaemic and
                                                                                                                       The US drought, which began in
                                                         consumer confidence low. Prices of apparel
                                                                                                                       October 2010 and continues today, has
                                                         in the US jumped, with year-on-year increases
                                                                                                                       devastated cotton production in Texas and
                                                         the highest in two decades. Given the
                                                                                                                       may have a lasting impact as spring plantings
                                                         stable prices in the months leading up to
                                                                                                                       could be threatened. The drought is likely
                                                         November 2011, higher priced textiles
                                                                                                                       to have reduced the US 2010/11 cotton
                                                         will remain the norm for much of the first
                                                                                                                       production estimate by 2 million bales, or
                                                         half of 2012 and will continue to impede
                                                                                                                       11%. The current La Niña pattern is forecast to
                                                         demand growth.
                                                                                                                       remain in place for the second winter in a row.
                                                         The increased use of synthetic fibres worsens                 A La Niña pattern generally results in lower
                                                         the cotton outlook further. In the 2010/11                    precipitation in the Texas/Oklahoma region.
                                                         season, when cotton prices reached all-time                   Together the two states accounted for 54%
                                                         highs, many textile producers blended more                    of total acreage planted in 2011. The National
                                                         synthetic fibres, reducing the demand for                     Oceanic and Atmospheric Administration of
                                                         natural cotton. Synthetic fibre production in                 the US projects the main cotton growing
                                                         China, the largest producer, is forecast to have              region to remain dryer and warmer than
                                                         reached a record high in 2011. In 2012,                       average. Time remains for the drought to
44 | Rabobank Outlook 2012—Down, But Not Out


                                                                                 Figure 3.25: Cotton and S&P GSCI Agriculture Index price
                                                                                 performance in recessions, 1970-2009

                                                                                                                 2.0
                                                                                                                 1.8


                                                                                 Indexed to start of recession
                                                                                                                 1.6
                                                                                                                 1.4
                                                                                                                 1.2
                                                                                                                 1.0
                                                                                                                 0.8
                                                                                                                 0.6
                                                                                                                 0.4


                                                                                                                                                                                  1981


                                                                                                                                                                                                                 1991
                                                                                                                        1970


                                                                                                                                        1973


                                                                                                                                                           1975


                                                                                                                                                                                                         1982


                                                                                                                                                                                                                           2007


                                                                                                                                                                                                                                     2008
                                                                                                                       ICE cotton front month                                      S&P agri index

                                                                                 Source: Bloomberg, Rabobank, MBER, 2011


                                                                                break before plantings, but the weather                                                                                                    The cotton price on the NY market will
                                                                                projections for the 2012 US cotton crop                                                                                                    have to strike a balance between promoting
                                                                                are bullish.                                                                                                                               consumption outside of China and
                                                                                                                                                                                                                           encouraging enough US growers to plant
                                                                                Cotton will compete with the other row
                                                                                                                                                                                                                           in the spring of 2012. Given these dynamics,
                                                                                crops in 2012 for acres, and as prices in the
                                                                                                                                                                                                                           we expect Q1 2012 to be the most supported
                                                                                agri complex are elevated, we do not expect
                                                                                                                                                                                                                           period for cotton prices, but if benign weather
                                                                                a collapse of cotton values. US farmers
                                                                                                                                                                                                                           supports the US crop outlook, continued
                                                                                increased planted area 34% for the 2011/12
                                                                                                                                                                                                                           downside is expected. Any correction in the
                                                                                season as prices reached new nominal
                                                                                                                                                                                                                           cotton price could be amplified, depending
                                                                                records. A high abandonment rate of
                                                                                                                                                                                                                           on the state of the global economy.
                                                                                33% in the season was the result of the
                                                                                devastating drought. For 2012, our early
                                                                                projections are for US farmers to decrease
                                                                                planting to 11 million acres. We assume
                                                                                that the weather conditions will improve
                                                                                in Texas, allowing for a more average
                                                                                abandonment rate and yield. Given this,
                                                                                2012 output is expected to exceed the
                                                                                2011 harvest.


  Figure 3.26: Global and Chinese cotton consumption,                                                                                                                                    Figure 3.27: World cotton production and surplus/deficit,
  1971/72-2011/12f                                                                                                                                                                       1991/92-2011/12f
                  160                                                                                                                                     60                                             15                                                      130
                  140                                                                                                                                                                                    10
                                                                                                                                                          50                                                                                                     120
                  120
                                                                                                                                                                                                           5
                                                                                                                                                          40                                                                                                     110
                                                                                                                                                                                         million bales


                                                                                                                                                                                                                                                                       million bales
  million bales


                                                                                                                                                                  million bales


                  100
                                                                                                                                                                                                          0
                   80                                                                                                                                     30                                                                                                     100
                                                                                                                                                                                                          -5
                   60
                                                                                                                                                          20                                                                                                      90
                                                                                                                                                                                                         -10
                   40
                                                                                                                                                          10                                             -15                                                      80
                   20
                     0                                                                                                                                     0                                             -20                                                      70
                                                                                                                                                                                                                 00/01
                                                                                                                                                                                                                 91/92
                                                                                                                                                                                                                 92/93
                                                                                                                                                                                                                 93/94
                                                                                                                                                                                                                 94/95
                                                                                                                                                                                                                 95/96
                                                                                                                                                                                                                 96/97
                                                                                                                                                                                                                 97/98
                                                                                                                                                                                                                 98/99
                                                                                                                                                                                                                 99/00

                                                                                                                                                                                                                 01/02
                                                                                                                                                                                                                 02/03
                                                                                                                                                                                                                 03/04
                                                                                                                                                                                                                 04/05
                                                                                                                                                                                                                 05/06
                                                                                                                                                                                                                 06/07
                                                                                                                                                                                                                 07/08
                                                                                                                                                                                                                 08/09
                                                                                                                                                                                                                 09/10
                                                                                                                                                                                                                10/11f
                                                                                                                                                                                                                11/12f
                          1971/72

                                    1976/77

                                                 1981/82

                                                            1986/87

                                                                      1991/92

                                                                                                        1996/97

                                                                                                                         2001/02

                                                                                                                                   2006/07

                                                                                                                                               2011/12f


                  World                       China (RHS)                                                                                                                                                Surplus/deficit          Production (RHS)

  Source: Rabobank, USDA, 2011                                                                                                                                                           Source: Rabobank, USDA, 2011
Section 3 Agri Commodity Outlooks: Livestock | 45


LIVESTOCK

LIVE CATTLE                                                             LEAN HOGS
                  12-month outlook from spot                                                  12-month outlook from spot


Low case                Base case               High case                  Low case                 Base case                  High case
USD strengthens         Feedlot inventories     La Niña persists           Chinese                  Chinese reduce             Further disease
and US export           fall on tight feeder    past the expected          substantially reduce     demand due to              outbreaks in China
demand falters          supply                  June end                   imports on the back      disease recovery and       result in significant
                                                                           of strong domestic       higher domestic            domestic herd
Packer export profits   Packers continue to     USD weakens                production and a         production                 liquidations
fall and with           make positive profits   further, resulting         stronger USD
negative margins        driven by strong        in stronger-than-                                   Continuing economic        Major importers’
they reduce             export demand           expected export            Bank of Japan            uncertainty results        currencies
purchases                                       growth form                intervenes to            in USD weakness;           appreciate against
                        USD remains weak        emerging markets           weaken the yen           exports remain at          the USD
Brazilian and           against the major                                                           1.68 million tonnes
Australian currencies   importers               Feeder cattle price        Large fall in the corn                              Corn strengthens,
weaken against the                              skyrockets on              price sees producers     Corn prices remain         resulting in
USD and major beef                              persistent drought         increase farrowings      under USD 6.50/lb          producers scaling
importing currencies                            conditions                 and raise herd           and above USD 6/lb         back production
                                                                           inventories


                                      We expect US cattle prices to continue their            in the US, further squeezing packer margins.
                                      strong performance in 2012 albeit with a                Given the poor calving numbers in 2011,
                                      brief plateau in Q1 as record feedlot                   the shortage of feeder cattle is not expected
                                      inventories reach the market. However,                  to be alleviated in 2012. Packers have incurred
                                      tight feeder supply should bias price                   negative margins on domestically sold beef
                                      upwards from spring onward.                             in 2011 but have been able to at least partially
                                                                                              recoup losses on strong Asian exports at
                                      Lean hog prices are expected to flatten
                                                                                              profitable levels. US beef exports jumped
                                      in 2012 as US and global supply increases
                                                                                              strongly in 2011, up over 25% YOY and up
                                      but upside risks remain with strong Asian
                                                                                              9.12% on the five-year average. Our forecast
                                      demand and risk of disease in the Chinese
                                                                                              of a weakening US dollar and relatively
                                      domestic herd. Strong demand from
                                                                                              strong Australian and Brazilian currencies,
                                      emerging-market economies is expected
                                                                                              two of the US’s major competitors in the
                                      to provide robust support for US livestock
                                                                                              beef export market, drive our forecast of
                                      markets in 2012.
                                                                                              improving US beef demand from foreign
                                      Live cattle                                             markets. However, this will also force US
                                      US live cattle prices are expected to fall in           packers to reduce imports of foreign beef.
                                      Q1 2012 from their November 2011 highs
                                                                                              With the anticipated relaxation of import
                                      as record numbers of cattle on feed outstrip
                                                                                              restrictions by Japan and the recent
                                      demand in the near term. A record drought
                                                                                              ratification of the US–Korea Free Trade
                                      in the southern US has left producers with a
                                                                                              Agreement, we see both improved market
                                      severe shortage of pasture and resulted in
                                                                                              access and export demand providing strong
                                      higher placements of feeder cattle this year,
                                                                                              support for US beef prices in 2012. However,
                                      at lighter weights than normal. The
                                                                                              this upside will be somewhat tempered if
                                      September placement of cattle under
                                                                                              economic conditions deteriorate much
                                      600 pounds was 685,000 head, compared
                                                                                              further and emerging-market economy
                                      with 510,000 head in August 2010—a 34%
                                                                                              growth slows.
                                      increase—while in October 2011, the year-
                                      on-year spread narrowed to an 11% increase.             These restrictions currently require US beef
                                      We anticipate the lower weights and increase            cattle to be 20 months of age or younger
                                      in placements will result in a large amount             at the time of slaughter, but under new
                                      of live cattle being brought to market in the           proposals, the maximum import age is likely
                                      early months of 2012 as cattle placed into              to be increased to 30 months. The catalyst for
                                      feedlots in July, August and September of               the relaxation of restrictions has been the
                                      2011 work their way through the system.                 decline in Japan’s domestic beef production
                                                                                              following the tsunami in March 2011 and
                                      Tight supplies of feeder cattle mean that live
                                                                                              resulting radioactive contamination in
                                      cattle prices in Q2 2012 are expected to rise
                                                                                              the Japanese agri complex. With imports
46 | Rabobank Outlook 2012—Down, But Not Out


                                                 of 351 million pounds, Japan was the third-                                               Lean hogs
                                                 largest export market for US beef in 2010.                                                Momentum in the US lean hog market is
                                                 However, their imports in 2010 were 61.7%                                                 expected to wane in 2012 as producers
                                                 below where they were in 2003 at 918 million                                              increase farrowing to meet demand and
                                                 pounds, before restrictions were imposed.                                                 Chinese import growth slows. This is coming
                                                 Japan’s relaxation of the age restriction on                                              off the back of strong bullish momentum in
                                                 US beef opens the market to heavier carcass                                               the US lean hog market in 2011. US herd
                                                 weights. If the yen continues its strong                                                  inventories in 2011 rose by 2.5% in Q3 from
                                                 performance against the US dollar, we expect                                              the traditional seasonal low at the end of Q1;
                                                 there to be strong upside potential for US                                                this is compared with the Q3 2010 rise of
                                                 beef exports into Japan in 2012.                                                          1.6%. Just as the cattle market benefited from
                                                                                                                                           a low US dollar and high export demand, so
                                                 We expect to see the beef cut market
                                                                                                                                           too has the pork industry. Strong export
                                                 continue to exhibit a large spread between
                                                                                                                                           demand in 2011 has helped maintain higher
                                                 Choice and Select cuts in 2012 as seen in the
                                                                                                                                           domestic prices, a situation that will likely
                                                 latter half of 2011. The catalyst for this spread
                                                                                                                                           continue with a weak US dollar in 2012.
                                                 movement has been the entry of Walmart
                                                 into the Choice beef market. Walmart has                                                  Pork producers and processors have been
                                                 long been a retailer of Select cuts, the lowest                                           challenged with slowing margin growth due
                                                 of three USDA grades of beef at the retail level                                          to the upward shift in corn prices. CBOT corn
                                                 in the US. However, in an effort to increase                                              prices averaged 61% higher in 2011 than in
                                                 sales and attract a higher value customer, the                                            2010. As a percentage of total feed cost in the
                                                 world’s largest retailer has added Choice cuts,                                           raising of US lean hogs, corn has risen from
                                                 the midlevel retail cut, to their meat aisle.                                             49.6% to 54.6% due to both the higher corn
                                                 This move has increased the spread between                                                cost and the 11.8% fall in the price of soymeal.
                                                 Choice and Select cuts to a full USD 19/cwt                                               Using a 3:1 feed conversion ratio and
                                                 from a pre-Walmart entry spread of a                                                      assuming a 75% corn feed mix, the cost of
                                                 mere USD 3/cwt. Over 50% of Walmart’s                                                     adding one pound to a hog under the current
                                                 260 billion dollar income came from grocery                                               April 2012 live hog crush is USD 0.42/pound.
                                                 sales in 2010. Given Walmart’s market share,
                                                                                                                                           While US breeding stocks increased 1.3% in
                                                 packers have been bidding up the price of
                                                                                                                                           November, eventual year-on-year expansion
                                                 live cattle, despite negative domestic margins,
                                                                                                                                           is uncertain due to the relatively high price
                                                 in an effort to capture long-term business
                                                                                                                                           of corn. Current lean hog packer margins for
                                                 from the new player in the Choice cut space.
                                                                                                                                           December 2011-April 2012 indicate a profit
                                                 We see the entry of such a retailer into the
                                                                                                                                           of USD 8.58/cwt, a USD 10.27/cwt turnaround
                                                 Choice cut market as being supportive of
                                                                                                                                           from the same crush last year. In the
                                                 prices for 2012 and expect the spread
                                                                                                                                           December-April crush, corn accounts for
                                                 between wholesale boxed Choice cuts
                                                                                                                                           55% of total feed cost, a rise of 5% from the
                                                 and wholesale boxed Select cuts to remain
                                                                                                                                           same crush 12 months ago. November 2010
                                                 stable at current levels.
                                                                                                                                           saw producers working with a corn cost
                                                                                                                                           of USD 60.01/head, which rose to


 Figure 3.28: US beef prices and inflation, Jan 2004-Jul 2011                                   Figure 3.29: US boxed beef cutout value 600 lbs-900 lbs spread,
                                                                                                Nov 2009-Nov 2011
           200                                                               6
                                                                                                          200
           180                                                               5
                                                                                                          190
           160                                                               4
           140                                                                                            180
                                                                             3
                                                                                 index points


           120                                                                                            170
 USD/cwt


                                                                             2
                                                                                                USD/cwt


           100                                                                                            160
                                                                             1
            80
                                                                             0                            150
            60
            40                                                              -1                            140
            20                                                              -2                            130
             0                                                              -3
                                                                                                          120
                  Feb-11
                   Jul-11
                  Jan-04
                 Jun-04
                 Nov-04
                 Apr-05
                 Sep-05
                 Feb-06
                   Jul-06
                 Dec-06
                 May-07
                 Oct-07
                 Mar-08
                 Aug-08
                  Jan-09
                 Jun-09
                 Nov-09
                 Apr-10
                 Sep-10


                                                                                                                                                                                  Jan-11

                                                                                                                                                                                           Mar-11

                                                                                                                                                                                                    May-11

                                                                                                                                                                                                             Jul-11

                                                                                                                                                                                                                      Sep-11

                                                                                                                                                                                                                               Nov-11
                                                                                                                Nov-09
                                                                                                                         Jan-10

                                                                                                                                  Mar-10

                                                                                                                                             May-10

                                                                                                                                                      Jul-10

                                                                                                                                                                Sep-10

                                                                                                                                                                         Nov-10


             Boxed beef Choice cut         US CPI (RHS)                                                   Select cut spot price                                Choice cut spot price

 Source: Rabobank, USDA, Bloomberg, 2011                                                        Source: Rabobank, USDA, Bloomberg, 2011
Section 3 Agri Commodity Outlooks: Livestock | 47


                                                                                               USD 67.14/head in November 2011, though                                                                            Japan, the largest export market for US pork,
                                                                                               the increase in the price of lean hogs more                                                                        increased demand by 14% for the period of
                                                                                               than offset this. This upward movement in the                                                                      January to October compared to the same
                                                                                               lean hog market has been driven, to a large                                                                        period in 2010. The increase in demand was
                                                                                               extent, by strong export demand. The January                                                                       driven by the appreciation of the yen against
                                                                                               to September export figures released by the                                                                        the US dollar. Pork export demand is
                                                                                               USDA report pork exports at 1.68 million                                                                           increasingly exposed to currency fluctuations
                                                                                               tonnes. This equals a 288 thousand tonne                                                                           as the Bank of Japan continues to intervene in
                                                                                               increase year-on-year or a 20.6% increase                                                                          the foreign exchange market and states that
                                                                                               in volume and a 40.5% increase in value.                                                                           it will continue to do so in order to support
                                                                                                                                                                                                                  domestic exports on a lower yen.
                                                                                               There is a risk of weaker pork exports into
                                                                                               China in 2012 as domestic producers recover
                                                                                               from disease outbreaks and scale up
                                                                                               production. This increase in production has
                                                                                               already been seen to a degree, as Chinese
                                                                                               producers reacted to a 139% price rise
                                                                                               in the five months to July 2011. There was
                                                                                               widespread liquidation of the Chinese
                                                                                               domestic hog herd in 2011 due to disease
                                                                                               and this resulted in a larger-than-expected
                                                                                               shortfall in domestic production. In the wake
                                                                                               of this shortage, imports of US pork in China
                                                                                               rose 67.5% in the first three quarters of 2011,
                                                                                               a figure that rises to 376% if Taiwan and Hong
                                                                                               Kong numbers are excluded. Unsurprisingly,
                                                                                               the sharp increase in prices has since resulted
                                                                                               in increased herd-building and increases in
                                                                                               animals brought to market, resulting in a fall
                                                                                               from the June high of CNY 19.8/pound. With
                                                                                               pork considered to be of national strategic
                                                                                               importance to China, the government has
                                                                                               initiated large campaigns to reduce the
                                                                                               outbreaks of foot-and-mouth disease and is
                                                                                               simultaneously seeking to modernise the
                                                                                               production chain, with the ultimate goal of
                                                                                               reaching self-sufficiency.


Figure 3.30: Chinese pork spot prices, Jan 2009-Nov 2011                                                                                                                        Figure 3.31: China’s pork imports volume, Jan 2010-Oct 2011

         21
                                                                                                                                                                                                  70
         19
         17                                                                                                                                                                                       60
                                                                                                                                                                                thousand tonnes


         15                                                                                                                                                                                       50
CNY/kg


         13                                                                                                                                                                                       40
         11                                                                                                                                                                                       30
          9
                                                                                                                                                                                                  20
          7
                                                                                                                                                                                                  10
          5
                                                                                                                                                                                                   0
                                                                                                                          Jan-11
                                                                                                                                   Mar-11
                                                                                                                                            May-11
                                                                                                                                                     Jul-11
                                                                                                                                                              Sep-11
                                                                                                                                                                       Nov-11
              Jan-09
                       Mar-09
                                May-09
                                         Jul-09
                                                  Sep-09
                                                           Nov-09
                                                                    Jan-10
                                                                             Mar-10
                                                                                      May-10
                                                                                               Jul-10
                                                                                                        Sep-10
                                                                                                                 Nov-10


                                                                                                                                                                                                   Jan    Feb    Mar   Apr May Jun      Jul   Aug Sep       Oct    Nov Dec


Note: Spot price is as reported on the Jilin Market                                                                                                                                               3-year range         2011         2010          3-year average

Source: Rabobank, Bloomberg, 2011                                                                                                                                               Source: Rabobank, Bloomberg, 2011
Appendix | 49


            Appendix

Global agri commodity balance sheets
Global corn supply & demand                                         Rabobank                             USDA

(1,000 Ha/1,000 Mt)              07/08        08/09       09/10       10/11f      11/12f      12/13f       10/11f      11/12f

Beginning stocks                 110,069      132,272     147,197     144,047      129,869     120,112     144,047      129,038

Area harvested                   160,534      158,417     157,763     163,221      168,240     168,830     163,221      168,036

Yield                                4.9          5.0         5.2          5.1         5.1         5.2          5.1          5.1

Production                       793,615      798,824     819,607     827,393      855,781     884,505     828,687      858,989

Imports                           98,489       82,587      89,756      91,302       93,311      99,739      90,088       92,111

Total supply                   1,002,173    1,013,683   1,056,560   1,062,742    1,078,962   1,104,357   1,062,822    1,080,138

Exports                           98,614       84,467      96,810      90,140       96,777      99,407      90,451       95,142

Feed consumption                 496,838      479,294     488,656     493,740      507,266     514,935     494,040      508,525

FSI consumption                  275,404      300,851     327,047     348,993      354,806     366,255     349,293      354,901

Total consumption                772,242      780,145     815,703     842,733      862,072     881,190     843,333      863,426

Total use                       870,856      864,612     912,513      932,873     958,850     980,597     933,784      958,568

Surplus deficit                   21,373       18,679       3,904      -15,340      -6,291       3,647     -14,646        -4,437

Ending stocks                    131,317      149,071     144,047     129,869      120,112     123,759     124,300      121,570

Stocks/use                        17.0%        19.1%       17.7%        15.4%       13.9%       12.6%        14.7%        14.1%


Global wheat supply & demand                                        Rabobank                             USDA

(1,000 Ha/1,000 Mt)              07/08        08/09       09/10       10/11f      11/12f      12/13f      10/11f       11/12f

Beginning stocks                 130,646      125,949     167,098     200,905      199,493     204,656     200,905      196,126

Area harvested                   217,908      224,721     227,166     222,627      222,309     221,500     222,627      222,309

Yield                                 2.8         3.0         3.0         2.9          3.1         3.0          2.9          3.1

Production                       611,231      682,190     684,306     648,698      684,049     662,159     648,698      683,299

Imports                          113,666      136,933     133,576     129,847      137,595     137,333     129,847      133,786

Total supply                    855,543       945,072     984,980    979,450     1,021,137   1,004,148    979,450     1,013,211

Exports                          117,416      143,660     135,799     129,188      140,799     139,491     131,373      137,299

Feed consumption                  98,117      117,885     115,662     117,047      128,200     119,556     112,485      126,424

FSI consumption                  515,593      516,870     532,614     534,651      547,482     542,679     539,466      546,888

Total consumption                613,710      634,755     648,276     651,698      675,682     662,235     651,951      673,312

Total use                       731,126       778,415     784,075    780,886      816,481     801,726     783,324      810,611

Surplus deficit                    -2,479      47,435      36,030      -3,430        8,367         -75      -3,253         9,987

Ending stocks                    124,417      166,657     200,905     199,493      204,656     202,422     196,126      202,600

Stocks/use                         20.3%        26.3%       31.0%       30.6%       30.3%       30.6%        30.1%        30.1%


Source: USDA, Rabobank, 2011
50 | Rabobank Outlook 2012—Down, But Not Out


  Global agri commodity balance sheets
  Global soybean supply & demand                                   Rabobank                          USDA

  (1,000 Ha/1,000 Mt)            07/08         08/09     09/10       10/11f    11/12f     12/13f       10/11f       11/12f

  Beginning stocks                62,990        51,423    42,570      59,405    65,680     58,278       59,405       68,368

  Area harvested                  90,674        96,367   102,170     102,757   103,965    105,365      102,757      104,363

  Yield                              2.4           2.2       2.6         2.6        2.5        2.5            2.6        2.5

  Production                     221,006       211,952   260,854     263,106   257,960    263,997      264,180      258,905

  Imports                         78,118        77,376    86,798      88,659    96,206    100,970       88,678       94,206

  Total supply                   362,114       340,751   390,222     411,170   419,846    423,245     412,263       421,479

  Exports                         79,589        76,842    92,596      92,528    98,017    100,467       92,413       96,898

  Crush                          201,819       193,222   209,503     222,369   232,725    234,962      221,109      230,672

  Seed/feed/residual              27,800        28,115    28,718      30,593    30,826     31,126       30,373       30,354

  Total consumption              229,619       221,337   238,221     252,962   263,551    266,088      251,482      261,026

  Total use                      309,208       298,179   330,817     345,490   361,568    366,555     343,895       357,924

  Surplus/deficit                -10,084        -8,851    16,835       6,275     -7,402     -1,588          8,963     -4,813

  Ending stocks                   52,906        42,572    59,405      65,680    58,278     56,690       68,368       63,555

  Stocks/use                       23.0%         19.2%     24.9%       26.0%     22.1%      21.3%        27.2%        24.3%


  Global palm oil supply & demand                                  Rabobank                          USDA

  (1,000 Mt)                     07/08         08/09     09/10       10/11f    11/12f     12/13f      10/11f        11/12f

  Beginning stocks                 4,247         4,081     4,891       5,383     4,827      5,426           5,383     5,322

  Production                      41,084        43,992    45,862      47,925    50,466     52,000       47,930       50,566

  Imports                         30,733        34,151    34,764      34,989    37,834     41,000       35,349       37,834

  Total supply                    76,064        82,224    85,517     88,297     93,127     98,426       88,662       93,722

  Exports                         32,226        34,686    35,641      38,397    39,995     40,950       36,270       38,865

  Food consumption                29,616        31,293    32,583      33,786    35,932     38,088       34,361       35,932

  Industrial/feed                 10,264        11,160    11,910      11,287    11,774     12,400       12,709       13,539

  Total consumption               39,880        42,453    44,493      45,073    47,706     50,488       47,070       49,471

  Total use                       72,106        77,139    80,134     83,470     87,701     91,438       83,340       88,336

  Surplus deficit                   -289         1,004       492        -556       599      1,562             -61        64

  Ending stocks                    3,958         5,085     5,383       4,827     5,426      6,988           5,322     5,386

  Stocks/use                        9.9%         12.0%     12.1%      10.7%      11.4%      13.8%        11.3%        10.9%


  Source: USDA, Rabobank, 2011
Appendix | 51


Global agri commodity balance sheets
Global cotton supply & demand                              Rabobank                            USDA
(1,000 Ha/1,000          07/08         08/09     09/10       10/11f      11/12f     12/13f       10/11f       11/12f
480lb bales)
Beginning stocks          62,266        60,868    60,803      44,238       46,297    54,650       44,238        45,219
Area harvested            32,917        30,591    30,134      33,507       35,443    35,873       33,507        36,048
Yield                           3.6        3.5       3.4         3.4          3.5        3.5            3.4         3.4
Production               119,683       107,081   101,629     115,095      123,070   125,690      115,277       123,888
Imports                   38,959        30,476    36,349      37,000       36,000    35,000       35,654        36,305
Total supply             220,908      198,425    198,781     196,333     205,367    215,340      195,169      205,412
Exports                   39,005        30,065    35,595      37,000       36,000    35,000       35,572        36,325
Loss                       -2,154       -2,633      -162          31         -100      -150             31        -143
Use                      123,329       110,315   119,110     113,005      114,817   119,317      114,347       114,274
Total domestic use       121,175       107,682   118,948     113,036      114,717   119,167      114,378       114,131
Total use                160,180      137,747    154,543     150,036     150,717    154,167      149,950      150,456
Surplus/deficit            -3,646       -3,234   -17,481       2,090        8,253     6,373            930       9,614
Ending stocks             60,728        60,678    44,238      46,297       54,650    61,173       45,219        54,956
Stocks/use                     49%        55%       37%         41%          48%       51%             40%         48%

Global coffee supply & demand                                           Rabobank               USDA

(1,000 60 kg bags)       06/07         07/08     08/09       09/10       10/11f     11/12f       10/11f       11/12f

Beginning stocks          31,900        36,185    27,291       31,071      25,478    31,104       24,418        26,847
Arabica production        81,717        72,734    82,390       73,854      85,450    75,000       85,787        80,125
Robusta production        48,867        46,633    51,842       52,027      54,696    55,981       52,096        54,896
Total output             130,584       119,367   134,232      125,881     140,146   130,981      137,908       135,046
Imports                   97,470        96,809    96,831       93,800     104,000   105,000      104,473       100,574
Total supply             259,954       252,361   258,354     250,752     269,624    267,085      266,799      262,467
Exports                   98,000        96,479    97,303       93,000     103,500   105,000      107,455       102,123
Soluble use               12,857        13,584    12,376       13,144      13,400    13,900       14,694        14,595
Use                      112,912       115,007   117,604      119,130     121,620   124,400      117,803       119,362
Total consumption        125,769       128,591   129,980      132,274     135,020   138,300      132,497       133,957
Total use                223,769       225,070   227,283     225,274     238,520    243,300      239,952      236,080
Surplus/deficit             4,815       -9,224     4,252       -6,393       5,126     -7,319          5,411       1,089
Ending stocks             36,185        27,291    31,071       25,478      31,104    23,785       26,847        26,387
Stocks/use                     29%        21%       24%          19%         23%       17%            23%          22%

Global sugar supply & demand                                                                   Rabobank

(1,000 Mt)               04/05         05/06     06/07       07/08        08/09     09/10        10/11f       11/12f

Beginning stocks          67,553        61,225    63,962       72,699      74,296    62,581       57,889        57,007
Production               141,013       151,079   166,405      166,610     151,779   156,862      165,385       174,017
Imports                   47,056        48,590    46,572       45,318      46,863    53,084       51,183        50,118
Total supply             208,567       212,303   230,367     239,308     226,075    219,443      223,274      231,024
Exports                   49,993        50,414    51,721       51,255      50,993    57,207       56,053        54,138
Consumption              145,169       147,274   153,341      159,947     160,258   160,150      161,397       163,942
Total use                145,169       147,274   153,341     159,947     160,258    160,150      161,397      163,942
Surplus/deficit            -7,093        1,981     7,915         727      -12,610     -7,411          -882        6,054
Ending stocks             61,225        63,962    72,699       74,296      62,581    57,889       57,007        63,062
Stocks/use                     42%        43%       47%          46%         39%       36%            35%          38%

Global cocoa supply & demand                                                                   Rabobank

(1,000 tonnes)           04/05         05/06     06/07       07/08        08/09     09/10        10/11f       11/12f

Gross production            3,381        3,786     3,434        3,740       3,596     3,602           4,302       4,037
  Ivory Coast               1,286        1,408     1,229        1,382       1,222     1,245           1,500       1,290
  Ghana                         599        740       614         729         662        620           1,025        940
Net production             3,256         3,748     3,400       3,694       3,542      3,566        4,259         3,997
Grindings                   3,363        3,527     3,690        3,755       3,508     3,700           3,882       4,025
Surplus/deficit                -107       221       -290         -61          34       -134            378         -28
Ending stocks               1,666        1,906     1,645        1,584       1,618     1,484           1,861       1,833
Stocks/use                     50%        54%       45%          42%         46%       40%            48%          46%

Source: Rabobank, 2011
US agri commodity balance sheets
US corn supply & demand                                                Rabobank                       USDA
(Mln acres/Mln bu.)            06/07     07/08     08/09     09/10      10/11f    11/12f    12/13f     10/11f    11/12f
Beginning stocks                1,967     1,304     1,624     1,673      1,708     1,128       608      1,708     1,128
Area harvested                    70.6      86.5      78.6      79.5       81.4      83.9      86.0       81.4      83.9
Yield                           149.1     150.7     153.9     164.7      152.8     146.3     154.0      152.8     146.7
Production                     10,531    13,038    12,092    13,092     12,447    12,275    13,247     12,447    12,310
Imports                            12        20        14          8        28        15        15         28        15
Total supply                   12,510    14,361    13,729    14,773     14,182    13,418    13,870     14,182    13,453
Exports                         2,125     2,437     1,849     1,980      1,835     1,625     1,800      1,835     1,600
Feed consumption                5,540     5,858     5,182     5,125      4,792     4,700     4,550      4,792     4,600
FSI consumption                 3,541     4,442     5,025     5,961      6,428     6,485     6,596      6,428     6,410
Ethanol use                     2,119     3,049     3,709     4,568      5,020     5,075     5,175      5,020     5,000
Total consumption               9,081    10,300    10,207    11,086     11,219    11,185    11,146     11,219    11,010
Total use                      11,207    12,737    12,056    13,066     13,054    12,810    12,946     13,054    12,610
Ending stocks                    1,304     1,624     1,673     1,708      1,128      608       924      1,128       843
Stocks/use                      11.6%     12.8%     13.9%     13.1%       8.6%      4.7%      7.1%      8.6%       6.7%

US soybean supply & demand                                             Rabobank                       USDA
(Mln acres/Mln bu.)            06/07     07/08     08/09     09/10      10/11f    11/12f    12/13f     10/11f    11/12f
Beginning stocks                  449       574       205       138        151       215       235        151       215
Area harvested                    74.6      64.1      74.7      76.4       76.6      73.7      72.9       76.6      73.7
Yield                           42.85     41.73     39.73     43.98      43.46     41.40     44.00      43.46     41.34
Production                      3,197     2,677     2,967     3,359      3,329     3,050     3,207      3,329     3,046
Imports                              9       10        13        15         14        15        15         14        15
Total supply                    3,655     3,261     3,185     3,512      3,494     3,280     3,457      3,495     3,275
Exports                         1,117     1,159     1,279     1,499      1,500     1,300     1,450      1,501     1,325
Crush                           1,808     1,803     1,662     1,752      1,648     1,625     1,675      1,648     1,635
Seed/feed/residual                157        94       106       110        131       120       110        131       120
Domestic consumption            1,965     1,897     1,768     1,862      1,779     1,745     1,785      1,779     1,755
Total use                       3,081     3,056     3,047     3,361      3,279     3,045     3,235      3,280     3,080
Surplus/deficit                   124      -369        -67        13         64        20       -13         64       -19
Ending stocks                     574       205       138       151        215       235       222        215       195
Stocks/use                      18.6%      6.7%      4.5%      4.5%       6.6%      7.7%      6.9%       6.5%      6.3%

US wheat supply & demand                                               Rabobank                       USDA
(Mln acres/Mln bu.)            06/07     07/08     08/09     09/10      10/11f    11/12f    12/13f     10/11f    11/12f
Beginning stocks                  571       456       306       656        976       863       824        976       863
Area harvested                    46.8      51.0      55.7      49.9       47.6      45.7      46.9       47.6      45.7
Yield                             38.7      40.2      44.9      44.5       46.3      43.8      44.2       46.3      43.8
Production                      1,808     2,051     2,499     2,218      2,207     1,999     2,073      2,207     1,999
Imports                           122       113       127       119         97       120       110         97       120
Total supply                    1,930     2,163     2,626     2,336      2,304     2,119     2,183      2,304     2,119
Exports                         2,501     2,620     2,932     2,993      3,280     2,982     3,007      3,280     2,982
Feed consumption                  117        16       255       150        132       165       145        132       160
FSI consumption                 1,020     1,035     1,005       988        996     1,018     1,009        996     1,018
Total consumption               1,137     1,051     1,260     1,138      1,128     1,183     1,154      1,128     1,178
Total use                       2,045     2,314     2,275     2,017      2,417     2,158     2,169      2,417     2,153
Surplus deficit                  -115      -150       351       318       -113        -39        14      -113        -34
Ending stocks                     456       306       656       976        863       824       838        863       829
Stocks/use                      22.3%     13.2%     28.9%     48.4%      35.7%     38.2%     38.6%      35.7%     38.5%

US cotton supply & demand                                              Rabobank                       USDA
(Mln acres/1,000 bales)        06/07     07/08     08/09     09/10      10/11f    11/12f    12/13f     10/11f    11/12f
Beginning stocks                6,069     9,479    10,051     6,337      2,947     3,257     3,567      2,947     2,600
Area harvested                  5,152     4,245     3,063     3,047      4,360     3,900     3,900      4,330     3,986
Yield                              4.2       4.5       4.2       4.0        4.1       4.1       4.6        4.2       4.1
Production                     21,588    19,207    12,815    12,188     17,850    16,100    17,900     18,104    16,300
Imports                            19        12          0         0        10        10        10           9       10
Total supply                   27,676    28,698    22,866    18,525     20,807    19,367    21,477     21,060    18,910
Exports                        12,959    13,634    13,261    12,037     14,000    12,000    13,500     14,376    11,300
Loss                              303       429      -273         -9         0         0         0        184        10
Use                             4,935     4,584     3,541     3,550      3,550     3,800     3,400      3,900     3,800
Total use                      18,197    18,647    16,529    15,578     17,550    15,800    16,900     18,460    15,110
Net trade                      12,940    13,622     13,261   12,037      13,990   11,990    13,490     14,367    11,290
Surplus/deficit                 3,410       572     -3,714   -3,390         310      310     1,010       -347     1,200
Ending stocks                   9,479    10,051      6,337    2,947       3,257    3,567     4,577      2,600     3,800
Stocks/use                     52.1%     53.9%      38.3%    18.9%       18.6%    22.6%     27.1%      14.1%     25.1%

Source: USDA, Rabobank, 2011
Food & Agribusiness Research and Advisory   Global Financial Markets

Agri Commodity Markets Research (ACMR)      Corporate sales contacts
 Luke Chandler—Global Head                   ASIA—Brandon Ma
 +44 20 7664 9514                            +852 2103 2688
 luke.chandler@rabobank.com                  brandon.ma@rabobank.com

 Keith Flury—Senior Commodity Analyst        ASIA—David Teakle
 +44 20 7664 9676                            +852 2103 2686
 keith.flury@rabobank.com                    david.teakle@rabobank.com

 Erin FitzPatrick—Commodity Analyst          AUSTRALIA—Terry Allom
 +44 20 7664 9540                            +61 2 8115 3103
 erin.fitzpatrick@rabobank.com               terry.allom@rabobank.com

 Nick Higgins—Commodity Analyst              BRAZIL—Sergio Nakashima
 +44 20 7664 9543                            +55 11 5503 7150
 nicholas.higgins@rabobank.com               sergio.nakashima@rabobank.com

Contributing Analysts                        CHILE—Gaston Iroume
 Tracey Allen—Sydney, Australia              +56 2 4498536
 tracey.allen@rabobank.com                   gaston.iroume@rabobank.com

 Dean Smith—Sydney, Australia                EUROPE—David Kane
 dean.smith@rabobank.com                     +44 20 7664 9744
                                             david.kane@rabobank.com
 Paula Savanti—Buenos Aires, Argentina
 paula.savanti@rabobank.com                  EUROPE—Arjan Veerhoek
                                             +31 30 216 9040
 Andy Duff—São Paulo, Brazil                 arjan.veerhoek@rabobank.com
 andy.duff@rabobank.com
                                             MEXICO—Marco Garcia
 Guilherme Melo—São Paulo, Brazil            +52 55 52610029
 guilherme.melo@rabobank.com                 marco.garcia@rabobank.com

 Renato Rasmussen—São Paulo, Brazil          US—Jeff Gibson
 renato.rasmussen@rabobank.com               +1 212 808 6877
                                             jeff.gibson@rabobank.com
 Jean-Yves Chow—Hong Kong, China
 Jeanyves.chow@rabobank.com                  US—Neil Williamson
                                             +1 212 808 6966
 Daron Hoffman — Shanghai, China             neil.williamson@rabobank.com
 daron.hoffman@rabobank.com

 Ken Shwedel—Mexico City, Mexico
 ken.shwedel@rabobank.com

 Pawan Kumar—Singapore, Singapore
 pawan.kumar@rabobank.com

 Scott Colvin—London, UK
 scott.colvin@rabobank.com

 Sterling Liddell—Saint Louis, USA
 sterling.liddell@raboag.com


www.rabotransact.com

©2011 All Rights Reserved. 11/11

Rabobank Outlook2012

  • 1.
    Outlook 2012—Down, ButNot Out Agri Commodity Markets Research
  • 2.
    Outlook 2012—Down, ButNot Out Agri Commodity Markets Research Authors: Luke Chandler luke.chandler@rabobank.com Keith Flury keith.flury@rabobank.com Erin FitzPatrick erin.fitzpatrick@rabobank.com Nick Higgins nicholas.higgins@rabobank.com Rabobank International Disclaimer: This document is issued by Coöperatieve Centrale Raiffeisen-Boerenleenbank B.A. incorporated in the Netherlands, trading as Rabobank International (“RI”). The information and opinions contained in this document have been compiled or arrived at from sources Agri Commodities Market Research believed to be reliable, but no representation or warranty, express or implied, is made as to their accuracy, completeness or correctness. This document is for information purposes only and is not, and should not be construed as, an offer or a commitment by RI or any of its Food & Agribusiness affiliates to enter into a transaction, nor is it professional advice. This information is general in nature only and does not take into account Research and Advisory an individual’s personal circumstances. All opinions expressed in this document are subject to change without notice. Neither RI, nor other legal entities in the group to which it belongs, accept any liability whatsoever for any loss howsoever arising from any use of this document agrimarketsresearch@rabobank.com or its contents or otherwise arising in connection therewith. This document may not be reproduced, distributed or published, in whole www.rabotransact.com or in part, for any purpose, except with the prior written consent of RI. All copyrights, including those within the meaning of the Dutch Copyright Act, are reserved. Dutch law shall apply. By accepting this document you agree to be bound by the foregoing restrictions. © Rabobank International Utrecht Branch, Croeselaan 18, 3521 CB, Utrecht, the Netherlands +31 30 216 0000
  • 3.
    Contents | i Contents Page Section 1 Introduction . . . . . . . . . . . . . . . . . . . . . . . . . . . . . . . . . . . . . . . . . . . . . . . . . . . . . . . . . . . . . . . . . . . . . . . . . . . . . 1 A review of our forecasts for 2011 . . . . . . . . . . . . . . . . . . . . . . . . . . . . . . . . . . . . . . . . . . . . . . . . . . . . . . . . . . . . . . . 3 Section 2 Key themes for agri markets in 2012 . . . . . . . . . . . . . . . . . . . . . . . . . . . . . . . . . . . . . . . . . . . . . . . . . . . . . . 5 Economic slowdown . . . . . . . . . . . . . . . . . . . . . . . . . . . . . . . . . . . . . . . . . . . . . . . . . . . . . . . . . . . . . . . . . . . . . . . . . . . . 5 Biggest losers . . . . . . . . . . . . . . . . . . . . . . . . . . . . . . . . . . . . . . . . . . . . . . . . . . . . . . . . . . . . . . . . . . . . . . . . . . . . . . . . . 5 US and EU to stumble along . . . . . . . . . . . . . . . . . . . . . . . . . . . . . . . . . . . . . . . . . . . . . . . . . . . . . . . . . . . . . . . . . . 6 Emerging markets to drive demand growth . . . . . . . . . . . . . . . . . . . . . . . . . . . . . . . . . . . . . . . . . . . . . . . . . . . 6 Doomsday outcome . . . . . . . . . . . . . . . . . . . . . . . . . . . . . . . . . . . . . . . . . . . . . . . . . . . . . . . . . . . . . . . . . . . . . . . . . . 7 Economic outlook . . . . . . . . . . . . . . . . . . . . . . . . . . . . . . . . . . . . . . . . . . . . . . . . . . . . . . . . . . . . . . . . . . . . . . . . . . . . 8 Speculators and the US dollar . . . . . . . . . . . . . . . . . . . . . . . . . . . . . . . . . . . . . . . . . . . . . . . . . . . . . . . . . . . . . . . . . . . 9 Correlation spike . . . . . . . . . . . . . . . . . . . . . . . . . . . . . . . . . . . . . . . . . . . . . . . . . . . . . . . . . . . . . . . . . . . . . . . . . . . . . 10 Speculators abandon ags . . . . . . . . . . . . . . . . . . . . . . . . . . . . . . . . . . . . . . . . . . . . . . . . . . . . . . . . . . . . . . . . . . . . . 10 Winners and losers . . . . . . . . . . . . . . . . . . . . . . . . . . . . . . . . . . . . . . . . . . . . . . . . . . . . . . . . . . . . . . . . . . . . . . . . . . . . 10 Policy risks . . . . . . . . . . . . . . . . . . . . . . . . . . . . . . . . . . . . . . . . . . . . . . . . . . . . . . . . . . . . . . . . . . . . . . . . . . . . . . . . . . . . . . 12 Fuelling policy speculation . . . . . . . . . . . . . . . . . . . . . . . . . . . . . . . . . . . . . . . . . . . . . . . . . . . . . . . . . . . . . . . . . . . 12 The re-emergence of protectionism . . . . . . . . . . . . . . . . . . . . . . . . . . . . . . . . . . . . . . . . . . . . . . . . . . . . . . . . . . . 13 Grains and oilseeds . . . . . . . . . . . . . . . . . . . . . . . . . . . . . . . . . . . . . . . . . . . . . . . . . . . . . . . . . . . . . . . . . . . . . . . . . . 14 Chinese import policy . . . . . . . . . . . . . . . . . . . . . . . . . . . . . . . . . . . . . . . . . . . . . . . . . . . . . . . . . . . . . . . . . . . . . . . . 15 West Africa . . . . . . . . . . . . . . . . . . . . . . . . . . . . . . . . . . . . . . . . . . . . . . . . . . . . . . . . . . . . . . . . . . . . . . . . . . . . . . . . . . . 15 Elections . . . . . . . . . . . . . . . . . . . . . . . . . . . . . . . . . . . . . . . . . . . . . . . . . . . . . . . . . . . . . . . . . . . . . . . . . . . . . . . . . . . . . 16 Capacity constraints . . . . . . . . . . . . . . . . . . . . . . . . . . . . . . . . . . . . . . . . . . . . . . . . . . . . . . . . . . . . . . . . . . . . . . . . . . . . 17 Supply squeeze . . . . . . . . . . . . . . . . . . . . . . . . . . . . . . . . . . . . . . . . . . . . . . . . . . . . . . . . . . . . . . . . . . . . . . . . . . . . . . . 17 Increased yield volatility . . . . . . . . . . . . . . . . . . . . . . . . . . . . . . . . . . . . . . . . . . . . . . . . . . . . . . . . . . . . . . . . . . . . . . 18 Higher price floors . . . . . . . . . . . . . . . . . . . . . . . . . . . . . . . . . . . . . . . . . . . . . . . . . . . . . . . . . . . . . . . . . . . . . . . . . . . . 19 Section 3 Agri Commodity Outlooks . . . . . . . . . . . . . . . . . . . . . . . . . . . . . . . . . . . . . . . . . . . . . . . . . . . . . . . . . . . . . . . . 21 Base case: Stumbling along . . . . . . . . . . . . . . . . . . . . . . . . . . . . . . . . . . . . . . . . . . . . . . . . . . . . . . . . . . . . . . . . . . . 21 High case: Recovery stronger and faster than expected . . . . . . . . . . . . . . . . . . . . . . . . . . . . . . . . . . . . . . . . 21 Low case: From bad to worse . . . . . . . . . . . . . . . . . . . . . . . . . . . . . . . . . . . . . . . . . . . . . . . . . . . . . . . . . . . . . . . . . . 22 Wheat . . . . . . . . . . . . . . . . . . . . . . . . . . . . . . . . . . . . . . . . . . . . . . . . . . . . . . . . . . . . . . . . . . . . . . . . . . . . . . . . . . . . . . . . . . 23 Corn . . . . . . . . . . . . . . . . . . . . . . . . . . . . . . . . . . . . . . . . . . . . . . . . . . . . . . . . . . . . . . . . . . . . . . . . . . . . . . . . . . . . . . . . . . . . 26 Soybeans . . . . . . . . . . . . . . . . . . . . . . . . . . . . . . . . . . . . . . . . . . . . . . . . . . . . . . . . . . . . . . . . . . . . . . . . . . . . . . . . . . . . . . . 29 Palm Oil . . . . . . . . . . . . . . . . . . . . . . . . . . . . . . . . . . . . . . . . . . . . . . . . . . . . . . . . . . . . . . . . . . . . . . . . . . . . . . . . . . . . . . . . 32 Sugar . . . . . . . . . . . . . . . . . . . . . . . . . . . . . . . . . . . . . . . . . . . . . . . . . . . . . . . . . . . . . . . . . . . . . . . . . . . . . . . . . . . . . . . . . . . 35 Coffee . . . . . . . . . . . . . . . . . . . . . . . . . . . . . . . . . . . . . . . . . . . . . . . . . . . . . . . . . . . . . . . . . . . . . . . . . . . . . . . . . . . . . . . . . . 38 Cocoa . . . . . . . . . . . . . . . . . . . . . . . . . . . . . . . . . . . . . . . . . . . . . . . . . . . . . . . . . . . . . . . . . . . . . . . . . . . . . . . . . . . . . . . . . . 41 Cotton . . . . . . . . . . . . . . . . . . . . . . . . . . . . . . . . . . . . . . . . . . . . . . . . . . . . . . . . . . . . . . . . . . . . . . . . . . . . . . . . . . . . . . . . . . 43 Livestock . . . . . . . . . . . . . . . . . . . . . . . . . . . . . . . . . . . . . . . . . . . . . . . . . . . . . . . . . . . . . . . . . . . . . . . . . . . . . . . . . . . . . . . 45 Live cattle . . . . . . . . . . . . . . . . . . . . . . . . . . . . . . . . . . . . . . . . . . . . . . . . . . . . . . . . . . . . . . . . . . . . . . . . . . . . . . . . . . . . 45 Lean hogs . . . . . . . . . . . . . . . . . . . . . . . . . . . . . . . . . . . . . . . . . . . . . . . . . . . . . . . . . . . . . . . . . . . . . . . . . . . . . . . . . . . . 46 Appendix . . . . . . . . . . . . . . . . . . . . . . . . . . . . . . . . . . . . . . . . . . . . . . . . . . . . . . . . . . . . . . . . . . . . . . . . . . . . . . . . 49
  • 4.
    Section 1 Introduction| 1 1 Introduction Rabobank sees agri commodity prices down, the levels seen in 2008/09. Elevated price but not out, in 2012. Improved fundamental levels must persist in order to encourage balances and uncertain economic conditions farmers to continue expanding production are expected to keep prices below the 2011 to keep pace with demand growth and highs. However, risks to our price forecasts allowing global inventories to rebuild. are skewed upwards as reliance upon Agri commodity demand should remain nontraditional producers pose an increasing robust in 2012 as consumptive growth in threat, and inventories remain near emerging-market economies continues to historical lows. drive the agri complex. Our analysis suggests We believe the long-term bull run in agri that supply side risks, from both weather commodities remains, but expect prices and politics, have increased again for 2012 across the complex to ease from their record and there remains considerable risk of an highs, continuing their downward trajectory inflection in both price and volatility levels in place since mid-2011. Absent further macro amid adverse production conditions across deterioration, prices are unlikely to plunge to the agri complex. Figure 1.1: Rabobank’s 2012 agri commodity price forecasts Q1’11 Q2’11 Q3’11 Q4’11f Spot* Q1’12f Q2’12f Q3’12f Q4’12f Wheat (CBOT) USc/bu 788 748 688 610 579 595 630 615 595 Wheat (Matif) EUR/tonne 253 234 199 170 179 162 175 172 166 Corn USc/bu 674 732 696 620 585 610 645 630 610 Soybeans USc/bu 1,381 1,363 1,358 1,165 1,122 1,178 1,226 1,260 1,251 Soy oil USc/lb 57.0 57.3 55.8 49.4 49.3 48.7 50.2 49.1 47.5 Soymeal USD/ton 260 240 230 300 282 310 290 330 335 Palm oil MYR/tonne 3,681 3,365 3,100 3,000 3,171 2,800 2,900 3,000 3,100 Sugar USc/lb 30.6 24.4 28.7 24.5 23.1 23.5 23.0 22.0 22.0 Coffee USc/lb 258 271 257 230 232 220 200 180 170 Cocoa USD/tonne 3,322 3,042 2,969 2,400 2,246 2,350 2,450 2,350 2,300 Cotton USc/lb 182 168 108 95 91 85 85 80 80 Source: Rabobank, Bloomberg, 2011
  • 5.
    2 | RabobankOutlook 2012—Down, But Not Out We see lower average prices for all agri 1. Economic slowdown commodities covered in our 2012 forecast. 2. Speculators and the US dollar However, we see upside, from depressed spot prices, for corn, wheat, soybeans, sugar and 3. Policy risks cocoa as fundamentals reassert themselves 4. Capacity constraints and market participants continue to come to grips with the European debt crisis. We see Given the heightened uncertainty in the downside to cotton and palm oil prices in the macro environment, we have decided to short term. In the livestock sector we expect frame our price and fundamental forecasts higher live cattle prices and slightly lower lean in base, low and high-case scenarios to hogs prices in 2012. give guidance over the level of confidence around our economic forecasts and macro Our outlook is centred on four key themes level assumptions. for the agri commodity markets in 2012 which we expect to determine commodity prices. Aside from the inherent weather uncertainties in agriculture, we identify these variables as critical for the agri complex over the next 12 months. Rabobank’s 12-month outlook for prices from current levels Soymeal prices are likely to rebound in 2012 after SOYMEAL underperformance relative to soy oil and soybeans in 2011. Soybean prices are likely to be lower YOY in 2012, but SOYBEANS remain historically elevated, rationing demand, as global production declines. US live cattle prices are expected to fall in Q1 2012 from their LIVE CATTLE November 2011 highs as a record number of cattle on feed outstrips demand in the near term. Although lower than 2011 averages, we expect corn prices to rally CORN from current spot prices into Q2 2012 before easing in Q4 2012 on record production. Abundant supply of cocoa beans and better expectations for the COCOA 2011/12 crop are expected to lead prices lower in 2012. The demand profile for soy oil is relatively recession-resistant, SOY OIL which will likely see prices remain elevated in order to slow demand growth. Neutral price direction is expected over the next 12 months as the WHEAT second largest world wheat crop on record softens the fundamental outlook, but coarse grains provide support. Despite our forecast for record large palm oil production in 2012, we PALM OIL expect the low stock levels of total vegetable oils to limit palm oil’s price downside. Momentum in the US lean hog market is expected to wane in 2012 LEAN HOGS as producers increase farrowing to meet demand and Chinese import growth slows. We forecast lower international sugar prices in 2012 as the market SUGAR shifts into a surplus for the first time in three seasons. We expect the global cotton industry to be under pressure and COTTON prices to fall due to the largest global cotton crop on record. Prices are forecast to fall in 2012 due to the large harvests expected COFFEE in Brazil and Vietnam, but diminished stocks will keep risks high.
  • 6.
    Section 1 Introduction| 3 A quick look in the rear-view mirror: A review of our forecasts for 2011 One of the most common questions we get when talking to clients is “how accurate were your forecasts last year?” This is a very valid question, so before we launch into our 2012 agri markets outlook, we would like to share a quick self-evaluation of our performance in 2011—the good, the bad and the ugly. Our 2011 agri markets outlook report, Agri Bull Market Clouded by Macro Uncertainty, released in December 2010, highlighted seven key themes for the year ahead. 1. Tightening inventory levels 2. Supply limitations 3. Demand growth from emerging markets 4. China commodity short 5. Heightened political risk amid tightening food supplies 6. Fundamentals only part of the story 7. Sustained heightened volatility These were the issues we saw as the most important variables likely to influence agri commodity markets in 2011, in addition to constant supply and demand drivers, such as weather vagaries. Overall, these issues all showed varying degrees of relevance in 2011, and many of them will remain relevant in 2012, assuming the absence of major weather events. As last year’s title suggested, from a fundamental viewpoint we held a bullish outlook for the agri complex; our price forecasts showed an expectation of higher prices for all but one market in 2011. Our top picks for 2011 were corn, soybeans and coffee, and as it turned out, two out of three ranked at the top of the list in terms of year-on-year price increases, with coffee the top performer, followed by cotton and corn (see Figure 1.2). Our price forecasts for most commodities were generally accurate in terms of direction, with only cocoa moving against our forecast due to the outlier event of the election crisis in Ivory Coast, which we did highlight as a risk, and which created an unexpected rally for prices. Interestingly, as the situation has normalised and supply chains have restocked, prices have tracked in line with our forecast curve, albeit at an elevated level (see Figure 1.3). The other major event of 2011 was the hottest July the US Midwest has seen in over 50 years, which reshaped the supply side of the balance sheet for the grains complex. This extreme weather event resulted in both a production forecast downgrade of over 10% and significantly higher prices. Since April, our price forecasts have reflected a much tighter balance sheet and have quite accurately indicated Q2 as a turning point with quarter-on-quarter declines forecast for Q3 and Q4 (see Figure 1.4). Figure 1.2: Rabobank 2011 forecasts (December 2010) vs. actual, 2011 Rabobank 2011 forecasts (December 2010) Actual Q1’11 Q2’11 Q3’11 Q4’11 Q1’11 Q2’11 Q3’11 Q4’11 Wheat USc/bu 700 680 675 675 788 748 688 610 Corn USc/bu 600 580 550 540 674 732 696 620 Soybeans USc/bu 1,300 1,275 1,200 1,185 1,381 1,363 1,358 1,165 Soy oil USc/lb 53 54 52 52 57 57 56 49 Soymeal USD/ton 355 350 345 340 367 354 353 300 Palm oil MYR/tonne 3,650 3,200 2,900 2,750 3,681 3,365 3,100 3,000 Sugar USc/lb 28 26 24 22 31 24 29 25 Coffee USc/lb 195 195 190 185 258 271 257 230 Cocoa USD/tonne 2,550 2,450 2,350 2,300 3,322 3,042 2,969 2,400 Cotton USc/lb 135 115 90 85 182 168 108 95 Source: Rabobank, Bloomberg, 2011
  • 7.
    4 | RabobankOutlook 2012—Down, But Not Out Figure 1.3: ICE NY Cocoa; Rabobank forecast vs. actual prices, Figure 1.4: CBOT Corn; Rabobank forecast vs. actual prices, 2010-11 2010-11 3,400 800 750 3,200 700 3,000 650 600 USD/tonne USc/bu 2,800 550 500 2,600 450 2,400 400 350 2,200 300 Q1'10 Q2'10 Q3'10 Q4'10 Q1'11 Q2'11 Q3'11 Q4'11 Q1’10 Q2’10 Q3’10 Q4’10 Q1’11 Q2’11 Q3’11 Q4’11 Actual Dec 2010 forecast Actual Dec 2010 forecast Apr 2011 forecast Source: Rabobank, Bloomberg, 2011 Source: Rabobank, Bloomberg, 2011 Our most accurate price forecasts across the year were for oilseeds (soybeans, soymeal, soy oil and palm oil) and wheat, where negative supply-side issues were less of a factor (see Figure 1.5). Our least accurate forecasts were two of the ‘COs’, cotton and coffee, where despite the direction of the forecast being correct, the magnitude of the price increases was well above our expectations. Figure 1.5: Rabobank quarterly average price forecasts vs. actual price moves in 2011 70 60 50 40 percent 30 20 10 0 -10 -20 Wheat Corn Soybeans Soy oil Soymeal Palm oil Sugar Coffee Cocoa Cotton Rabobank December 2010 forecast Actual Source: Rabobank, Bloomberg, 2011 Our commodity price forecasts are provided as a guide to demonstrate our expectations for price direction throughout the year—regularly updated in our Agri Commodity Markets Research Monthly reports. In view of the level of volatility in the macroeconomy and the general uncertainty in 2011, our forecasts from a year ago have turned out to be reasonably accurate. Our bias for higher prices in the complex proved correct and our top picks—corn, soybeans and coffee— performed better than expected. The seven key themes we identified all played a role in price movements during 2011, most notably supply limitations and heightened political risk due to their impact on corn and cocoa prices. As these risks intensified in Q1 2011, our price forecasts were more accurately revised higher while maintaining a downward bias towards the end of 2011. Although our forecasts for 2H 2011 appeared bearish against market estimates and the futures forward curve, our expectations for more balanced fundamentals and an easing in prices have largely played out, and we expect this to continue into 2012.
  • 8.
    Section 2 Keythemes for agri markets in 2012 | 5 2 Key themes for agri markets in 2012 Economic slowdown Biggest losers Slowing global economic growth in 2012 We anticipate an increased supply of many will only have a modest impact on agri agri commodities to result in lower prices in commodity prices as resilient emerging- 2012, but we do not expect a price collapse market demand offsets anaemic growth due to supportive demand and only a modest expectations in the developed world. build-up of inventories. However, as supply is We expect commodities that have a large forecast to be historically tight for many agri speculator long position and those with commodities, we anticipate supply-side a high correlation to global growth, concerns to remain a major supportive factor including livestock and cotton, to be the for most markets, especially coffee and corn. most vulnerable to slowing global growth. On the demand side of the ledger, we expect Commodities with a stable demand base lower international prices to encourage buying and supportive fundamentals, such as corn and stock-building. In our view, demand loss in and coffee, are expected to be the least the developed world will be inconsequential exposed to a contraction in economic growth. even with an economic downturn, as lower prices encourage commercial buying. Rabobank sees continued macro uncertainty Demand growth in emerging markets is with stagnant growth prospects in the EU expected to remain robust and a driver and the US, and resilient but weaker of prices in the agri complex. expansion in the emerging-market economies in 2012 (see Figure 2.1). We view We see the cotton and livestock markets the prospect of a return to recession as a as most vulnerable to economic contraction considerable risk for both the US and the EU, and stagnant growth. Total meat and fish but we expect any contraction to be shallow. consumption in the US peaked in 2004 and As industry and governments are aware of has been declining ever since due to altered the recession risk and are positioned diets and reduced incomes. This trend is being defensively, we expect a downturn to be countered by increased meat and fish small. Our emerging-market growth forecast consumption in emerging markets, which is projects a level of growth similar to what was more than enough to offset the reduction in seen in the first half of the decade, and while US consumption. In our view, the higher the emerging markets are not likely to be able valued livestock markets will be exposed to to decouple from the developed world, we demand loss if there are further reductions to see domestic consumption prospects and household incomes in the US. The high share proactive governments as reasons these of speculators in the livestock futures markets economies will avoid being dragged into a is also viewed as a threat since a risk-off sell- recession by the developed world economies. off could pressure the markets. The speculator net long in the US livestock markets of
  • 9.
    6 | RabobankOutlook 2012—Down, But Not Out 15 November represented 22% of total open US and EU to stumble along interest, up from 9% in early June, and up Rabobank’s macro economists are forecasting from the 2011 average of 18%. Given the economic growth in the US to be slightly fundamentals, there is a compelling reason lower in 2012 as political deadlock and for livestock values to be elevated currently, waning consumer confidence result in but we see the market as particularly economic stagnation. Gross domestic product vulnerable to macro risks. Since cotton is a (GDP) in the US is forecast to grow at 1.5% in consumer product, the cotton market is also 2012, down from 1.7% in 2011 and down highly susceptible to recession, and given the from 3.0% in 2010. In the EU the outlook is forecast fundamentals in the new season, we bleaker; we expect debt concerns and stalling see heightened downside risk. Cotton prices member economies to bring about only slim on the NY market have fallen during the last positive growth. EU GDP is expected to slow seven US recessions going back to 1970 to 0.4% in 2012 from the 1.6% expected in (see Figure 2.2). Cotton prices are forecast 2011 and the 1.8% expected in 2010. Our lower in 2012 due to better supply and modest growth forecast assumes the EU will lacklustre demand, but weakening economies have found a lasting resolution to the debt could extenuate the downside correction. crisis. Elevated risks remain skewed to the downside for both regions as unemployment Differing underlying fundamentals as well remains high, market sentiment is weak and as diverse income elasticities of demand social unrest is rising. will result in varied price reactions among commodities during recessionary events. We We forecast limited demand loss for agri expect the main economies of the world to commodities in both the EU and the US remain out of recession in 2012, but as risks of even in the face of a double-dip recession. a double-dip recession in both the US and the Although real incomes are declining in the EU are high, we have reviewed the potential US and unemployment is high in both response in the agri complex. In general, regions, food remains a small part of recessions do not impact agri commodities discretionary incomes and the consumption uniformly. In fact, supply dynamics are much of most agri commodities is anticipated more important for price movements, and to be stable. High-value products such as this is expected to be the case in the event of livestock or consumer-oriented cotton are a recession in 2012. Recessions have little the most exposed to economic risk and effect on the demand side in the developed could be threatened depending on the world and economic contractions do not scale of a downturn. generally impact supply, which is much more Emerging markets to drive demand dependent on long-term prices and weather. growth The downside risk for commodities is much Rabobank anticipates emerging-market larger if a sizeable slowdown in emerging growth to ease in 2012 but demand growth markets occurs, as this is the source for much in agri commodities to remain strong. We of the expected expansion in consumption. foresee economic growth rates in the Figure 2.1: Rabobank GDP quarterly growth estimates and Figure 2.2: Performance of the S&P GSCI Agriculture Index over forecasts, Q1 2000-Q3 2012 the past seven US recessions, Dec 1969-2009 15 600 10 500 400 percent 5 300 0 200 -5 100 0 -10 Oct-11 Apr-01 Apr-73 Oct-76 Apr-80 Oct-83 Apr-87 Oct-90 Apr-94 Oct-97 Oct-04 Apr-08 Dec-69 00Q1 01Q1 02Q1 03Q1 04Q1 05Q1 06Q1 07Q1 08Q1 09Q1 10Q1 11Q1 00Q3 01Q3 02Q3 03Q3 04Q3 05Q3 06Q3 07Q3 08Q3 09Q3 10Q3 11Q3e 12Q3f 12Q1f e=estimate; f=forecast US Euro area China Brazil S&P GSCI Agriculture Index Recession Source: IMF, Rabobank, 2011 Source: Bloomberg, Rabobank, NBER, 2011
  • 10.
    Section 2 Keythemes for agri markets in 2012 | 7 emerging markets to hover near the bottom is significant as household incomes increase of levels seen just before the financial crisis and demand changes from staple grains to of 2008/09, with emerging-market growth more protein from meat. The higher share forecast at 6.5% for 2012, down modestly of income devoted to food in China is also a from 6.9% in 2011 and 7.8% in 2010, but threat as higher prices can result in significant modestly higher compared with the 2000- demand destruction. The ongoing 2005 average of 6.0%. In our view, the demographic and agricultural conversion emerging-market economies will not be from a rural population and fragmented able to decouple from a slowdown in the production to an urban population and developed world, but increasing domestic intensive food production will continue in demand will play a larger role in growth and 2012. Domestic inflation of food prices is will be supportive for the agri complex. For forecast to ease in 2012 as international agri Brazil, we expect GDP growth in 2012 of 3.6%, commodity prices fall. This is likely to support flat from 3.6% in 2011, and we continue to further increases in demand in China. In our see global demand for agri commodities view, elevated agri commodity prices resulted as a driving force in the Brazilian economy. in Chinese government destocking in 2011. The changing diets and increasing urban The need to restock inventories will be a population in the emerging markets are supportive impact for prices and is expected expected to remain the drivers for the agri to occur despite the modest forecast complex. Demand for oilseeds in emerging downturn in economic growth. markets has grown 110% since 1999 while in Doomsday outcome the developed world the increase has been Rabobank views the likelihood of a recession 12% (see Figure 2.3). Increasing consumption or major contraction of the Chinese economy of agri commodities in emerging markets has in 2012 as very slim. However, a contraction played a major role in tightening balance would have major consequences for both the sheets despite large global harvests in the global economy and the agri commodity past two seasons, and we expect this trend complex. Given the Chinese government’s to continue in 2012. readiness to spend vast reserves to A slowdown in the key Chinese economy in support the economy and to acquire agri 2012 is not expected to impact the growth commodities to alleviate high domestic prices in agri commodity demand as inventories and avert social unrest, we would expect are low for many commodities, inflation the agri complex to remain supported even is elevated and the government has the in the case of slower-than-anticipated means and will to secure supplies on the economic growth. A hard landing for China international market to temper and even would have profound negative impacts on control domestic food prices (see Figure 2.4). the agri complex, but any contraction event Food costs represent a higher share of would likely only have short-term impacts household income in China relative to the on the market. US or the EU. This is an opportunity since the potential to increase agri commodity demand Figure 2.3: Oilseed consumption EU and US vs. BRICs, Figure 2.4: Global GDP and agri commodity demand indexed, 1999/00-2011/12f Dec 1986-Dec 2010 160 300 500 150 450 140 250 400 130 350 million tonnes Dec 1986 = 100 Dec 1986 = 100 120 200 300 110 250 100 150 200 90 150 80 100 100 70 50 60 50 0 Dec-86 Dec-88 Dec-90 Dec-92 Dec-94 Dec-96 Dec-98 Dec-00 Dec-02 Dec-04 Dec-06 Dec-08 Dec-10 99/00 00/01 01/02 02/03 03/04 04/05 05/06 06/07 07/08 08/09 09/10 10/11 11/12f Corn demand Soybeans demand US and EU BRICs Sugar demand Global GDP (RHS) Source: Rabobank, USDA, 2011 Source: USDA, Rabobank, IMF, 2011
  • 11.
    8 | RabobankOutlook 2012—Down, But Not Out Economic outlook Recession or slowing economic growth will be a threat to the agri commodity markets in 2012, but in our view the expected resilient demand growth from many agri commodity markets in emerging economies will help mitigate the impacts from any economic downturns. We anticipate lower-than-average stock levels of many agri commodities to support prices; while harvests are expected to be large, encouraged by the high prices, the supply response is still catching up to demand. In our view, a recession, if it does occur, would be expected to be shallow and not to impact agri commodity demand. However, cotton is viewed as more susceptible to a downturn, and livestock consumption can also be impacted by recession, but we see emerging-market demand expansion as more than sufficient to make up for demand losses in the developed world. We anticipate lower prices in 2012 as a function of better supply; this will support demand despite the heightened global macro uncertainty.
  • 12.
    Section 2 Keythemes for agri markets in 2012 | 9 Speculators and the US dollar likely against most other commodities in Weak fundamentals for the US dollar should 2012. Loose monetary policy conditions in produce a period of further devaluation the US following two rounds of quantitative versus most other currencies throughout easing in 2008 and 2010, ongoing record 2012, providing upside support for most low interest rates, high unemployment and agri markets. But as we have seen in 2011, anaemic growth expectations for the US fundamentals do not always matter. economy are expected to see most other Rabobank’s base-case macro and foreign currencies outperform the US dollar over exchange forecasts suggest that a weaker the next 12 months. However, we do expect US dollar environment will reappear again to see some recovery of the US dollar against in 2012. While global financial market and major commodity currencies in 2012, which macroeconomic uncertainty remain a we believe are overvalued. significant risk to our forecasts, particularly These weaker fundamentals for the US dollar if the trend of widespread risk aversion look set to reassert themselves in 2012, and continues from 2011 into 2012, a generally while the US Federal Open Market Committee weaker US dollar should be a supportive (FOMC) has not indicated they will implement factor for the agri complex in the year ahead. another round of quantitative easing stimulus Unsurprisingly, we do not expect the (QE3) at this stage; they have not ruled it weakness of the US dollar to be uniform out either, and we expect this to remain in in magnitude or even direction, with the play throughout 2012. Even without QE3, potential for short-term upside against US Federal Reserve policy measures look the euro afflicted by political paralysis and set to remain loose, with US Federal Reserve disunity in the member bloc. However, against Chairman Bernanke explicitly stating that other currencies we see further downside for the federal funds rate was set to remain at the US dollar from current levels, improving an “exceptionally low level at least through both the purchasing power of emerging- mid-2013” given conditional economic , market importers and the competitiveness conditions. Our forecasts do not see a case of US agricultural exporters against many for strong enough growth in 2012 to move of their key competitors (see Figure 2.5). We FOMC policy from current levels. A risk to would expect most prices within the agri this view is the possibility that the European complex to appreciate in a weaker US dollar Central Bank could become the lender of environment. We highlight corn, wheat, last resort which would have a longer term soybeans and lean hogs as the biggest drag on the euro, balancing the poor US winners in the complex as the US export dollar fundamentals. market improves on a weaker dollar. Recovery from the current challenges appears Once the dust settles on the EU debt crisis, likely to be protracted and hence we see we expect focus to return to weaker loose monetary policy and a weak US dollar fundamentals for the US dollar, with downside as capable of buttressing the US economy. Figure 2.5: Rabobank FX forecasts, 2012 Q1’12 Q2’12 Q3’12 Q4’12 EUR/USD 1.33 1.39 1.45 1.48 USD/JPY 78.00 79.00 82.00 83.00 GBP/USD 1.56 1.62 1.69 1.74 USD/CHF 0.93 0.90 0.90 0.91 AUD/USD 1.00 0.98 0.97 0.95 NZD/USD 0.76 0.75 0.74 0.73 USD/CAD 1.00 0.99 0.98 0.98 Source: Rabobank, 2011
  • 13.
    10 | RabobankOutlook 2012—Down, But Not Out ‘Flight to safety’ has become a common complex and key macro indicators jumping catch cry in 2011 and, given the ongoing sharply to reflect the focus of the EU debt macroeconomic uncertainty, risk aversion crisis (see Figure 2.7). As this continues to may well continue to be a key theme in 2012. play out, we expect uncertainty to remain This macro uncertainty—primarily the result elevated, resulting in a continuation of high of the EU debt crisis, but also influenced by correlation between most asset classes bipartisan politics in the US and mounting continuing into 1H 2012. worries of a Chinese economic slowdown— Speculators abandon ags has created a risk-on/risk-off trading Speculative money flows will largely be environment in all markets over the past determined by the macro environment in 12 months. Risk-off has meant a withdrawal 2012, with a clear resolution in the euro area of funds from emerging market assets and needed to restore confidence levels amongst currencies, as they are perceived to be higher investors. Over the past 12 months, we have in risk than the US dollar, despite growth seen diverging dynamics: the first half of the prospects in these markets remaining much year saw surging agri markets attracting stronger than in most developed economies. additional investor inflows as an inflationary For agricultural prices, this has compounded hedge amid rising world food prices, while a price volatility as speculators have not only flight to safety resulted in significant net shifted into and out of the underlying agri outflows of investor capital from agri markets markets, but also between the commodity in the second half of the year. Looking ahead, currencies and the US dollar (see Figure 2.6). a sudden and complete return of investor Looking ahead to 2012, the challenge money into the agri complex appears becomes one of macro uncertainty and diminished as the macro uncertainty is likely whether we continue to see periods of to remain for some time to come. We also extreme risk aversion continuing in 2012. expect there will be less of a constructive Correlation spike fundamental story in agri markets in 2012 as The extreme macro uncertainty has resulted fundamentals appear more in balance than in in all asset classes becoming even more recent seasons. intertwined over the past 12 months. Broader Winners and losers themes such as liquidity, political risk, financial Based on Rabobank’s forecast of a weaker US stability, austerity measures and social unrest dollar against most developed and emerging- have all resulted in agri markets, currencies, market currencies over the next 12 months, equities and other asset classes becoming commodities produced and exported from highly correlated for most of 2H 2011. Recent the US are the most likely to benefit. Further developments have escalated fears of devaluation of the US dollar in 2012 will add contagion. Globally, there are considerable support to what we expect to be resilient concerns as to whether individual commodity emerging-market demand for agricultural or asset class fundamentals have become commodities (see Figure 2.8). Recent years mostly irrelevant as focus has shifted from risk have seen considerable decoupling of appetite to risk aversion. In September 2011, emerging-market currencies from the US we saw the correlations between the agri Figure 2.6: Managed money net long positions in agri Figure 2.7: Correlation between the agri complex and key macro commodities vs. S&P GSCI Agriculture Index, Jan 2007-Nov 2011 indicators, Jan 2007-Sep 2011 600 1,400 0.7 daily price correlation to MSCI World Index 550 1,200 0.6 S&P GSCI Agriculture Index 500 1,000 0.5 thousand contracts 450 800 0.4 400 600 0.3 350 400 0.2 300 200 0.1 250 0 0 Jan-11 May-11 Sep-11 Jan-07 May-07 Sep-07 Jan-08 May-08 Sep-08 Jan-09 May-09 Sep-09 Jan-10 May-10 Sep-10 2007 2008 2009 2010 2011 Sep-2011 S&P GSCI Agriculture Index CBOT Corn NY ICE Sugar S&P GSCI Agriculture Index Managed money net long (RHS) CBOT Wheat Average (Rabobank coverage) Source: CFTC, Bloomberg, 2011 Source: Rabobank, Bloomberg, 2011
  • 14.
    Section 2 Keythemes for agri markets in 2012 | 11 dollar, which enables additional purchasing power in a weaker US dollar environment. In the instance of China, one of the key destinations for US agricultural exports, looser regulatory control has seen the Chinese renminbi gain 7%-8% versus the US dollar since mid-2010 and over 23% since 2005. We are forecasting a near-record 4 million tonnes of corn to be exported to China in the 2011/12 season and, given domestic supply concerns and inflationary pressure from historically high grain prices, a weaker US dollar versus the renminbi may encourage further imports to help meet burgeoning domestic demand. Similarly, we also see additional demand support from a weaker US dollar for soybeans, pork and beef. A weaker US dollar can also alter trade flows by providing improved competitiveness for US agricultural exports on the world market. Commodities we see as most likely to benefit from this are the key US grains and oilseeds such as corn, soybeans and, to a lesser degree, wheat. US beef and pork exports will also likely benefit from a devaluation of the US dollar, although market access tends to be a more potent determining factor for these markets. While the US dollar is forecast to weaken against most currencies, we are forecasting it to strengthen against the Australian and New Zealand dollars and to hold fairly stable relative to the Canadian dollar. Although these commodity currencies are generally defined by their economies’ reliance on metal and energy exports, agricultural exports from these countries can compete with US exports for global market share. For example, wheat exports from Australia will likely benefit from a weakening Australian dollar relative to the US dollar. Figure 2.8: USD index and S&P GSCI Agriculture Index, 1993-2011 120 550 110 450 100 350 90 250 80 70 150 2001 2011 1993 1995 1997 1999 2003 2005 2007 2009 USD index S&P GSCI Agriculture Index Source: Rabobank, Bloomberg, 2011
  • 15.
    12 | RabobankOutlook 2012—Down, But Not Out Policy risks world will see pressure to cut subsidies to Global agricultural markets are being farmers who are operating in an environment increasingly politicised, impacting global of near-record agri market prices. With this agricultural trade, contributing to heightened in mind, forecasting the political risks to the supply uncertainty and lifting price volatility. world’s food basket, and the prices at which Geopolitical factors, such as the 2010/11 it is available, will become a more complex Black Sea region grain export bans, and a task in 2012. return of civil war to the Ivory Coast, had We see corn and cocoa as especially significant impacts on agricultural markets vulnerable to political risks in 2012, although (see Figure 2.9). We believe that 2012 will fundamentals are improving for both as once again see political intervention as an producers responded to higher prices by important determiner of winners and losers increasing production in 2011. The risk in the agri complex. spectrum for the agri complex is skewed It is important to note the difference between further upward in 2012 as political risks pose the ongoing political battles in the arena of larger threats to global trade balances. general fiscal policy and political changes Fuelling policy speculation directly applicable to the agri complex. The 2012 US Presidential Elections represent Our particular focus is on the potential the largest potential stumbling point for US for protectionist responses to exaggerate agricultural support mechanisms in several supply shocks. years. Despite market rhetoric, the US has the Protectionist responses to weather anomalies, fourth-lowest producer support estimate as which are likely to increase as the threat of a percentage of GDP in the OECD, indicating climate change looms larger, are on the rise. comparatively low net transfers to the agri Market sensitivity to rising food inflation in complex. However, as rounds of budgetary the developing world is increasing. Upcoming negotiations should bring about substantial presidential elections in the US pose a risk reductions in US agricultural subsidies from to renewable fuel subsidies. Perhaps most 2012 onwards, support is likely to decrease important of all, the over-indebted developed even further. Figure 2.9: Policy risk hotspots in 2012 Black Sea region export bans Chinese strategic reserves Ethanol policy review and self-sufficiency Sugar export quotas to support domestic prices Civil wars and cocoa-OPEC Export tariffs and industrial action Source: Rabobank, 2011
  • 16.
    Section 2 Keythemes for agri markets in 2012 | 13 The biggest unknown, and a potential risk Because the blender’s credit is unlikely to for prices for the agri complex in 2012, is be extended and the RFS2 is unlikely to be the US corn ethanol/biodiesel policy. Ethanol repealed, we believe that policy risks only demand for corn, which in 2010/11 eclipsed pose marginal risk to corn ethanol production domestic feed consumption for the first time, in 2012, with spot- and implied future margin is currently supported through three major analysis showing that distilling and blending mechanisms: ethanol in the US is currently a profitable endeavour (see Figure 2.10). This runs against • Tax credit for blending ethanol with common perception, which still suggests that gasoline, known as the blender’s credit is, ethanol blending would suffer immensely currently USD 0.45/gallon. This is expected without the blender’s credit. This being said, to expire at the end of 2011. there remains announcement risk, which • The expanded Renewable Fuels Standard could drive down ethanol production and (RFS2) mandates levels of renewable fuel prices in the short term as the agri complex blending, but caps the level of corn starch adjusts to a changed operating environment. ethanol. Production above this level does Global oil policy has a strong impact on the not contribute towards the total mandate. agri commodities complex, both through For 2012, the mandate is 15.2 billion demand, as it affects global economic growth, gallons, of which no more than 13.2 billion and more directly through driving half of the gallons, approximately equivalent to ethanol profitability equation. Following 4.9 billion bushels of corn, can come from stimulus programmes introduced by Saudi corn starch ethanol. Arabia during the Arab spring of 2011, it is • A USD 0.54/gallon import tariff to support likely that OPEC will calibrate production the domestic industry. As imports are not through the 2012 calendar year to maintain currently economical, we do not consider prices of USD 100/barrel or higher to try to the import tariff a crucial piece of the maintain a moderate fiscal surplus in the ethanol puzzle in the current environment. coming years. All else remaining equal, at This is expected to expire at the end these levels, we would need to see corn prices of 2011. at USD 6.80/bushel before US ethanol distillery profits turn negative on a spot basis The current environment sees an increased and capacity is taken off-line. risk of a political turnaround, and subsequent repeal, of supportive policies in the US The re-emergence of protectionism compared to recent years. However, there The increasing reliance on nontraditional have been remarkably few cases of federal exporters to meet the world’s agricultural laws being repealed in US history and this demand leaves a number of markets in the gives us little reason to expect that the RFS2 agri commodity complex more vulnerable mandate will be wound back, reformed or to supply-side shocks through policy repealed in 2012, as congressional vested intervention. Compounding this price risk is interests are likely to prove more powerful the fact that we continue to see historically than the anti-deficit lobby. low inventory levels for a number of Figure 2.10: US ethanol profitability estimates, Jan 2008-Jan 2012f Figure 2.11: Commodity risk profiles, 1980/81-2011/12f 1.0 2.0 1.8 Trade-weighted risk assessment 1.6 0.5 1.4 USD/gallon 1.2 0.0 1.0 0.8 Refinery purchasing of December ethanol in 0.6 -0.5 regulatory arbitrage 0.4 before tax credit expiry 0.2 -1.0 0 80/81 83/84 85/86 87/88 89/90 91/92 93/94 95/96 97/98 99/00 01/02 03/04 05/06 07/08 09/10 11/12f Jan-08 Jan-09 Jan-10 Jan-11 Jan-12f Producer margin Blender spread Corn Wheat Soybeans Source: Rabobank, Bloomberg, 2011 Source: Rabobank, Polity IV Project, USDA, Food and Agriculture Organization of the Note: Blender spread is the price of RBOB Gasoline-Denatured Ethanol, which approximates United Nations, 2011 the blending operating profit of US oil refineries. Producer margin is the estimate of the profitability.
  • 17.
    14 | RabobankOutlook 2012—Down, But Not Out commodities, with protectionist policy becomes an increasing aim of the decisions more easily resulting in trade government. The risk of an economic deficits or supply shortages. Supply slowdown and a reduction in support also tends to be less reliable in these programmes would have only a marginal nontraditional export countries due to effect on imports, as the government weather vulnerabilities, logistical constraints would remain incentivised to encourage and a lower degree of social stability, all domestic consumption. factors which lend themselves to a greater Grains and oilseeds tendency towards political intervention. In 2012, a record share of world grain exports Unsurprisingly, this results in markets having will come from the Black Sea region and to factor in risk premiums to account for the South America, potentially surpassing the uncertainty for both producers and share of the EU and the US (see Figure 2.12). consumers, thereby heightening near- This creates higher political risk and volatility term volatility. in markets as they grapple with the feast or We see grains, oilseeds and cocoa as the famine nature of exports from these rapidly commodities in the agri complex most at risk developing regions. in 2012. Our custom assessment of trade- A large part of this political risk is derived weighted geopolitical risks for sections of from the grains complex being regarded as the agri complex highlights the increasing a strategic national imperative, particularly political risk inherent to the corn and true for the Black Sea region. This leaves soybeans markets as marginal production agri markets increasingly dependent on shifts from the developed to the developing interventionist governments in the Black world (see Figure 2.11). We have generally seen Sea region, the main exporters of which improving risk profiles for soft commodities are Russia, Ukraine and Kazakhstan. Best though they have higher absolute levels, demonstrating their potential for despite being exacerbated by higher protectionist actions were the export bans exportable quantities which skews our metric imposed by Russia from 2010 to 2011, higher. Low stocks-to-use ratios across the Kazakhstan in 2008, and Ukraine in 2007 agri complex would further aggravate the and 2010/11. price effects of any changes in the political situation in the agri complex, such as: Additionally, the Ukrainian government recently enacted laws to facilitate control over • The potential for grain export bans or the the country’s exports in conjunction with a resumption of prohibitive export tariffs relaxation of export duties. The fact that in the Black Sea region is compounded CBOT Wheat prices rose 15.6% in the two by the likelihood the policies of the days spanning the imposition of the Russian constituent countries would move export ban demonstrates the immediate in parallel. impact such moves can have on markets. • With large shares of global grain and This move came in spite of market oilseed supply flowing from Brazil positioning already anticipating a yield and Argentina, there is a possibility that reduction of 8% following the previous a particularly damaging La Niña could month’s USDA WASDE report. encourage these governments to enact As the trend towards an increasingly policies to support domestic stocks and important role of nontraditional and more usage. Trucking industrial action in risky suppliers continues, substantial risk Argentina in October 2011 highlighted premiums have been, and must continue this susceptibility. Prohibitive export tariffs to be, built into grain and oilseed prices. on soybeans in Argentina continue to Increasingly strong buying from major create tension between the government importers will ensure that any supply and farmers. disruptions from these regions will be met • West Africa remains politically volatile and with significant price rises. we see further protectionist steps being As marginal increases in world production taken in 2012 as Ivory Coast considers come increasingly from countries with higher establishing a single-buyer policy. levels of political risk, the market tends to Production concentration in this region apply higher risk premiums to prices in the heightens this risk. short term as the chance of supply • Changes in Chinese engagement in the disruptions increases. We see this tendency import market are likely to be supportive being compounded by political of prices, as domestic food-price stability overreactions, mainly taking the form of
  • 18.
    Section 2 Keythemes for agri markets in 2012 | 15 export bans, which loom large in the market’s whether hard landing, soft landing or memory following the measures taken by maintaining the status quo—are likely to Russia in response to the 2010/2011 drought. have a smaller effect on demand for imports Export bans should be seen as a likely than is generally expected. We expect that response to any significant deterioration of the government’s bias in an environment the domestic inflation picture in the Black of renewed world democratisation and Sea region. seemingly less constrained domestic dialogue will be towards increasing focus on street- A key threat to the global corn complex level inflation and the price paid for food is the economic fragility of South America. by the average Chinese citizen, reinforcing Argentina in particular has experienced the status quo. consistently high inflation, as well as regular protests and export tariffs that prove a These effects are a big source of uncertainty common hindrance to trade and remain for markets and are compounded by the fact a risk for prices (see Figure 2.13). Having that Chinese supply/demand balances are integrated into global export markets, notoriously opaque. Our analysis suggests Argentina and Brazil now have a critical piece that inventories of grains and oilseeds of world trade. In addition to political risks, remain below levels we think the Chinese both countries have large domestic markets government expects in order to meet their they need to satisfy, and a very real risk goal of enhancing domestic price stability. remains that policies could be introduced West Africa to support domestic use in the event of a Most of the world’s cocoa supply is still supply-side shock. drawn from West Africa, a region which Chinese import policy remains politically volatile and prone to civil The Chinese government and its economy war as seen in 2010/11 in Ivory Coast, the are perhaps more closely linked than those world’s largest cocoa producer. This political of any other major power and, as a result, risk remains, though difficult to quantify, with the ruling party is able to exert more control the largest risk being the return of civil war to over agricultural trade flows than elsewhere. the Ivory Coast, followed by the introduction With this in mind, we believe there is more of a central buyer there, as seen in Ghana, impetus for the Chinese government to to provide price stability. The Ivory Coast increase than to reduce imports of agri government can reasonably expect commodities in 2012. that mimicking the policy of its neighbour will limit the cross-border smuggling that We forecast a slowing rate of economic is currently taking place in order to take growth to have little effect, and it may even advantage of, or arbitrage, the price stimulate import demand in the face of differential between the two nations. The continuing government rhetoric about food next obvious step is West African regional self-sufficiency. This is driven by domestic integration to form a cocoa OPEC, though pressure to see real wealth growth for the we see the risk of this happening as minimal. public at large and to hold political unrest at bay. Changes in China’s economic trajectory— Figure 2.12: World wheat and corn exports by region, Figure 2.13: Argentina’s inflation profile, YOY change in price 1961/62-2011/12f indices, Dec 2000-Oct 2011 140 300 250 120 250 200 100 200 80 150 million tonnes percent percent 150 60 100 100 40 50 20 0 50 0 -50 -20 -100 0 Oct-01 Oct-11 11/12f 61/62 63/64 65/66 67/68 69/70 71/72 73/74 75/76 77/78 79/80 81/82 83/84 85/86 87/88 89/90 91/92 93/94 95/96 97/98 99/00 01/02 03/04 05/06 07/08 09/10 Dec-00 Aug-02 Jun-03 Apr-04 Feb-05 Dec-05 Oct-06 Aug-07 Jun-08 Apr-09 Feb-10 Dec-10 US EU South America Black Sea region Other CPI CPI: Food and beverages Big Mac Index Argentina (RHS) Source: Rabobank, USDA, 2011 Source: Rabobank, Bloomberg, The Economist, 2011
  • 19.
    16 | RabobankOutlook 2012—Down, But Not Out The risks of production concentration in such volatile countries mean there is a significant upside skew to the cocoa price, contingent upon changes in the West African political situation. Elections Elections provide significant scope, outside the expected changes to agricultural policy, to catalyse protectionist policy implementation for short-term economic gain. Any such policy action, be it new tariffs or accommodative domestic policy, can be easily justified as responding to perceptions of global economic uncertainty to ensure domestic stability. We will monitor a number of specific elections during 2012 in which we see potential surprises for markets and resulting price effects for agri commodities (see Figure 2.14). Figure 2.14: Selected political events, 2012 Estimated date Assessed agri Event description market impact US 3 January Low First Republican party primary in Iowa Egypt January-March Low Parliamentary election Russia 4 March Low-moderate Presidential and local elections US 6 March Low Super Tuesday, 10 states; Republican party candidate Iran 29 March Moderate Parliamentary election France 22 April Moderate Presidential elections, first round France 10 June Moderate Parliamentary elections, first round Mexico 1 July Moderate Presidential and parliamentary elections India July Low Presidential elections (elected by parliament) Kazakhstan August Moderate Parliamentary elections Turkey August Low Presidential elections Brazil 7 October Moderate Municipal elections, first round Ukraine 28 October High Parliamentary elections October 2012- China Moderate Communist party internal leadership selection March 2013 US 6 November Moderate Presidential, House and 1/3 of Senate elections Ghana December Moderate Presidential and parliamentary elections Source: Rabobank, relevant governments, Bloomberg, New York Times, 2011
  • 20.
    Section 2 Keythemes for agri markets in 2012 | 17 Capacity constraints heavily on higher-risk production regions Supplies of a number of agri commodities will such as the Black Sea region. At the same remain historically low in 2012 as the world’s time, the break-even price in these countries, capacity to respond to elevated prices by many of which are in historically low-cost increasing production continues to be areas, is increasing as production costs rise constrained. Many agricultural markets and credit remains tight. We expect these remain susceptible to supply-side shocks supply constraints to be compounded by the as inventory levels remain tight—though already low inventory levels, which will not at historical lows for most commodities— continue to be supportive of agri commodity and high production costs, lack of land prices in 2012 (see Figure 2.15). This is reflected availability and capital restrictions limit by our base-case price forecasts, where a recovery in inventories. we expect to see a slight easing in most commodities, but a very soft landing with We forecast global ending stocks to decline prices remaining at historically elevated levels. in 2011/12 for five of the eight commodities included in our coverage, most notably in Supply squeeze coffee (-24%), soybeans (-11%) and corn (-7%). Supplies of most agri commodities leading More modest declines are forecast for wheat into 2012 remain precariously tight with (-3%) and cocoa (-2%), while stocks are some at or near record low stocks-to-use forecast to build for cotton (20%), palm ratios. The USDA forecasts the world’s total oil (12%) and sugar (11%). Most of the grain and oilseed stocks-to-use ratio to commodities for which we forecast to see a decline in 2011/12 to below 20%—the lowest decline in stocks despite record high or near level since 2007/08. This is despite the USDA’s record high production also experienced forecast for the global grain and oilseed area smaller incremental growth in production. harvested to increase by the largest amount This is unlike previous cyclical commodity since 2008/09 and to reach a record large bull rallies where production increased at 755 million hectares. The primary driver across a pace sufficient to meet growing demand the complex is the tightening of the corn and replenish stocks. Global grain and balance sheet for a third consecutive year, oilseed stocks-to-use ratio, for instance, bringing the stocks-to-use ratio to the lowest have remained below the long-term average level in nearly 40 years. The persistent low for the past 10 years, despite elevated year- level of global corn stocks in the face of on-year increases in production. record high prices and production will continue to be a key price determinant across Much of the low-hanging fruit in terms of the entire complex in 2012, despite a sharp production growth through land expansion year-on-year increase in global wheat and yield advancements has been exploited, production. With corn production unable causing output growth to be more expensive to surpass consumption for a second and have a higher risk profile. In 2012, we consecutive year, the ability to replenish expect production growth will be hindered inventories of crops which lost planted area by the limited availability of global arable to corn in 2011—as soybeans did—will also land, which is causing the world to rely more be challenged. As a result, we expect corn Figure 2.15: Global grain and oilseed stocks-to-use and 5-year average YOY change in production , 1969/70-2011/12f 35 80 YOY change (million tonnes) 30 60 percent 40 25 20 20 0 15 -20 69/70 75/76 79/80 83/84 87/88 91/92 95/96 99/00 03/04 07/08 11/12f Stocks-to-use 5-year average change in production Source: Rabobank, USDA, 2011
  • 21.
    18 | RabobankOutlook 2012—Down, But Not Out to lead the grains and oilseeds complex as Europe and the US), which also have the for the beginning of 2012, keeping the smallest amount of production constraints, soybean-to-corn price ratio historically has flatlined, pushing an increased share of low and challenging wheat’s historical production growth to countries such as premium to corn. Russia, Brazil, Ukraine and Argentina. The world’s reliance on these emerging Risk aversion may limit the amount of agricultural producers is expected to increase capital deployed to increase agri commodity to a record high 18% in 2011/12, reducing production in 2012 (see Figure 2.16). traditional exporting countries’ share to Continued uncertainty surrounding the below 40% for the first time on record. economic and political outlook for 2012 is likely to curb the amount of capital As their market share has increased in recent deployed in the global agriculture sector. years, so too has the variance in global yields At the farmgate level, producers will be for corn, soybeans and wheat (see Figure 2.17). hesitant to invest in large purchases or land While it is still too early to determine yield expansion as they are uncertain of future levels for the 2012/13 crop, the outlook for returns. Political debates surrounding winter crops in the Black Sea region is already the continuation of many government being closely monitored due to adverse programmes which support the agriculture planting conditions. Over 30% of Ukraine’s sector further fuel this uncertainty. This theme new crop winter grain could be lost due to of conservatism will play out more strongly the current drought. in regions that are deemed to be higher risk As global agri commodity production by investors who are withdrawing from continues to expand into emerging markets, emerging markets in a ‘flight to safety’. From so too will the battle for acres which persists an agricultural perspective, this will impact in developed economies such as the US and those countries that have shown the largest the EU. This battle is likely to intensify in 2012 growth in production in recent years: the as the increase in grain area harvested in 2011 emerging markets. Additionally, a more (at the expense of oilseeds) did not result in a conservative outlook for the economic sufficient production response to replenish growth in emerging markets will likely stocks. Yet at the same time, the stocks-to-use limit the volume growth in loans to the ratios of vegetable oils are likely to fall to their agriculture sector. lowest levels in nearly 40 years for a second Increased yield volatility consecutive season. This will likely cause The market share of global agricultural ending stocks of both grains and oilseeds in production capacity in countries with higher 2011/12 to show a year-on-year decline for yield variance will continue to grow in 2012. the first time since 2003/04. We expect corn We expect the market share of regions with values to offer Northern Hemisphere farmers elevated production risks, such as the Black higher profits than other row crops, further Sea region and Argentina, to rise further in reducing the area available to plant to 2012. The production capacity in traditional oilseeds and cotton. agri commodity producing countries (such Figure 2.16: Brazil financial system loans to agriculture and Figure 2.17: Global yield variance and production shares YOY change in Brazil’s total area planted, 2002/03-2011/12f 4 20 5 22 18 20 YOY Change in BRL billion 3 16 4 million hectares 2 14 18 percent percent 12 1 10 3 16 8 0 6 14 2 -1 4 12 2 -2 0 1 10 02/03 03/04 04/05 05/06 06/07 07/08 08/09 09/10e 10/11f 11/12f 81/82 86/87 91/92 96/97 01/02 06/07 11/12f Global yield variance of corn, soybeans and wheat YOY change area planted Agriculture loans to Brazil (RHS) Argentina, Brazil and Black Sea region share of global production (RHS) Source: Rabobank, CONAB, Bloomberg, 2011 Source: Rabobank, USDA, 2011
  • 22.
    Section 2 Keythemes for agri markets in 2012 | 19 Higher price floors potential as prices still remain below the The cost to produce agri commodities will highs achieved in 2008. Furthermore, the continue to increase in 2012, raising farmers’ diminishing availability of new arable land break-even levels and creating higher floor will push farmers to invest more in crop input prices. Higher production costs will limit the technologies such as seeds and equipment downside price potential for most agri to increase production through higher yields. commodities in 2012 as prices must persist This more capital-intensive per hectare cost above break-even in order to encourage of growing crops against a backdrop of risk farmers to increase production. The cost aversion by lenders will increase the price to produce crops such as wheat and corn incentive required by farmers. (globally weighted by production) has roughly doubled over the past 10 years. Nearly all of the cost components—such as fertiliser, energy and land—are expected to remain elevated for the 2012 season. Not only have average global production costs increased, but the gap between low-cost producing countries and marginal producers has also narrowed. For instance, the cost advantage of producing wheat in Russia as compared to the US fell from USD 250/hectare to less than USD 50/hectare in 2011. This trend of diminishing cost advantages of countries with a higher risk profile is likely to continue in 2012, which will consequently limit their ability to offer exports at a discounted price relative to higher-cost producing countries. We expect this higher cost structure to persist in 2012, driven by higher energy prices and strong farmer demand due to the high profits achieved in 2011 (see Figure 2.18). Fundamentals in both the energy and fertiliser markets will remain supportive of prices in 2012 as capacity growth is slow to respond to demand growth. Global fertiliser consumption is likely to have risen 2.5% to 176.4 million nutrient tonnes in 2011/12—a second year of record high demand. Although we do not expect fertiliser prices to reach new highs in 2012, we do see further upside price Figure 2.18: Index of global corn and wheat production costs and prices, 2000-2011f 400 350 300 2000=100 250 200 150 100 50 2000 2001 2002 2003 2004 2005 2006 2007 2008 2009 2010 2011f Wheat production costs Corn production costs CBOT Wheat CBOT Corn Source: Rabobank, IHS Global Insight, USDA, Bloomberg, 2011
  • 23.
    Section 3 AgriCommodity Outlooks | 21 3 Agri Commodity Outlooks Given the highly uncertain macro economic We also adopt Rabobank’s global FX environment at present, we have decided strategists’ forecasts as our base case, which to provide some scenario parameters for shows limited moderation in the US dollar our price and fundamental forecasts this expected against most currencies in 2012, year. These three scenarios are provided although we factor in some upside relative to give some guidance on our level of to commodity currencies. confidence in our forecasts and the macro- Our base case implies little impact on level assumptions we have applied in demand from an agricultural perspective, formulating these forecasts. Our base-case other than perhaps a continuation of protein macro and FX scenarios have been applied demand substitution—from red meat to to our central forecasts for each of the poultry—in the struggling developed various agri commodities. economies. This scenario also assumes very Base case: Stumbling along limited impact on agricultural demand from In the base case, Rabobank’s macroeconomics emerging-market economies, with growth team suggests that the most likely outcome expected to continue at trend levels, which is for the global economy in 2012 will be one supportive for almost the entire agri complex. of very weak but positive global economic High case: Recovery stronger and faster growth. We apply this as the central driver than expected for the base case in our commodity price The major assumption we factor into this forecasts. A mild double-dip is expected in scenario is a quicker and stronger recovery in the major developed economies of Europe global growth conditions than we currently and the US, but importantly for agricultural forecast. This would require a swift and clear demand, only a minor softening in growth resolution to the euro-area crisis, a reversal in is forecast for emerging-market economies. investor money flows back into commodities A lot will no doubt depend on the timing and higher growth economies, and a return and effectiveness of a resolution of the of confidence to global markets. In this troubles in the euro area, which at this stage scenario, agricultural demand would remain still seems some way off. We assume that a robust in both developed and emerging- workable solution will be in place by Q1 2012 market economies. We expect this scenario and we factor in a break-up of the bloc as would provide a stronger devaluation of the only a 10% to 15% probability. This scenario US dollar as safe-haven assets are sold in implies a modest reversal in investor money search of growth. flows, but not a complete return to the risk-on environment of 2010. Significant range-bound trading with choppy markets and a lack of clear flat price direction would be likely.
  • 24.
    22 | RabobankOutlook 2012—Down, But Not Out Low case: From bad to worse This is our downside scenario for world growth and demand. Here we factor in a prolonged EU debt crisis, with the debt concerns spreading to the core countries of the bloc. Contagion fears paralyse markets in Europe with knock-on effects globally and sustained risk-off environment results. Importantly for our agri complex forecasts, in this scenario we factor in a substantial contraction in emerging-market growth which would significantly crimp demand and imports of key agri commodities. Consumers would be forced to transition to lower cost sources of calories and proteins. In this scenario, a stronger US dollar environment would likely persist in 2012 as liquidity and safe-haven assets are sought by investors.
  • 25.
    Section 3 AgriCommodity Outlooks: Wheat | 23 WHEAT Q3’11 Q4’11f Q1’12f Q2’12f Q3’12f Q4’12f 12-month outlook from spot CBOT wheat USc/bu 688 610 595 630 615 595 Matif wheat EUR/tonne 199 170 162 175 172 166 800 750 Low case Base case High case 700 Support from coarse Wheat prices continue Winter wheat grain markets fades to be supported by abandonment and 650 more quickly than coarse grain prices― yield deterioration 600 expected particularly in the US exceed expectations USc/bu 550 as drought in the At-trend exports from Global demand southern states of 500 the major producers accelerates in 2011/12, the US intensifies 450 drive 2012/13 global largely offsetting the stocks-to-use fourth largest global Drought conditions 400 intensify, severely above 33% wheat crop on record 350 affecting crops in 300 Crop conditions Poor winter wheat the Black Sea region improve in spring, planting conditions in 2010 2011 2012 and global yields the US and Ukraine US corn fundamentals exceed our sub-trend, result in sub-trend tighten more than base-case forecast crops―but not a total expected, forcing Historical Base case Low/high case Spot crop failure prices into a rationing mode Source: Bloomberg, Rabobank Lower wheat prices are forecast for 2012 than risk to our base-case forecasts come from we have seen in 2011, however from current production uncertainty for the 2012/13 spot levels our view is neutral. While a tight season, with incremental wheat production feed-grain balance sheet is expected to being generated in more politically volatile provide some support to wheat prices, and less reliable climatic regions as discussed particularly in the US, elsewhere we see the in our capacity constraints section. sharp recovery in wheat production having Global wheat production is forecast to a bearish impact on prices, relative to the increase 6% to 684 million tonnes in the levels achieved in 2011. 2011/12 season, the second largest crop on Wheat fundamentals on their own reflect a record. With the Northern Hemisphere crop bearish situation from current price levels; in the bin, the only production uncertainty although high protein and high quality remaining at this stage of the wheat season supplies are less abundant, there will be is in the Southern Hemisphere countries of ample supplies to meet global demand needs Argentina and Australia. Despite the ongoing in the season ahead. The outlook for the threat from a strengthening La Niña weather 2012/13 season is not so clear with winter pattern, production in both countries does wheat planting conditions in a number of not appear at risk, and harvest is now well regions far from ideal. underway. However, global wheat consumption is forecast to reach a record CBOT wheat prices are forecast to average high of 676 million tonnes in 2011/12, up 14% lower YOY in 2012 as sharply higher 4% YOY—offsetting fewer supplies of feed world production results in strong export grains—which we expect will limit the competition and a build-up in inventories recovery in global wheat inventory levels to for the 2011/12 season. Our base case for just a 2% increase YOY. Despite the increase wheat prices indicates a mostly neutral view in stocks, record high global wheat demand from current levels, following a strong sell- is forecast to keep the stocks-to-use ratio off in 2H 2011. We do not expect a further unchanged from last season at 30%. It is collapse in prices, while ample supplies worth noting that this remains well off the will prevent upside potential, in the absence low of 20% in 2007/08 that triggered record of crop failure in 2012. A weaker US dollar— high wheat prices. as outlined in our base-case macro assumptions—will likely provide some Wheat prices in the US are expected to be support for CBOT prices, while a lack more a function of the domestic corn market of export competitiveness in the EU will and less affected by the global wheat see Matif prices under pressure. We do not dynamics than prices elsewhere. Tight anticipate significant variation between our corn fundamentals in the US, following scenarios from the demand side of the ledger, the extreme heat of summer 2011 and with wheat demand relatively inelastic and subsequent yield downgrades, are expected generally a function of supply. The most to support US wheat prices as domestic prices
  • 26.
    24 | RabobankOutlook 2012—Down, But Not Out decouple from the global market. The wheat- USDA is forecasting a 24% YOY fall in US corn futures price spread—which traded at wheat exports to the second lowest level an unusual inverse throughout 2H 2011— of the last five seasons, while EU exports are will be important in determining how much expected to drop 26%. Increased global wheat works into the feed ration in the exportable supplies are the major driver remainder of the 2011/12 season. The behind this shift in global demand, primarily premium for corn prices over wheat (spot- to the Black Sea region, where production has price basis) during 2H 2011 reached the rebounded 43% and export bans have been highest level since 1995/96 and has repealed following the 2010 drought. Despite maintained a premium for the longest period this impressive recovery in just 12 months, in history. While this is unusual, we expect aggregate Black Sea region production is that corn prices will continue to trade at a expected to fall just short of a record in premium to wheat for some time to come, 2011/12, although Kazakhstan is forecast to given the fundamental differences. The USDA produce a record crop of 21 million tonnes, forecasts a 22% YOY increase in US wheat a 116% YOY increase. We expect exports from feeding to 160 million bushels in 2011/12; the Black Sea region to reach a combined this estimate remains well below the levels 38 million tonnes in 2011/12, the second reached in 2008/09. highest aggregate for the region on record, and a 27% market share is forecast to be the Global supply of high quality and high largest share of global trade from the region protein wheat is expected to remain relatively on record. tight despite this season’s large global wheat crop. Widespread flooding in key Hard Red Wheat exports from the US and the EU are Spring (HRS) wheat-producing states in the forecast to represent a record low share of US and Canada—particularly North Dakota world trade in the 2011/12 season. Combined and Saskatchewan—resulted in widespread exports from these two key regions are abandonment in 2011, pressuring supplies forecast to fall from 45% last season to just and resulting in a strengthening in the 31% in 2011/12. Increased export competition protein price premium. This is reflected by this season has also been intensified by the sharp increase in the spread between sizeable crops from both Australia and the MGEX and CBOT wheat futures markets. Canada. The Australian exportable surplus This spread is expected to remain elevated, was recently boosted by a stock revision of at least during the first half of 2012, as tight around 3 million tonnes and is likely to supplies and the need to encourage plantings benefit from the country’s largest wheat crop of spring wheat against corn and even on record at a forecast 26.2 million tonnes. soybeans will likely support MGEX prices. We forecast a record large national export programme of 21 million tonnes for Sharply higher global wheat production is Australia, constrained only by domestic forecast to result in significant export logistics and increasing low-cost competition substitution from lower cost origins, but US from the Black Sea region into South East wheat exports have been surprisingly resilient Asian markets. Greater production in Western in the first half of the 2011/12 season. The Australia this season should allow exports to Figure 3.1: US all-wheat feeding and the wheat/corn spread, Figure 3.2: MGE vs CBOT wheat spread and HRS carryout, 2001/02-2012/13f 2001/02-2011/12f 300 7 250 10 6 9 250 200 8 million bushels 5 million bushels 200 7 USD/bu USD/bu 4 150 6 150 5 3 100 4 100 2 3 50 50 2 1 1 0 0 0 0 10/11 01/02 02/03 03/04 04/05 05/06 06/07 07/08 08/09 09/10 11/12f 12/13f 10/11 01/02 02/03 03/04 04/05 05/06 06/07 07/08 08/09 09/10 11/12f All-wheat feeding Maximum CBOT wheat/corn spread (RHS) HRS carryout Max MGE/CBOT wheat spread (RHS) Source: Rabobank, USDA, Bloomberg, 2011 Source: Rabobank, USDA, Bloomberg, 2011
  • 27.
    Section 3 AgriCommodity Outlooks: Wheat | 25 exceed last season’s levels. Canadian exports conditions and sub-trend emergence levels are forecast to jump 9.1% to 18 million tonnes heighten the risk of crop losses in these despite the growing uncertainty being regions in 2012/13. This production caused by the expected abolishment of the uncertainty is likely to provide some single exporter policy next season. support to deferred contracts for both the Matif and CBOT markets; however, conditions European wheat prices look set to have the in the Northern Hemisphere spring will be most potential for downside due to lower- the key in determining yields and production. cost export competition from the Black Sea Without a significant supply-side shock in region, although a weaker euro may provide 2012/13, we do not expect prices to return a partial buffer early in 2012. European, and to highs seen in 2010 or 2011. most notably French, wheat exports slumped early in the 2011/12 season as Black Sea region exports dominated market share into the key North African importer destinations, and we expect these exports will remain under pressure in 2012. We expect EU wheat stocks to climb 13% YOY, likely bounding Matif futures prices well below the highs of 2011 and above the lows of 2009. A range of EUR 125/tonne to EUR 196/tonne is expected, given the weaker fundamental situation next season. Our initial estimates for 2012/13 suggest it may be difficult to replicate this season’s near- record production next season as we model area planted globally unchanged to slightly lower on the basis of significantly weaker wheat prices year-on-year and increased competition for planted area from other row crops. Assuming trend yield at this early stage of the season in most regions, our initial estimates suggest a 3% YOY decline in global wheat production to 662 million tonnes in the 2012/13 season—still the fourth-largest global wheat averages on record. Adverse winter wheat planting conditions in Ukraine, and in the southern US due to ongoing drought, suggest it will be difficult to achieve trend yield this season. Additional poor crop Figure 3.3: YOY changes in Black Sea region, US and EU exports, Figure 3.4: World wheat production and yield, excluding China 2008/09-2012/13f and India, 2000/01-2012/13f 550 2.9 20 15 500 2.8 million tonnes 10 2.7 tonnes/ha million tonnes 450 5 2.6 0 400 -5 2.5 -10 350 2.4 -15 300 2.3 -20 10/11 00/01 01/02 02/03 03/04 04/05 05/06 06/07 07/08 08/09 09/10 11/12f 12/13f 08/09 09/10 10/11 11/12f 12/13f Black Sea region Global production excl. China, India, US Global yield excl. China, India (RHS) US EU Ukraine Russia Kazakhstan US production Trend line Source: Rabobank, USDA, 2011 Source: Rabobank, USDA, 2011
  • 28.
    26 | RabobankOutlook 2012—Down, But Not Out CORN CBOT Q2’11 Q3’11 Q4’11f Q1’12f Q2’12f Q3’12f Q4’12f 12-month outlook from spot USc/bu 732 696 620 610 645 630 610 800 750 Low case Base case High case 700 Corn plantings Further US corn New crop US corn 650 exceed 95 million yield reductions acreage is less than 600 acres in the US, with force increasing 93 million acres and USc/bu prices falling to USD reliance on volatile yields disappoint 550 5.00/bushel on record emerging-market 500 crop expectations exports Policy changes restrict Ukrainian/ 450 Importer demand is Ethanol production Argentine corn 400 weaker amid hits record levels, exports 350 economic downturn; despite blenders’ USD rally hinders credit lapsing at High oil prices and 300 low USD, drive US 2010 2011 2012 exports the end of 2011 ethanol demand to Weak La Niña helps China imports 5.2 billion bushels South American corn 4 million tonnes of US Historical Base case Low/high case Spot exports hit 34 million corn despite record tonnes domestic crop Source: Bloomberg, Rabobank Rabobank forecasts lower year-on-year CBOT see corn prices test USD 7.00/bushel during corn prices in 2012. However, we do expect Q2 2012. a seasonal uptick in prices, averaging Rabobank forecasts continued reductions USD 6.45/bushel in Q2 2012 before easing to to the USDA’s corn ending stocks projections USD 6.10/bushel in Q4 2012. We expect this as use creeps higher on strong ethanol mid-to-late year fall will result from 2012/13 margins and relatively strong exports, while acreage expectations being ratcheted higher simultaneously, there is also a significant risk in the US. Our forecast 2011/12 US corn of further yield downgrades in the final 2011 ending stocks-to-use ratio would be the crop report due in January 2012. In broad lowest on record and provide strong price terms, most categories of US demand have support in the near term. been strong or strengthening since the start Q2/Q3 2012 corn prices will prove difficult to of the 2011/12 marketing year in August. We forecast as the US corn complex moves from expect that to continue, with total US corn a strong deficit to a moderate surplus, with use in 2011/12 forecast to reach 12.8 billion prices highly path-dependent as the market bushels, a 1.9% decrease from 2010/11 attempts to guide 2012/13 acreage in the US. levels. Key risks to our forecast include the Although a long way out, we see our corn possibility of negligible La Niña effects and price forecasts likely to be more a function subsequently strong South American exports, of South American weather and supply as we currently forecast a lower export expectations for the US 2012 crop than outcome than the USDA for the continent. economic outcomes. Ethanol production Fundamentals show oil prices to be a key responses to oil price changes remain our driver of future corn prices, as we foresee main mechanism to bring economic greater corn demand from ethanol variability into the corn complex. production than the USDA for 2011/12 and further increases in 2012/13. Margin Our low case would also involve the winding contractions from falling oil prices are a back of the increases in protein consumption key risk to our forecast. we have assumed for the developing world. If weaker-than-expected growth outcomes The ongoing role of speculative/managed are realised in the developed world, as money in the agri complex, and in corn assumed in our low case, we could see oil markets more specifically, will play an prices dropping below USD 100/barrel important role in price discovery for corn in and a significant reduction in corn prices the coming year. Current net long positions towards USD 5.00/bushel as ethanol of managed money are near the lows set in demand is reduced. Under our high case, July 2010, and we expect it to be difficult for where the global economy experiences significant liquidations in speculative net resurgent growth, we would see higher oil long positions to occur from these levels as prices, strengthening demand and rebuilding structural longs remain. Analysis of origin- of stocks. These macro conditions would buying suggests a price floor of approximately
  • 29.
    Section 3 AgriCommodity Outlooks: Corn | 27 USD 6.00 will hold until 2012/13 crop acreage reach 5.2 billion bushels as corn acreage is and conditions are well established. expanded at the expense of soybeans, with our forecast near-term futures price ratio Further out the curve, our downward bias between the two commodities continuing for prices strengthens with the 2012/13 to favour corn. Given unchanged oil prices, marketing year likely to produce the largest ethanol production should remain near global corn crop on record. Rabobank capacity and meet our forecast, as corn projects that an equal record of 93.5 million remains in the USD 6.00/bushel to acres will be planted in the US, further USD 7.00/bushel range. Our base-case displacing soybeans as producers capitalise economic growth assumptions would, on strong price incentives and increase corn without increased disturbance in the acreage in marginal production regions. Middle East, see Brent Crude oil prices stay Our state-by-state models suggest that the in the USD 100/barrel to USD 110/barrel majority of the 1.7 million planted acreage range during 2012. increase will be from nontraditional US corn export sales, with a strong pace producer states. set for 2011/12, should be supported by a We forecast an additional 850,000 acres weakening US dollar. We forecast exports of corn to be planted in North Dakota as it to be 1.62 billion bushels, 25 million bushels recovers from the severe flooding of 2011. ahead of current USDA expectations. There There is significant income risk as farmers remains a risk that sales are cancelled as planting corn for the first time receive crop buyers switch to cheaper origins once crops insurance returns in line with county yields are more certain. Structural factors such rather than proven yields. This uncertainty, as China’s ability to import only US corn along with resilient spring wheat prices, as well as geographical advantages in caps our expectation of increased exporting to Mexico, where a drought is substitution in North Dakota. forecast to have reduced the 2011/12 expected crop by 3.5 million tonnes from Although a long way off, we forecast US prior USDA estimates, should support yields of 154 bushels/acre based on our export sales in Q1 2012. state-by-state model. This figure was impacted by the increased acreage from Rabobank forecasts that the USDA will marginal states. Following this, our have to increase feed demand to 4.7 billion production forecast is 13.25 billion bushels, bushels from the current 4.6 billion bushel a 7.9% increase on our 2011/12 forecast. estimate. The November WASDE report stated that the USDA has underestimated We forecast a record 5.1 billion bushels of US domestic corn demand in 20 out of corn to be used in ethanol production 30 years of analysis, which Rabobank during the 2011/12 marketing year as considers worth highlighting. The average distillers operate on strong margins at full error is 215 million bushels. This supports pace despite the risk caused by the imminent our view that domestic use estimates will withdrawal of the blender’s credit. Corn use be increased in the new year. We forecast for ethanol production in 2012/13 is likely to 4.5 billion bushels of US feed demand in Figure 3.5: US corn planted area and yield, 2000/01-2012/13f Figure 3.6: Matrix of estimated ethanol production profitability (in USD/gallon) 100 170 Brent crude price 80 90 100 110 120 95 160 (USD/barrel) Ethanol price1 2.05 2.28 2.52 2.76 2.99 bushels/acre million acres 90 150 (USD/gallon) 85 140 5.5 0.03 0.27 0.50 0.74 0.98 80 130 6.0 -0.15 0.08 0.32 0.56 0.79 75 120 Corn price (USD/bushel) 6.5 -0.34 -0.10 0.13 0.37 0.61 70 110 00/01 10/11 01/02 02/03 03/04 04/05 05/06 06/07 07/08 08/09 09/10 11/12f 12/13f 7.0 -0.52 -0.29 -0.05 0.19 0.42 1 RBOB gasoline/Brent crude relationship based upon OLS regression Figure assumes a DDG price of USD 220/tonne and an RBOB gasoline/ethanol spread of USD 0.10/gallon. Area planted Yield (RHS) Source: Rabobank, USDA, 2011 Source: Bloomberg, USDA, Rabobank
  • 30.
    28 | RabobankOutlook 2012—Down, But Not Out 2012/13 as DDG substitution increases and either our or the USDA’s forecast, there the cattle herd shrinks. will be some form of government intervention. We see several likely Our global production outlook for corn in catalysts that could bring further export 2011/12 is relatively large from a historical limitations into effect: perspective, with Brazil, Ukraine and Argentina helping to moderate weakened • The government decides that domestic expectations for the US crop, albeit with prices are too high and acts to support greater downside risk than seen in previous domestic consumption, years. Although record crops are expected • The current poor outlook for the 2012/13 in many countries, world trade (excluding wheat crop deteriorates further and the US) during the remainder of the resulting export bans cover the entire 2011/12 marketing year is likely to see grains complex, supply availability skewed to the downside as political considerations operate in • No IMF funding deal is struck and the conjunction with uncertain environmental Ukrainian government sees the record outcomes. In addition, we see potential for high price for exports and re-introduces yields in Argentina to be reduced by an tariffs to assuage cash flow issues. adverse La Niña weather pattern. Rabobank forecasts 2012/13 will see We expect 27.5 million tonnes of corn global corn production of 885 million to be exported from South America in tonnes, a 3.4% increase on our 2011/12 2011/12. Argentina continues to operate forecast and the highest on record. This in a pressured economic environment with forecast builds on our greatly increased persistently high inflation and persistent acreage figure for the US and sees an government intervention in the foreign extra 3 million tonnes in exports from exchange market. Further economic stress South America as soybeans are displaced may promote more widespread industrial in a situation analogous to that in the US. action, causing substantial stress to a world Ukrainian production estimates are corn complex which relies on strong tempered by strong incentives to plant Argentine exports. We will monitor this more barley and sunflower and closely and adjust our forecasts as necessary. consequently, we have reduced our export forecast to 9.3 million tonnes for 2012/13. In a year of a record corn production, We expect global corn trade to be resurgent Ukrainian exports remain uncertain with the as China imports a record 7 million tonnes USDA currently expecting 12 million tonnes and the world economy pulls itself to its to be exported in the 2011/12 marketing year. feet. At this point, we forecast ending Our analysis suggests 11 million tonnes will stocks to be 123.8 million tonnes with be more realistic, with 9.5 million tonnes a stocks-to-use ratio of 12.6% relieving our low case, which would put significant some of the pressure we forecast ahead upward pressure on corn prices. Given the for 2011/12. need to raise the government-mandated export cap of 10.5 million tonnes to meet Figure 3.7: Global corn exports, US vs ROW, 1972/73-2012/13f 120 60 100 50 million tonnes 80 40 percent 60 30 40 20 20 0 10 80/81 90/91 00/01 10/11 72/73 74/75 76/77 78/79 82/83 84/85 86/87 88/89 92/93 94/95 96/97 98/99 02/03 04/05 06/07 08/09 12/13f US ROW Rest of world share of exports (ROW) Source: Rabobank, USDA, 2011
  • 31.
    Section 3 AgriCommodity Outlooks: Soybeans | 29 SOYBEANS CBOT Q3’11 Q4’11f Q1’12f Q2’12f Q3’12f Q4’12f 12-month outlook from spot Soybeans USc/bu 1,358 1,165 1,178 1,226 1,260 1,251 Soy oil USc/lb 55.8 49.4 48.7 50.2 49.1 47.5 Soymeal USD/ton 230 300 310 290 330 335 1,400 Low case Base case High case Record large US corn US soybean planted China’s imports 1,300 harvest results in area declines to a grow 15% or more our low-case corn 5-year low of less YOY and exceed price level of than 74 million acres 60 million tonnes 1,200 USc/bu USD 5.00/bushel in 2012/13 South American 1,100 Chinese imports fall The South American production below below the USDA’s exportable surplus 133 million tonnes 56.5 million tonne is record large at 1,000 USD 1/gallon forecast in 2011/12 56 million tonnes in 2011/12 biodiesel credit 900 US soybean 2012/13 extended in 2012 2010 2011 2012 planted area remains Chinese import flat YOY or rises growth accelerates Historical Base case Low/high case Spot above 75 million 12% YOY in 2011/12 to acres 58.5 million tonnes Source: Bloomberg, Rabobank Soybean prices in 2012 are poised to fall from Based on our analysis of the corn balance the levels seen in 2011 but are likely to remain sheet, we forecast corn prices will continue historically elevated even though slowing to outperform soybean prices during the global growth threatens to temper demand. beginning of 2012 as corn must win the US Our base case shows significant upside for battle for acres. We expect soybean planted deferred prices from spot, as soybeans area to lose more than 1 million acres to corn strengthen relative to corn in 2H 2012. Based and decline to 73.9 million acres in 2012/13— on our low case, we view soybeans as the the smallest area planted since 2007/08. most defensive commodity in the grain A rebound in soybean yields to a trend of and oilseed complex, given their relative 44 bushels/acre would mitigate the drop in underperformance in 2011 and the large planted area, resulting in a 5% YOY increase in emerging-market demand profile. However, production to 3.21 billion bushels. This would with our forecast for lower corn prices cause the market to be even more sensitive in 2012, we expect the spillover bullish to adverse weather developments as a result sentiment which was a key driver for of yields playing such a pivotal role in soybean prices during 2011 to fade. determining whether or not US soybean production will increase in 2012/13 or decline Yet a floor price will be set based on South for a third consecutive year. This 5% YOY America’s production costs and Chinese increase in US production would allow US import demand, as US farmers plant a record exports to increase by less than 5 million large corn acreage in 2012/13 largely at the tonnes—far below the average annual pace expense of soybean area. We expect this will needed to reach the growing Chinese import cause the US to concede its position as the demand. This will require South America to world’s largest soybean exporter to Brazil for increase production in 2012/13 by at least a second consecutive year and will shift price 2 million tonnes in order to prevent a further seasonality to reflect South America’s crop drawdown in global soybean ending stocks. calendar. Consequently, we believe the soybean-to-corn price ratio will reverse from The ability of global soybean production historically low levels as early as Q2 2012— to grow in 2012/13 is likely to be affected albeit at lower absolute year-on-year values. by South American capacity constraints. This lower price outlook for soybeans in 2012 Favourable weather and increased soybean will be limited, given the supply constraints plantings in Brazil are supportive of record inherent in soybeans’ expansion into new high production and exports available from territories which have a higher break-even South America for 2011/12. We forecast the price floor and higher political risks. Downside combined soybean production of Brazil, price risk will also be mitigated by the Argentina, and Paraguay to reach a record relatively inelastic biodiesel demand for high of 134 million tonnes in 2011/12, further soy oil and by China’s declining soybean solidifying the region’s importance in meeting production, which will be supportive of global demand. However, there are signs that its need to increase imports year-on-year. the pace of land expansion is slowing in Brazil
  • 32.
    30 | RabobankOutlook 2012—Down, But Not Out and Argentina, creating a biannual battle for appreciation and higher input costs are acreage. From 2000/01 to 2007/08, the reducing the cost advantages of expanding combined harvested soybean area in these soybean production in Brazil. Since we expect three countries increased by an average of the Brazilian real to remain volatile and 7% (even when accounting for a year-on-year stronger in 2012, the cost advantage of decline as a result of the global financial buying inputs in domestic currency while crisis). Since then, harvested soybean area selling crops in US dollars is diminishing. has only risen by an average of 4%. As farmers Consequently, incentivising Brazilian farmers slow the pace of their land expansion, the to undertake further acreage expansion will battle for acres between major row crops in require a higher CBOT soybean price. For Brazil, which has prevailed for many years in instance, in the state of Mato Grosso, where the US, is clearly becoming a biannual event. soybean production growth increased the For instance, in the Brazilian states that most in 2011/12, the cost of production for typically produce the highest soybean soybeans was less than USD 9/bushel. When yields (such as Paraná), corn plantings have transportation to port is included, costs increased at the expense of soybeans in increase to USD 11/bushel. We expect this 2011/12. Although the increase in corn break-even cost to increase in 2012, which will plantings has not been enough to cause give CBOT soybean prices limited downside total soybean area to decline in year-on-year below the USD 11/bushel, based on our terms—in fact we expect the Brazilian forecast for the Brazilian real to remain strong soybean harvested area will reach a record during 1H 2012 before declining in 2H 2012. high in 2011/12—it does signify that the The demand profile for soy oil may potentially capacity to augment soybean supplies is diverge from soymeal in 2012 as the growth becoming increasingly constrained. As a in demand for biodiesel and emerging- result, a higher floor price will be needed market food consumption of soy oil outpaces to incentivise the increased production the growth in feed demand for soymeal. We necessary to replenish the global soybean believe soy oil prices are least exposed to the balance sheet in 2012/13. potential economic slowdown in 2012 due to We believe that in order to offer South their smaller exposure to EU and US markets, American farmers the profit margins required which account for one-quarter of total to further expand soybean planted area in demand as opposed to their more than 2012/13, CBOT soybean prices must remain one-third share of demand for soymeal. above USD 10/bushel in Q3 2012—which is This exposure can be further reduced to roughly the break-even cost needed to bring 18% if the relatively inelastic demand of on new soybean area in Brazil. Although Brazil biodiesel is excluded. is positioned as a more cost-efficient soybean In our low case, in which economic growth producer (particularly because their yields in developed economies significantly have been larger than those of US farmers underperforms that in emerging markets, soy for the past two seasons), this gap is quickly oil prices would perform comparatively well, closing. Rising land values, currency given their large exposure to emerging Figure 3.8: US soybean area planted and production, Figure 3.9: Corn and soybean area harvested in Brazil and 1998/99-2012/13f Argentina and ratio of soybean/corn area harvested, 1987/88-2011/12f 80 3.5 70 3.0 3.2 60 75 2.5 million hectares billion bushels 50 million acres 2.9 40 2.0 70 ratio 2.6 30 1.5 65 20 2.3 1.0 10 60 2.0 0 0.5 00/01 98/99 99/00 01/02 02/03 03/04 04/05 05/06 06/07 07/08 08/09 09/10 10/11 11/12f 12/13f 87/88 89/90 91/92 93/94 95/96 97/98 99/00 01/02 03/04 05/06 07/08 09/10 11/12f Area planted Production (RHS) Corn Soybeans Ratio soybean to corn area (RHS) Source: Rabobank, USDA, 2011 Source: Rabobank, USDA, 2011
  • 33.
    Section 3 AgriCommodity Outlooks: Soybeans | 31 market economies. US soymeal demand is consumption of animal protein. Food inflation forecast to fall for a fifth consecutive year during 2011 has not reached the same levels to the lowest level since 1999/2000 due to seen in 2007 (in fact it has started to decline relatively flat year-on-year grain-consuming at the end of 2011) but remains historically animal units and the increased availability of elevated. China’s food inflation has largely DDGs. The volume of DDGs which substitutes been driven by pork prices, which reached total soymeal feed demand is estimated to record highs in 2011 as disease reduced be 20% to 30%. This implies that animal availability. This, in turn, gave farmers a price feed demand for US soymeal could have incentive to increase pork inventories, which potentially reached a record high in 2010/11 we view as supportive of China’s soybean were it not for the displacement by DDGs in import demand in 2012. The outlook for soy the feed ration. With our forecast for another oil demand growth is also uncertain for 2012 record-breaking year of ethanol production as crush margins have remained negative in 2011/12, soymeal demand will continue despite the government’s removal of price to decline. caps. Yet, we expect China’s year-on-year decline in soybean production in 2011/12 will The degree to which the soy oil share continue to be supportive of soybean import increases hinges largely on the outlook demand. The uncertainty lies in the extent to for biodiesel production (primarily in the which China’s demand will increase, which US) with significant downside, given the will largely depend on how the global likelihood that the USD 1/gallon tax incentive economic situation unfolds. will expire at the end of 2011, as well as upside risk if energy prices rise significantly in 2012. US biodiesel producers achieved record high profit margins in 2011, which are likely to deteriorate in 2012, causing year-on-year production decline to be the third highest on record. This will be more than offset by an increase in production in Brazil and Argentina, where mandates have been increased to B5 and B7, respectively. Brazil may potentially increase their blend requirements to B7 on the way to B20 by 2020. The largest downside price risk to soybeans will be the potential for China’s demand growth for soybeans to slow or decrease in 2012 should the global economic situation deteriorate, as in our low case, and threaten a slowdown to China’s economy. In 2007, when China’s food inflation skyrocketed, consumers responded by decreasing their per capita Figure 3.10: Combined US, Brazil and Argentina soy oil exports Figure 3.11: CBOT soy oil share of crush margin, and industrial domestic use, 2001/02-2011/12f Jan 2002-Nov 2011 14 50 12 45 10 million tonnes percent 8 40 6 35 4 30 2 0 25 00/01 01/02 02/03 03/04 04/05 05/06 06/07 07/08 08/09 09/10 10/11f 11/12f 2002 2004 2005 2006 2007 2008 2009 2010 2011 Exports Industrial domestic use Source: Rabobank, USDA, 2011 Source: Rabobank, Bloomberg, 2011
  • 34.
    32 | RabobankOutlook 2012—Down, But Not Out PALM OIL MDE-BURSA Q2’11 Q3’11 Q4’11f Q1’12f Q2’12f Q3’12f Q4’12f 12-month outlook from spot MYR/tonne 3,365 3,100 3,000 2,800 2,900 3,000 3,100 4,000 Low case Base case High case Exports of rapeseed Palm oil production La Niña strengthens 3,500 oil and soy oil grows 5% YOY in with a negative MYR/tonne increase in 2011/12 2011/12 to more than impact to palm oil as opposed to our 50 million tonnes yields in Malaysia 3,000 forecast for a decline and Indonesia Global soy oil Weak economic exports fall to 9.3 Oil prices rise and 2,500 growth in China and million tonnes―the spur increased India causes their largest YOY decline biodiesel production import demand to since 2008/09 in the EU/US decline YOY 2,000 Global palm oil Global soybean 2010 2011 2012 Energy prices fall stocks-to-use production does and reduce biodiesel increase YOY in not increase 2% as demand to less than 2011/12 to 11.4% forecast for 2012/13 Historical Base case Low/high case Spot 12%-13% of global but remain vegetable oils historically low Source: Bloomberg, Rabobank Global production of palm oil is poised for alternative vegetable oils is forecast to decline another year of growth in 2011/12, surpassing in 2011/12, which will benefit palm oil as end 50 million tonnes for the first time in history, users seek lower cost alternatives to soy oil allowing prices to ease and spurring demand. and rapeseed oil. Although it is likely that While in isolation this would signify a bearish prices will be pressured in the short term, we price reaction, declining availability of expect the seasonal slowdown in palm oil alternative vegetable oils will continue to production during 1H 2012 to lead to a price create an elevated increase in global demand rebound in 2H 2012. for palm oil and prevent a significant build-up The biggest downside risk to our price of ending stocks. We expect the increase in forecast for palm oil in 2012 is the political risk palm oil production to be largely weighted at surrounding biodiesel production, which the beginning of the marketing year, driven accounts for approximately 12% to 13% of by harvest seasonality and the potential global vegetable oil consumption. Our low negative impact of La Niña. case prices assume a curtailment in mandates Malaysia’s palm oil production—which or financial incentives for biodiesel constitutes 44% of global exports—has production in major soy oil exporting outpaced its 12-month moving average since countries in 2012, which would increase March 2011, rising to the second-highest exportable surpluses of commodities such monthly level on record in October at as soy oil and rapeseed oil. On the other hand, 1.91 million tonnes. At the same time, stocks as vegetable oils have become increasingly rose to the fourth-highest level on record. correlated to oil prices in recent years, this Going forward, we expect that production link to energy markets also gives potential seasonality and detrimental weather could for price upside in 2012 in our high case. potentially cause monthly output to fall Global palm oil demand is largely driven by nearly 20% below the 12-month moving consumption in China and India where we average. This will be partially offset by the see a relatively smaller risk of economic elevated stock levels, but a larger-than- slowdown in 2012. China’s palm oil expected export pace or La Niña could give consumption has only shown year-on-year further upside potential to our price forecasts. declines in two of the past 15 years, with last Our base case prices factor in continued season marking the largest year-on-year strong global demand growth for vegetable decline over this time period. It also marked oils, which will be supportive of palm oil the slowest year-on-year percentage growth prices in 2012, driven by increased biodiesel in China’s total vegetable oil consumption in production, Chinese demand and weather 15 years, which we expect will result in a risks. Across the oilseed complex, we expect rebound in 2011/12. Food-price inflation has the oil share to perform particularly well in begun to decline in China, and crush margins 2012 as the demand profile for oils versus have become less negative. As in past years of meals diverges further. The output of reduced demand growth, we expect this will
  • 35.
    Section 3 AgriCommodity Outlooks: Palm oil | 33 Figure 3.12: Monthly Malaysia palm oil production and 12-month Figure 3.13: Palm oil and Brent crude oil prices and correlation, moving average, 2000-2011 2001-2011 2.0 0.5 160 0.4 140 1.8 0.3 120 1.6 0.2 100 million tonnes correlation 1.4 prices 0.1 80 1.2 0.0 60 1.0 -0.1 40 0.8 -0.2 20 0.6 -0.3 0 2001 2011 2001 2002 2003 2004 2005 2006 2007 2008 2009 2010 2011 2000 2002 2003 2004 2005 2006 2007 2008 2009 2010 Correlation Brent crude oil price, USD/bbl (RHS) Monthly production 12-month moving average MDEX palm oil price, tens of USD/tonne (RHS) Source: MPOB, Bloomberg, Rabobank, 2011 Source: Rabobank, Bloomberg, 2011 cause China’s demand growth for palm oil to in 2011/12. However, relative to other agri rebound in 2011/12. Using a conservative 5% commodities, this demand profile is less at YOY increase, this would push China’s palm risk for a decline based on our economic oil imports to a record high of more than outlook for 2012. 6 million tonnes. However, there may be Palm oil prices will continue to be considerable upside to this assumption, underpinned by soy oil prices and, to a particularly as the last year-on-year decline, lesser extent, rapeseed oil prices. In our which occurred in 2001/02, was met with view, palm oil’s price discount relative to a more than 1 million tonne increase in soy oil will continue to find resistance above 2002/03—making even the USDA’s forecast USD 300/tonne—a level not surpassed since for a 7% YOY increase look conservative. We the global financial crisis in 2008. End-users see less risk of a slowdown in India’s palm oil were aggressive buyers of palm oil in 2011 as import demand as they have shifted to its discount dropped below USD 150/tonne. increasing reliance on palm oil in order to We believe this price relationship will persist fulfil vegetable oil demand, which is poised in 2012, keeping price movements in palm oil to expand to a record large 46% of the total dependent on developments in the broader in 2011/12. In our view, palm oil imports to oilseed and vegetable oil complex. India have a larger risk of falling short of expectations than those to China given the We expect that the year-on-year decline in relatively strong domestic oilseed production US soybean production in combination with Figure 3.14: Palm oil and soy oil prices and spread, 2000-2011 Figure 3.15: YOY change in global vegetable oil exports, 2000/01-2011/12f 1,600 5 1,400 4 1,200 3 million tonnes 1,000 USD/tonne 800 2 600 1 400 0 200 0 -1 -200 -2 2011 2001 2000 2002 2003 2004 2005 2006 2007 2008 2009 2010 00/01 01/02 02/03 03/04 04/05 05/06 06/07 07/08 08/09 09/10 10/11f 11/12f Soy oil premium to palm oil MDEX palm oil CBOT soy oil Palm oil Rapeseed oil Soy oil Source: Rabobank, Bloomberg, 2011 Source: USDA, Rabobank, 2011
  • 36.
    34 | RabobankOutlook 2012—Down, But Not Out increased biodiesel consumption in the US, Brazil and Argentina will reduce global exportable surpluses of soy oil by 6% in 2012. Rapeseed oil availability will also be reduced as global rapeseed production falls by more than 7%—a result of a second consecutive year-on-year decline in rapeseed yields. As these production shortfalls are met with continued demand growth, palm oil will account for a record large share of the world’s vegetable oil use in 2011/12 at more than 34%. As a result, we expect that the record large palm oil production will fail to create a substantial build-up in ending stocks and will require prices to remain elevated in 2012 in order to prevent demand from increasing above current expectations. We see the political uncertainty surrounding biodiesel production as the biggest downside risk to our price forecast, particularly the USD 1/gallon tax credit for US producers which is set to expire at the end of 2011. Weather poses the largest upside risk to our price forecast as a strengthening La Niña could reduce palm oil production in the coming months more than expected or cause South America’s soybean yields to fall below trendline.
  • 37.
    Section 3 AgriCommodity Outlooks: Sugar | 35 SUGAR ICE Q2’11 Q3’11 Q4’11f Q1’12f Q2’12f Q3’12f Q4’12f 12-month outlook from spot USc/lb 24 29 24.5 23.5 23 22 22 35 Low case Base case High case 30 The 2012 Brazilian Larger Northern New season crop defies 25 Centre/South cane Hemisphere and expectations; lower- crush exceeds Indian crops shift than-expected Thai, expectations: larger Indian or Brazilian USc/lb 20 globe into a surplus, surplus, weaker prices supplies cause a smaller weighing on surplus/4th consecutive 15 international prices International demand deficit season 10 expectations from Ethanol demand Policy action supports China are not met: market; Indian or EU in Brazil and tight 5 larger domestic crop governments allow suffices, government- inventories temper downside bias smaller exports than 0 buying wanes expected 2010 2011 2012 Deteriorating economic Demand is robust as Investor confidence conditions result in prices fall and users returns and the sugar investor liquidation restock market is viewed as Historical Base case Low/high case Spot in futures markets undervalued, leading to buying Source: Bloomberg, Rabobank We forecast lower international sugar prices in ICE #11 contract averaged USc 28/pound in 2012 as the market shifts into a surplus for the 2009/10—resulted in a stock drawdown and first time in three seasons. With global ending pushed users to rely on inventories and hand- stocks expected to increase above the 10-year to-mouth buying. The pent-up demand average for the first time since 2008/09, we surfaced as prices fell in late 2011, and we anticipate NY raw sugar prices will ease and expect further demand increases in 2012. reach an average level of USc 0.22/pound in In our view, the dominant factor in the sugar Q4. Even with the 6 million tonne surplus market in 2012 will be the improved supply forecast for 2011/12, we expect volatility to situation, a function of larger crops outside remain elevated and the current risk premium of Brazil, and likely a reaction to higher to linger until mid-year when crop sizes are prices of the past two seasons. Our forecast more certain. In our view, the forecast for total global sugar production in 2011/12 increased supply will result in lower prices, is 174.5 million tonnes, up 5% from the but a number of supportive factors will previous season and the fourth consecutive prevent the collapse of values. Increased increase. Better beet crops in the EU and demand from global importers and the Russia, as well as increased production in ethanol industry in Brazil are anticipated to be Thailand and India, resulted in 6.2 million major supportive factors in the new season. more tonnes of sugar, enough to offset the Also, the forecast surplus will not be enough lack of growth in Brazilian production year- to replenish the 19.8 million tonnes of deficit on-year. With the largest surplus forecast for of the past three seasons, and while the 2011/12 since 2006/07, when prices averaged stocks-to-use ratio is expected to increase in USc 10.3/pound, we expect prices on the NY 2011/12, it is forecast to be five percentage markets will struggle to remain above the points below the 10-year average. USc 25/pound level in 2012,assuming benign Given our bias for easing sugar prices in 2012, weather conditions and no major negative we expect the buying support to grow and weather events. remain resilient even in the case of a The demand for ethanol in Brazil and the widespread economic downturn. Our forecast competition between Brazilian drivers and demand growth in 2011/12 of 1.6% is a global sugar importers is expected to be a function of lower prices encouraging buying major factor in downside support for the and is up from the 0.8% increase in the sugar price in 2012. The size of the 2012 previous season. When the sugar market went Brazilian cane crop is the most important into deficit from 2008/09 to 2010/11, annual variable in the equation of how much sugar demand growth averaged only 0.3%. We will be available for export and how much foresee the need for many international will be available for biofuel use, but the prices buyers to come on the market in 2012 to of the products will determine the share of restock diminished inventories. In our view, the cane crop devoted to each. Our early the elevated prices of the past season—the projections suggest the Centre/South cane
  • 38.
    36 | RabobankOutlook 2012—Down, But Not Out harvest could be slightly lower than likely be another supportive demand-side 500 million tonnes, up from the 2011 estimate factor in 2012. In 2011/12, Chinese sugar of 490 million tonnes, but still below the production is forecast to increase 9% from record of 556 million tonnes reached in the previous season on better weather 2010/11. The early projections of cane supply and an increase in planted area. Domestic suggest the market for ethanol will be tight consumption is forecast to increase 2.3% in and that there will be strong competition 2011/12 with the domestic crop representing between the two products. 81% of total demand. Depleted stocks and the expected domestic deficit of 2.0 million- How much of the cane crop will be used 2.5 million tonnes mean that imports are to produce ethanol is a function of the forecast to rise to 3 million tonnes, up from international price of sugar and the USD/BRL 2.8 million the previous season. exchange rate. If the ICE #11 contract falls too far, mills in Brazil will focus on ethanol instead In our base case prices, we see strong support of sugar, assuming a fixed currency exchange for raw sugar values, given the expectations rate. We estimate the current price level for for demand growth and the modest build-up mills to change from sugar production to of stocks. We forecast prices to average ethanol production at near USc 22/pound. USc 23.5/pound in 2011/12, a historically In the medium term, we assume this support high price, but down USc 4.5/pound from the level will fluctuate between USc 18/pound previous season’s average. We see downside and USc 22/pound. In our view, there will risk bias being moderated by demand be strong support in the international sugar expectations and the increasing competition price at levels that encourage ethanol of ethanol for cane sugar in Brazil. production over sugar production. Given our In our high case, better economic growth outlook on ethanol prices, we forecast this and a weaker devaluation of the US dollar support level to be near our USc 22/pound will add further support for the sugar market. price forecast for raw sugar. Looking further With a stronger US dollar, the value of sugar out the curve, the growing flex-fuel fleet in in Brazilian reais will fall, meaning that Brazil and diminished investment in sugar international futures contracts—all priced in capacity will likely keep the domestic market US dollars—will have to increase to offset the tight. The government has implemented falls in real value for Brazilian mills. Speculator some legislation to support ethanol output interest in sugar could also add a supportive and has threatened more policy measures, element if economic growth expectations are but in our view, the main deciding factor in revised higher; the speculator net long the production of ethanol will be the price positions were heavily liquidated in 2H due to of sugar on the NY market. A shortfall of sugar heightened market uncertainty. Speculators for ethanol on the Brazilian market due to may increase the net long position if bullish elevated sugar prices may result in further economic growth triggers a risk-on corn ethanol imports from the US as in 2011. environment but we expect this to be Chinese sugar inventories are at very low tempered by the better supply expected levels currently, and government-buying will in the new season. Figure 3.16: Global sugar production and surplus/deficit, Figure 3.17: Brazilian ethanol and sugar price inter-relationship 2000/01-2011/12f 10 200 26 180 5 160 24 140 NY sugar prices 22 million tonnes 0 120 raw value 100 20 -5 80 60 18 -10 40 16 20 -15 0 14 0.90 1.00 1.10 1.20 1.30 1.40 2010/11 2000/01 2001/02 2002/03 2003/04 2004/05 2005/06 2006/07 2007/08 2008/09 2009/10 2011/12f Anhydrous ethanol price (BRL/L) Sugar equiv. (BRL1.60/USD) Sugar equiv. (BRL1.75/USD) Surplus/deficit Production Sugar equiv. (BRL1.90/USD) Source: Rabobank, FO Licht, 2011 Source: Rabobank, Bloomberg, 2011
  • 39.
    Section 3 AgriCommodity Outlooks: Sugar | 37 In the sugar futures markets, prices have been greatly impacted by macro concerns in 2011, and this is expected to remain a major price driver in 2012. If further negative macro events occur and our low case of risk-off and a higher US dollar becomes reality, sugar prices could over-correct as they did in May 2010 when they fell to USc 13.67/pound. The speculator net long position, while low relative to historic averages, could still be liquidated further, putting major pressure on prices. A stronger US dollar environment would also be unfriendly for international prices. However, even with negative conditions, the lower prices would likely generate increased buying support. We anticipate high volatility in 2012, which will partially be a function of heightened political risk which remains a dominant feature of the global sugar market. While we forecast a larger crop for India in 2012 and the potential for 4 million tonnes of exports, the Indian government policy of allowing exports only when domestic supply is assured, and generally in incremental amounts, increases uncertainty on the global market. The EU is also expected to influence the international market with government action as the bloc may face a shortage of sugar in 2012 with imports unlikely to reach demand expectations. The domestic EU crop in 2011/12 is forecast at 17.4 million tonnes, up from 15.1 million tonnes the previous season, but this additional supply is out of quota and cannot therefore be used for human consumption. Given the supply issues the EU experienced in 2011, we anticipate policy action if a shortfall is expected, but what the EU will do, and to what extent, is unknown. Figure 3.18: No. 11 Sugar managed money net long position and price, 2000/01-2011/12f 250 40 35 200 30 thousand contracts 150 25 USc/lb 100 20 15 50 10 0 5 -50 0 Nov-06 Mar-07 Jul-07 Nov-07 Mar-08 Jul-08 Nov-08 Mar-09 Jul-09 Nov-09 Mar-10 Jul-10 Nov-10 Mar-11 Jul-11 Nov-11 Managed money net long position No. 11 Sugar price (RHS) Source: Rabobank, CFTC, Bloomberg, 2011
  • 40.
    38 | RabobankOutlook 2012—Down, But Not Out COFFEE ICE Q2’11 Q3’11 Q4’11f Q1’12f Q2’12f Q3’12f Q4’12f 12-month outlook from spot USc/lb 271 257 230 220 200 180 170 350 300 Low case Base case High case Better-than-expected A large 2012 Brazilian Weather conditions 250 2011/12 Colombian crop shifts the globe affect the Brazilian crop and increased back to surplus and crop, exacerbating USc/lb 200 2012/13 production alleviates tight supply tight supply situation 150 build Arabica supply Demand growth Low stock levels 100 Recession weakens continues at 2.5%, aggravate any consumption growth supporting values production disruption, 50 in emerging markets; encouraging demand weakens, Last year’s elevated speculative buying 0 production increases prices support 2010 2011 2012 increased marginal The Vietnamese Recession fears production growth government enacts a prompt a speculator in the medium term buying programme to Historical Base case Low/high case Spot sell-off, resulting in support Robusta prices futures liquidation Source: Bloomberg, Rabobank Coffee prices are forecast to fall in 2012 due anticipate Arabica prices to revert to 2009 to the large harvests expected in Brazil and levels in 2012, due to the risks of production Vietnam, but diminished stocks will keep risks and low inventories. However, it is our view skewed to the upside. Unlike after past coffee that the elevated prices from 2010/11 will price rallies, we do not foresee a collapse of have resulted in increasing marginal gains in prices as it will take a couple of seasons to production and helping lift stock levels. replenish stocks and reverse the decade-long Consequently, we expect the 2011/12 trend of falling stock levels. The stocks-to-use season—a low season for the Brazilian crop, ratio has fallen from 44% in 2002/03—the but the largest off-season crop ever—to be a height of the coffee crisis—to our forecast nadir in the medium term for the stocks-to- 18% in 2011/12, the lowest on record. use ratio. While increases in planted area will Strong global demand is also supportive only yield output growth in three to four of prices and continues to grow at a brisk years’ time, the better prices have also 2.5% annually. encouraged better husbandry as well as increased use of inputs, both of which We anticipate the 2011/12 coffee season will are supportive for increasing output in be characterised by razor-thin stocks and high the short term. risks, but in our view this is a turning point in a decade-long trend of shrinking supply. Even Brazilian production has increased notably in with a large Brazilian crop, we do not the past as a result of higher prices, and we Figure 3.19: Global coffee ending stock and stocks-to-use, Figure 3.20: Coffee inventories and NY futures price, 2000/01-2011/12f Jul 1995-Jul 2011 60 50 8 320 45 50 7 280 40 6 240 35 40 million bags million bags 30 5 200 percent USc/lb 30 25 4 160 20 20 3 120 15 2 80 10 10 5 1 40 0 0 0 0 00/01 01/02 02/03 03/04 04/05 05/06 06/07 07/08 08/09 09/10 2011 2001 10/11f 11/12f 2007 2008 2009 2010 1995 1996 1997 1998 1999 2000 2002 2003 2004 2005 2006 Note: 1 bag=60 kilogrammes Note: 1 bag=60 kilogrammes ICE Coffee stocks US green coffee stocks Ending stocks Stocks-to-use (RHS) NY front month coffee price (RHS) Source: Rabobank, 2011 Source: Bloomberg, Rabobank, 2011
  • 41.
    Section 3 AgriCommodity Outlooks: Coffee | 39 anticipate the country will respond to current also anticipate consumption growth in origin international values with a jump in output. countries to remain robust. Global coffee The Brazilian crop has increased 80% since demand is forecast to increase 2.4% in 1981 while area has actually decreased 12.5%. 2011/12, up from 2.1% the previous season However, it has not been a uniform fall as and flat with the 10-year average of 2.5%. In higher coffee prices have led to increased our view, coffee demand will be supported area harvested. The coffee rally of 1986 by lower prices in 2012 and increases in resulted in a harvest area increase of 17% consumption at origin, especially in Brazil. three seasons later, while four years after the Coffee consumption in Brazil has been 1997 rally, harvest area in the country had growing at a 3.9% annual average in grown 14%. the past 10 seasons, and we foresee use expanding by 4.1% in 2012. Based on our Arabica production has been increasing models, Brazil will replace the US as the slower than coffee demand growth. Global largest consumer of coffee in five years. production for the variety has increased only 11% from 2001/02 to 2011/12, while total While coffee is not an essential component coffee demand has increased 29% in the of the human diet (though this is subject to same period. The difference has been made debate), the income elasticity of demand for up by increased Robusta production and the product is low; during the financial crisis stock drawdown. Reduced production from of 2007-2009 the demand for coffee Colombia in the past three seasons has continued to grow, albeit at a slightly slower exacerbated the low Arabica stocks situation pace. Coffee imports and purchases were and has been a catalyst for the 2010/11 price skewed during the crisis as companies drew rally. In 2012, Arabica supply will be more down stocks and consumers altered buying abundant because of the larger forecast habits, but the amount of coffee consumed Brazilian crop, but as this supply will not come increased 2.2% and 1.1% in 2007/08 and on-line until the start of May, volatility and risk 2008/09, respectively. However, this growth remains elevated. Our early projection for the is down from the previous five-year average 2012 Brazilian crop is 59 million 60kg bags, of 3.2%. The resilience of coffee demand was 46 million bags of which is expected to be illustrated during the severe recession of Arabica, and 7 million bags washed. The 2007-2009, and we assume this robust coming Brazilian crop is bearish given its size, demand will remain even in the face of but the previous record harvest in 2010 weaker and uncertain economic conditions occurred as prices were rallying to record in 2012. Given the resilience of consumption, highs. In our view, the difference is that higher we expect prices in 2012 to be determined prices of the past season will result in larger much more by supply-side dynamics. increases in production in other producer Arabica prices are influenced by the countries in 2012. movements in the US dollar and the Brazilian Our base case of slowing economic growth real and our expectations of a weaker US in the US and the EU is not expected to have dollar in 2012 are mildly friendly for coffee a measurable impact on coffee demand; we prices. A falling US dollar is supportive for Figure 3.21: Coffee currencies and NY futures price, Apr 2010-Oct 2011 0.058 .70 330 0.057 .68 310 0.056 .66 290 0.055 .64 270 0.054 .62 250 0.053 .60 230 0.052 .58 210 0.051 .56 190 0.050 .54 170 0.049 .52 150 0.048 .50 130 Jan-11 Feb-11 Mar-11 Apr-11 May-11 Jun-11 Jul-11 Aug-11 Sep-11 Oct-11 Nov-11 Apr-10 Jun-10 Jul-10 Aug-10 Sep-10 Oct-10 Nov-10 Dec-10 BRL/USD COP/USD NY front month coffee (USc/lb) Source: Bloomberg, Rabobank, 2011
  • 42.
    40 | RabobankOutlook 2012—Down, But Not Out coffee futures prices in NY as it means lower costs for international buyers, promoting sales, and a falling dollar generally encourages fund-buying in the commodity markets. Speculators use the agri complex as both a hedge against the falling US currency and a supporting factor. The Brazilian real is expected to appreciate in 2012, and this generally supports the Arabica market. As Brazil accounts for approximately 40% of total global Arabica output and half of total Arabica exports, moves in the Brazilian currency are an important factor in coffee prices, on both the ICE and BMF Arabica future exchanges. A stronger Brazilian real is supportive for Arabica prices as growers in Brazil receive less value for the commodity and are not inclined to sell. The relationship between the currency and prices on the terminal market breaks down when strong fundamental indicators move the market. We anticipate currency moves to be supportive for the coffee markets in 2012, but currency markets will likely be overshadowed by fundamental factors as supply is very tight and production risks are high.
  • 43.
    Section 3 AgriCommodity Outlooks: Cocoa | 41 COCOA ICE Q2’11 Q3’11 Q4’11f Q1’12f Q2’12f Q3’12f Q4’12f 12-month outlook from spot USD/tonne 3,042 2,969 2,400 2,350 2,450 2,350 2,300 3,500 3,000 Low case Base case High case Larger-than-expected Record carry-over from New government 2,500 crops from West Africa 2010/11 season; large buyer established add to high buffer product stocks in Ivory Coast, USD/tonne 2,000 stocks, pushing prices pressure terminal compromising supply lower markets certainty 1,500 Economic contraction Emerging-market Increased chocolate 1,000 results in lower demand for powder and cocoa-based chocolate and cocoa- products underpins product consumption 500 based production, the entire complex exceeds forecasts, crimping demand causing inventory 0 US/EU chocolate drawdown Better supply consumption remains 2010 2011 2012 expectations liquidate stagnant with West African short large commercial long lacklustre performance crops diminished by Historical Base case Low/high case Spot position in terminal in cocoa butter market detrimental weather, markets pushing market into large deficit Source: Bloomberg, Rabobank Abundant supply of cocoa beans and better supplements. The growth in demand for expectations for the 2011/12 crops are cocoa powder products is expected to come expected to lead prices lower in 2012. This from emerging markets. downside, as prices pass two-year lows, There is no consistent pattern for cocoa bean follows concerns about West African terminal markets in a recession since supply output dwindling. dynamics are generally more important for The cocoa bean market is vulnerable prices. During the 2007-2009 recession, cocoa to economic contraction as chocolate prices on the ICE exchange in the US ended confectionery is subject to demand higher. However, during this period cocoa destruction when incomes are under grindings fell as many chocolate makers pressure. Given the expectations of weak decreased the size of consumer products or economic growth in the EU and the US, we used substitutes for cocoa. Some of the foresee consumer chocolate demand in these decrease in grindings can also be attributed regions to be flat in 2012. However, the cocoa to manufacturers drawing down stocks. bean market is somewhat insulated from Looking to 2012, we anticipate EU and US weakness in chocolate consumption due to grindings falling from 2011 levels, but total the increasing demand for cocoa powder, global grindings to increase 3.7% in 2011/12, which is found in a variety of products, from driven mostly by the powder market. chocolate drinks and ice cream to health Figure 3.22: Cocoa grindings and YOY GDP change in mature markets, Jun 2000-Sep 2011 550 10 8 500 6 thousand tonnes 4 450 2 percent 0 400 -2 -4 350 -6 -8 300 -10 Mar-01 Dec-01 Sep-11 Jun-00 Sep-02 Jun-03 Mar-04 Dec-04 Sep-05 Jun-06 Mar-07 Dec-07 Sep-08 Jun-09 Mar-10 Dec-10 Combined US and EU grindings EU (RHS) US (RHS) Source: Rabobank, IMF, NCA, ECA, 2011
  • 44.
    42 | RabobankOutlook 2012—Down, But Not Out The cocoa bean market could be impacted capacity by the major producing regions was in 2012 by policy moves in Ivory Coast as leading to a global deficit. The average front- the new government may play a larger role month price in NY between 2004 and 2007 in the procurement and trade of cocoa. The was USD 1,591/tonne while between 2008 government announced in early November and 2011 it was USD 2,826/tonne, 78% higher. 2011 that farmers will receive a guaranteed Concerns that farmers in West Africa would cocoa bean price of between 50% and 60% abandon plantations or switch production to of the international terminal price. This is rubber supported terminal markets. It seems not expected to have a significant impact as the high prices have worked; helped by grower prices are already at or above these supportive weather, Ivory Coast production levels. The Ivory Coast government has stated reached a record in 2010/11, and government that the export tax is capped at 22%, down officials say a large crop is also expected for from a 25.3% average in 2008/09, and the 2011/12. Even with the positive impacts of lower tax will allow growers to realise greater La Niña, production would not reach such returns. The new government has outlined levels if plantations had been abandoned a plan in which exporters must pre-purchase or switched to rubber. Price signals have beans before the harvest begins as a way increased output, and alongside supportive to have funds to guarantee the farmer price. weather, this is a bearish outcome in a world The uncertainty about the government’s eating only marginally more chocolate. plans is impacting the market, and since the country accounts for one-third of global output, unpredictable government interventions will inject volatility into the international terminal markets. Due to a large carry-over of cocoa beans from 2010/11 and sizeable crops expected for the 2011/12 main harvest, the supply of cocoa beans looks bearish in the short term. With flat chocolate consumption, we anticipate the butter ratio, which in the EU fell to below 1.0 in November, to continue to remain under pressure in 2012. Powder ratios are expected to continue to drive the markets. This dynamic has been the focal point of the cocoa market in the past year and we expect this to continue in early 2012. In our view, the price of cocoa beans rose to a new norm in the past four years, as the market became concerned that underinvestment in Figure 3.23: NY Cocoa prices, Nov 2000-Nov 2011 Figure 3.24: NY Cocoa commercial long position and price, 1995-2011 4,000 160 4,000 3,500 140 3,500 3,000 120 3,000 thousand contracts USD/tonne 100 2,500 USD/tonne 2,500 2,000 80 2,000 60 1,500 1,500 40 1,000 1,000 20 500 500 2011 2001 2000 2002 2003 2004 2005 2006 2007 2008 2009 2010 0 0 2011 2001 1995 1997 1999 2003 2005 2007 2009 NY cocoa price 4-year average Commercial long position NY front month cocoa price (RHS) Source: Bloomberg, Rabobank, 2011 Source: Rabobank, CFTC, 2011
  • 45.
    Section 3 AgriCommodity Outlooks: Cotton | 43 COTTON ICE Q2’11 Q3’11 Q4’11f Q1’12f Q2’12f Q3’12f Q4’12f 12-month outlook from spot USc/lb 168 108 95 85 85 80 80 200 180 Low case Base case High case 160 Demand continues to Better 2011 crops Better-than-expected 140 weaken for cotton as increase supply and economic growth 120 garment sales fall due weigh on prices spurs demand USc/lb to economic 100 contraction Lower international Lower prices result in 80 prices support lower-than-expected Higher USD reduces demand growth Southern Hemisphere 60 apparel imports into planting, shrinking 40 the US, cutting cotton Planted area growth supply supporting 20 consumption rates continues in 2012 with prices after 2H 2012 prices still high relative 0 Further risk-off prompts to historic averages Planting in the US is 2010 2011 2012 more investor unable to reach liquidation in NY estimates due to futures market; current continued drought Historical Base case Low/high case Spot 33,157 longs = 13% in Texas open interest Source: Bloomberg, Rabobank In 2012, we expect the global cotton industry synthetic fibre will come under the same to be under pressure and prices to fall due to pressure as cotton as the apparel industry the largest global crop ever and stagnant faces reduced demand growth. demand. In our view, downside price We forecast global cotton consumption in movements in 2012 will be tempered in 2011/12 to increase 1.5% while production Q1 by the battle for acres in the Northern for the 2011/12 season is expected to be Hemisphere growing regions and concerns 6.6% higher than the previous season. The about the impact of dryness on US plantings. largest contributor to demand growth is As a consumer good and not a food product, expected to be emerging markets, especially cotton is more susceptible to economic China. Apparel demand in China has not downturns than the rest of the agri complex, slowed as it has in the US; while the Chinese and this was evident in price movements economy cooled in 2011, buyers purchased during the past recessions. In our view, cotton a record amount of textiles. Growth is demand will be squeezed on both sides in forecast to slow further in 2012 in China, 2012, as high prices for the fibre in the past but we anticipate the consumption of season resulted in higher priced yarn and apparel will remain strong. Although global textiles; high unemployment and concerns demand for cotton and textiles is being about household incomes have also resulted increasingly driven by China, the country in increasingly cost-conscious consumers. cannot absorb all of the fibre. We expect Garments made from higher priced cotton prices will have to move lower in order to are reaching retail outlets as the growth in the stimulate demand outside of China. US and EU economies remains anaemic and The US drought, which began in consumer confidence low. Prices of apparel October 2010 and continues today, has in the US jumped, with year-on-year increases devastated cotton production in Texas and the highest in two decades. Given the may have a lasting impact as spring plantings stable prices in the months leading up to could be threatened. The drought is likely November 2011, higher priced textiles to have reduced the US 2010/11 cotton will remain the norm for much of the first production estimate by 2 million bales, or half of 2012 and will continue to impede 11%. The current La Niña pattern is forecast to demand growth. remain in place for the second winter in a row. The increased use of synthetic fibres worsens A La Niña pattern generally results in lower the cotton outlook further. In the 2010/11 precipitation in the Texas/Oklahoma region. season, when cotton prices reached all-time Together the two states accounted for 54% highs, many textile producers blended more of total acreage planted in 2011. The National synthetic fibres, reducing the demand for Oceanic and Atmospheric Administration of natural cotton. Synthetic fibre production in the US projects the main cotton growing China, the largest producer, is forecast to have region to remain dryer and warmer than reached a record high in 2011. In 2012, average. Time remains for the drought to
  • 46.
    44 | RabobankOutlook 2012—Down, But Not Out Figure 3.25: Cotton and S&P GSCI Agriculture Index price performance in recessions, 1970-2009 2.0 1.8 Indexed to start of recession 1.6 1.4 1.2 1.0 0.8 0.6 0.4 1981 1991 1970 1973 1975 1982 2007 2008 ICE cotton front month S&P agri index Source: Bloomberg, Rabobank, MBER, 2011 break before plantings, but the weather The cotton price on the NY market will projections for the 2012 US cotton crop have to strike a balance between promoting are bullish. consumption outside of China and encouraging enough US growers to plant Cotton will compete with the other row in the spring of 2012. Given these dynamics, crops in 2012 for acres, and as prices in the we expect Q1 2012 to be the most supported agri complex are elevated, we do not expect period for cotton prices, but if benign weather a collapse of cotton values. US farmers supports the US crop outlook, continued increased planted area 34% for the 2011/12 downside is expected. Any correction in the season as prices reached new nominal cotton price could be amplified, depending records. A high abandonment rate of on the state of the global economy. 33% in the season was the result of the devastating drought. For 2012, our early projections are for US farmers to decrease planting to 11 million acres. We assume that the weather conditions will improve in Texas, allowing for a more average abandonment rate and yield. Given this, 2012 output is expected to exceed the 2011 harvest. Figure 3.26: Global and Chinese cotton consumption, Figure 3.27: World cotton production and surplus/deficit, 1971/72-2011/12f 1991/92-2011/12f 160 60 15 130 140 10 50 120 120 5 40 110 million bales million bales million bales million bales 100 0 80 30 100 -5 60 20 90 -10 40 10 -15 80 20 0 0 -20 70 00/01 91/92 92/93 93/94 94/95 95/96 96/97 97/98 98/99 99/00 01/02 02/03 03/04 04/05 05/06 06/07 07/08 08/09 09/10 10/11f 11/12f 1971/72 1976/77 1981/82 1986/87 1991/92 1996/97 2001/02 2006/07 2011/12f World China (RHS) Surplus/deficit Production (RHS) Source: Rabobank, USDA, 2011 Source: Rabobank, USDA, 2011
  • 47.
    Section 3 AgriCommodity Outlooks: Livestock | 45 LIVESTOCK LIVE CATTLE LEAN HOGS 12-month outlook from spot 12-month outlook from spot Low case Base case High case Low case Base case High case USD strengthens Feedlot inventories La Niña persists Chinese Chinese reduce Further disease and US export fall on tight feeder past the expected substantially reduce demand due to outbreaks in China demand falters supply June end imports on the back disease recovery and result in significant of strong domestic higher domestic domestic herd Packer export profits Packers continue to USD weakens production and a production liquidations fall and with make positive profits further, resulting stronger USD negative margins driven by strong in stronger-than- Continuing economic Major importers’ they reduce export demand expected export Bank of Japan uncertainty results currencies purchases growth form intervenes to in USD weakness; appreciate against USD remains weak emerging markets weaken the yen exports remain at the USD Brazilian and against the major 1.68 million tonnes Australian currencies importers Feeder cattle price Large fall in the corn Corn strengthens, weaken against the skyrockets on price sees producers Corn prices remain resulting in USD and major beef persistent drought increase farrowings under USD 6.50/lb producers scaling importing currencies conditions and raise herd and above USD 6/lb back production inventories We expect US cattle prices to continue their in the US, further squeezing packer margins. strong performance in 2012 albeit with a Given the poor calving numbers in 2011, brief plateau in Q1 as record feedlot the shortage of feeder cattle is not expected inventories reach the market. However, to be alleviated in 2012. Packers have incurred tight feeder supply should bias price negative margins on domestically sold beef upwards from spring onward. in 2011 but have been able to at least partially recoup losses on strong Asian exports at Lean hog prices are expected to flatten profitable levels. US beef exports jumped in 2012 as US and global supply increases strongly in 2011, up over 25% YOY and up but upside risks remain with strong Asian 9.12% on the five-year average. Our forecast demand and risk of disease in the Chinese of a weakening US dollar and relatively domestic herd. Strong demand from strong Australian and Brazilian currencies, emerging-market economies is expected two of the US’s major competitors in the to provide robust support for US livestock beef export market, drive our forecast of markets in 2012. improving US beef demand from foreign Live cattle markets. However, this will also force US US live cattle prices are expected to fall in packers to reduce imports of foreign beef. Q1 2012 from their November 2011 highs With the anticipated relaxation of import as record numbers of cattle on feed outstrip restrictions by Japan and the recent demand in the near term. A record drought ratification of the US–Korea Free Trade in the southern US has left producers with a Agreement, we see both improved market severe shortage of pasture and resulted in access and export demand providing strong higher placements of feeder cattle this year, support for US beef prices in 2012. However, at lighter weights than normal. The this upside will be somewhat tempered if September placement of cattle under economic conditions deteriorate much 600 pounds was 685,000 head, compared further and emerging-market economy with 510,000 head in August 2010—a 34% growth slows. increase—while in October 2011, the year- on-year spread narrowed to an 11% increase. These restrictions currently require US beef We anticipate the lower weights and increase cattle to be 20 months of age or younger in placements will result in a large amount at the time of slaughter, but under new of live cattle being brought to market in the proposals, the maximum import age is likely early months of 2012 as cattle placed into to be increased to 30 months. The catalyst for feedlots in July, August and September of the relaxation of restrictions has been the 2011 work their way through the system. decline in Japan’s domestic beef production following the tsunami in March 2011 and Tight supplies of feeder cattle mean that live resulting radioactive contamination in cattle prices in Q2 2012 are expected to rise the Japanese agri complex. With imports
  • 48.
    46 | RabobankOutlook 2012—Down, But Not Out of 351 million pounds, Japan was the third- Lean hogs largest export market for US beef in 2010. Momentum in the US lean hog market is However, their imports in 2010 were 61.7% expected to wane in 2012 as producers below where they were in 2003 at 918 million increase farrowing to meet demand and pounds, before restrictions were imposed. Chinese import growth slows. This is coming Japan’s relaxation of the age restriction on off the back of strong bullish momentum in US beef opens the market to heavier carcass the US lean hog market in 2011. US herd weights. If the yen continues its strong inventories in 2011 rose by 2.5% in Q3 from performance against the US dollar, we expect the traditional seasonal low at the end of Q1; there to be strong upside potential for US this is compared with the Q3 2010 rise of beef exports into Japan in 2012. 1.6%. Just as the cattle market benefited from a low US dollar and high export demand, so We expect to see the beef cut market too has the pork industry. Strong export continue to exhibit a large spread between demand in 2011 has helped maintain higher Choice and Select cuts in 2012 as seen in the domestic prices, a situation that will likely latter half of 2011. The catalyst for this spread continue with a weak US dollar in 2012. movement has been the entry of Walmart into the Choice beef market. Walmart has Pork producers and processors have been long been a retailer of Select cuts, the lowest challenged with slowing margin growth due of three USDA grades of beef at the retail level to the upward shift in corn prices. CBOT corn in the US. However, in an effort to increase prices averaged 61% higher in 2011 than in sales and attract a higher value customer, the 2010. As a percentage of total feed cost in the world’s largest retailer has added Choice cuts, raising of US lean hogs, corn has risen from the midlevel retail cut, to their meat aisle. 49.6% to 54.6% due to both the higher corn This move has increased the spread between cost and the 11.8% fall in the price of soymeal. Choice and Select cuts to a full USD 19/cwt Using a 3:1 feed conversion ratio and from a pre-Walmart entry spread of a assuming a 75% corn feed mix, the cost of mere USD 3/cwt. Over 50% of Walmart’s adding one pound to a hog under the current 260 billion dollar income came from grocery April 2012 live hog crush is USD 0.42/pound. sales in 2010. Given Walmart’s market share, While US breeding stocks increased 1.3% in packers have been bidding up the price of November, eventual year-on-year expansion live cattle, despite negative domestic margins, is uncertain due to the relatively high price in an effort to capture long-term business of corn. Current lean hog packer margins for from the new player in the Choice cut space. December 2011-April 2012 indicate a profit We see the entry of such a retailer into the of USD 8.58/cwt, a USD 10.27/cwt turnaround Choice cut market as being supportive of from the same crush last year. In the prices for 2012 and expect the spread December-April crush, corn accounts for between wholesale boxed Choice cuts 55% of total feed cost, a rise of 5% from the and wholesale boxed Select cuts to remain same crush 12 months ago. November 2010 stable at current levels. saw producers working with a corn cost of USD 60.01/head, which rose to Figure 3.28: US beef prices and inflation, Jan 2004-Jul 2011 Figure 3.29: US boxed beef cutout value 600 lbs-900 lbs spread, Nov 2009-Nov 2011 200 6 200 180 5 190 160 4 140 180 3 index points 120 170 USD/cwt 2 USD/cwt 100 160 1 80 0 150 60 40 -1 140 20 -2 130 0 -3 120 Feb-11 Jul-11 Jan-04 Jun-04 Nov-04 Apr-05 Sep-05 Feb-06 Jul-06 Dec-06 May-07 Oct-07 Mar-08 Aug-08 Jan-09 Jun-09 Nov-09 Apr-10 Sep-10 Jan-11 Mar-11 May-11 Jul-11 Sep-11 Nov-11 Nov-09 Jan-10 Mar-10 May-10 Jul-10 Sep-10 Nov-10 Boxed beef Choice cut US CPI (RHS) Select cut spot price Choice cut spot price Source: Rabobank, USDA, Bloomberg, 2011 Source: Rabobank, USDA, Bloomberg, 2011
  • 49.
    Section 3 AgriCommodity Outlooks: Livestock | 47 USD 67.14/head in November 2011, though Japan, the largest export market for US pork, the increase in the price of lean hogs more increased demand by 14% for the period of than offset this. This upward movement in the January to October compared to the same lean hog market has been driven, to a large period in 2010. The increase in demand was extent, by strong export demand. The January driven by the appreciation of the yen against to September export figures released by the the US dollar. Pork export demand is USDA report pork exports at 1.68 million increasingly exposed to currency fluctuations tonnes. This equals a 288 thousand tonne as the Bank of Japan continues to intervene in increase year-on-year or a 20.6% increase the foreign exchange market and states that in volume and a 40.5% increase in value. it will continue to do so in order to support domestic exports on a lower yen. There is a risk of weaker pork exports into China in 2012 as domestic producers recover from disease outbreaks and scale up production. This increase in production has already been seen to a degree, as Chinese producers reacted to a 139% price rise in the five months to July 2011. There was widespread liquidation of the Chinese domestic hog herd in 2011 due to disease and this resulted in a larger-than-expected shortfall in domestic production. In the wake of this shortage, imports of US pork in China rose 67.5% in the first three quarters of 2011, a figure that rises to 376% if Taiwan and Hong Kong numbers are excluded. Unsurprisingly, the sharp increase in prices has since resulted in increased herd-building and increases in animals brought to market, resulting in a fall from the June high of CNY 19.8/pound. With pork considered to be of national strategic importance to China, the government has initiated large campaigns to reduce the outbreaks of foot-and-mouth disease and is simultaneously seeking to modernise the production chain, with the ultimate goal of reaching self-sufficiency. Figure 3.30: Chinese pork spot prices, Jan 2009-Nov 2011 Figure 3.31: China’s pork imports volume, Jan 2010-Oct 2011 21 70 19 17 60 thousand tonnes 15 50 CNY/kg 13 40 11 30 9 20 7 10 5 0 Jan-11 Mar-11 May-11 Jul-11 Sep-11 Nov-11 Jan-09 Mar-09 May-09 Jul-09 Sep-09 Nov-09 Jan-10 Mar-10 May-10 Jul-10 Sep-10 Nov-10 Jan Feb Mar Apr May Jun Jul Aug Sep Oct Nov Dec Note: Spot price is as reported on the Jilin Market 3-year range 2011 2010 3-year average Source: Rabobank, Bloomberg, 2011 Source: Rabobank, Bloomberg, 2011
  • 50.
    Appendix | 49 Appendix Global agri commodity balance sheets Global corn supply & demand Rabobank USDA (1,000 Ha/1,000 Mt) 07/08 08/09 09/10 10/11f 11/12f 12/13f 10/11f 11/12f Beginning stocks 110,069 132,272 147,197 144,047 129,869 120,112 144,047 129,038 Area harvested 160,534 158,417 157,763 163,221 168,240 168,830 163,221 168,036 Yield 4.9 5.0 5.2 5.1 5.1 5.2 5.1 5.1 Production 793,615 798,824 819,607 827,393 855,781 884,505 828,687 858,989 Imports 98,489 82,587 89,756 91,302 93,311 99,739 90,088 92,111 Total supply 1,002,173 1,013,683 1,056,560 1,062,742 1,078,962 1,104,357 1,062,822 1,080,138 Exports 98,614 84,467 96,810 90,140 96,777 99,407 90,451 95,142 Feed consumption 496,838 479,294 488,656 493,740 507,266 514,935 494,040 508,525 FSI consumption 275,404 300,851 327,047 348,993 354,806 366,255 349,293 354,901 Total consumption 772,242 780,145 815,703 842,733 862,072 881,190 843,333 863,426 Total use 870,856 864,612 912,513 932,873 958,850 980,597 933,784 958,568 Surplus deficit 21,373 18,679 3,904 -15,340 -6,291 3,647 -14,646 -4,437 Ending stocks 131,317 149,071 144,047 129,869 120,112 123,759 124,300 121,570 Stocks/use 17.0% 19.1% 17.7% 15.4% 13.9% 12.6% 14.7% 14.1% Global wheat supply & demand Rabobank USDA (1,000 Ha/1,000 Mt) 07/08 08/09 09/10 10/11f 11/12f 12/13f 10/11f 11/12f Beginning stocks 130,646 125,949 167,098 200,905 199,493 204,656 200,905 196,126 Area harvested 217,908 224,721 227,166 222,627 222,309 221,500 222,627 222,309 Yield 2.8 3.0 3.0 2.9 3.1 3.0 2.9 3.1 Production 611,231 682,190 684,306 648,698 684,049 662,159 648,698 683,299 Imports 113,666 136,933 133,576 129,847 137,595 137,333 129,847 133,786 Total supply 855,543 945,072 984,980 979,450 1,021,137 1,004,148 979,450 1,013,211 Exports 117,416 143,660 135,799 129,188 140,799 139,491 131,373 137,299 Feed consumption 98,117 117,885 115,662 117,047 128,200 119,556 112,485 126,424 FSI consumption 515,593 516,870 532,614 534,651 547,482 542,679 539,466 546,888 Total consumption 613,710 634,755 648,276 651,698 675,682 662,235 651,951 673,312 Total use 731,126 778,415 784,075 780,886 816,481 801,726 783,324 810,611 Surplus deficit -2,479 47,435 36,030 -3,430 8,367 -75 -3,253 9,987 Ending stocks 124,417 166,657 200,905 199,493 204,656 202,422 196,126 202,600 Stocks/use 20.3% 26.3% 31.0% 30.6% 30.3% 30.6% 30.1% 30.1% Source: USDA, Rabobank, 2011
  • 51.
    50 | RabobankOutlook 2012—Down, But Not Out Global agri commodity balance sheets Global soybean supply & demand Rabobank USDA (1,000 Ha/1,000 Mt) 07/08 08/09 09/10 10/11f 11/12f 12/13f 10/11f 11/12f Beginning stocks 62,990 51,423 42,570 59,405 65,680 58,278 59,405 68,368 Area harvested 90,674 96,367 102,170 102,757 103,965 105,365 102,757 104,363 Yield 2.4 2.2 2.6 2.6 2.5 2.5 2.6 2.5 Production 221,006 211,952 260,854 263,106 257,960 263,997 264,180 258,905 Imports 78,118 77,376 86,798 88,659 96,206 100,970 88,678 94,206 Total supply 362,114 340,751 390,222 411,170 419,846 423,245 412,263 421,479 Exports 79,589 76,842 92,596 92,528 98,017 100,467 92,413 96,898 Crush 201,819 193,222 209,503 222,369 232,725 234,962 221,109 230,672 Seed/feed/residual 27,800 28,115 28,718 30,593 30,826 31,126 30,373 30,354 Total consumption 229,619 221,337 238,221 252,962 263,551 266,088 251,482 261,026 Total use 309,208 298,179 330,817 345,490 361,568 366,555 343,895 357,924 Surplus/deficit -10,084 -8,851 16,835 6,275 -7,402 -1,588 8,963 -4,813 Ending stocks 52,906 42,572 59,405 65,680 58,278 56,690 68,368 63,555 Stocks/use 23.0% 19.2% 24.9% 26.0% 22.1% 21.3% 27.2% 24.3% Global palm oil supply & demand Rabobank USDA (1,000 Mt) 07/08 08/09 09/10 10/11f 11/12f 12/13f 10/11f 11/12f Beginning stocks 4,247 4,081 4,891 5,383 4,827 5,426 5,383 5,322 Production 41,084 43,992 45,862 47,925 50,466 52,000 47,930 50,566 Imports 30,733 34,151 34,764 34,989 37,834 41,000 35,349 37,834 Total supply 76,064 82,224 85,517 88,297 93,127 98,426 88,662 93,722 Exports 32,226 34,686 35,641 38,397 39,995 40,950 36,270 38,865 Food consumption 29,616 31,293 32,583 33,786 35,932 38,088 34,361 35,932 Industrial/feed 10,264 11,160 11,910 11,287 11,774 12,400 12,709 13,539 Total consumption 39,880 42,453 44,493 45,073 47,706 50,488 47,070 49,471 Total use 72,106 77,139 80,134 83,470 87,701 91,438 83,340 88,336 Surplus deficit -289 1,004 492 -556 599 1,562 -61 64 Ending stocks 3,958 5,085 5,383 4,827 5,426 6,988 5,322 5,386 Stocks/use 9.9% 12.0% 12.1% 10.7% 11.4% 13.8% 11.3% 10.9% Source: USDA, Rabobank, 2011
  • 52.
    Appendix | 51 Globalagri commodity balance sheets Global cotton supply & demand Rabobank USDA (1,000 Ha/1,000 07/08 08/09 09/10 10/11f 11/12f 12/13f 10/11f 11/12f 480lb bales) Beginning stocks 62,266 60,868 60,803 44,238 46,297 54,650 44,238 45,219 Area harvested 32,917 30,591 30,134 33,507 35,443 35,873 33,507 36,048 Yield 3.6 3.5 3.4 3.4 3.5 3.5 3.4 3.4 Production 119,683 107,081 101,629 115,095 123,070 125,690 115,277 123,888 Imports 38,959 30,476 36,349 37,000 36,000 35,000 35,654 36,305 Total supply 220,908 198,425 198,781 196,333 205,367 215,340 195,169 205,412 Exports 39,005 30,065 35,595 37,000 36,000 35,000 35,572 36,325 Loss -2,154 -2,633 -162 31 -100 -150 31 -143 Use 123,329 110,315 119,110 113,005 114,817 119,317 114,347 114,274 Total domestic use 121,175 107,682 118,948 113,036 114,717 119,167 114,378 114,131 Total use 160,180 137,747 154,543 150,036 150,717 154,167 149,950 150,456 Surplus/deficit -3,646 -3,234 -17,481 2,090 8,253 6,373 930 9,614 Ending stocks 60,728 60,678 44,238 46,297 54,650 61,173 45,219 54,956 Stocks/use 49% 55% 37% 41% 48% 51% 40% 48% Global coffee supply & demand Rabobank USDA (1,000 60 kg bags) 06/07 07/08 08/09 09/10 10/11f 11/12f 10/11f 11/12f Beginning stocks 31,900 36,185 27,291 31,071 25,478 31,104 24,418 26,847 Arabica production 81,717 72,734 82,390 73,854 85,450 75,000 85,787 80,125 Robusta production 48,867 46,633 51,842 52,027 54,696 55,981 52,096 54,896 Total output 130,584 119,367 134,232 125,881 140,146 130,981 137,908 135,046 Imports 97,470 96,809 96,831 93,800 104,000 105,000 104,473 100,574 Total supply 259,954 252,361 258,354 250,752 269,624 267,085 266,799 262,467 Exports 98,000 96,479 97,303 93,000 103,500 105,000 107,455 102,123 Soluble use 12,857 13,584 12,376 13,144 13,400 13,900 14,694 14,595 Use 112,912 115,007 117,604 119,130 121,620 124,400 117,803 119,362 Total consumption 125,769 128,591 129,980 132,274 135,020 138,300 132,497 133,957 Total use 223,769 225,070 227,283 225,274 238,520 243,300 239,952 236,080 Surplus/deficit 4,815 -9,224 4,252 -6,393 5,126 -7,319 5,411 1,089 Ending stocks 36,185 27,291 31,071 25,478 31,104 23,785 26,847 26,387 Stocks/use 29% 21% 24% 19% 23% 17% 23% 22% Global sugar supply & demand Rabobank (1,000 Mt) 04/05 05/06 06/07 07/08 08/09 09/10 10/11f 11/12f Beginning stocks 67,553 61,225 63,962 72,699 74,296 62,581 57,889 57,007 Production 141,013 151,079 166,405 166,610 151,779 156,862 165,385 174,017 Imports 47,056 48,590 46,572 45,318 46,863 53,084 51,183 50,118 Total supply 208,567 212,303 230,367 239,308 226,075 219,443 223,274 231,024 Exports 49,993 50,414 51,721 51,255 50,993 57,207 56,053 54,138 Consumption 145,169 147,274 153,341 159,947 160,258 160,150 161,397 163,942 Total use 145,169 147,274 153,341 159,947 160,258 160,150 161,397 163,942 Surplus/deficit -7,093 1,981 7,915 727 -12,610 -7,411 -882 6,054 Ending stocks 61,225 63,962 72,699 74,296 62,581 57,889 57,007 63,062 Stocks/use 42% 43% 47% 46% 39% 36% 35% 38% Global cocoa supply & demand Rabobank (1,000 tonnes) 04/05 05/06 06/07 07/08 08/09 09/10 10/11f 11/12f Gross production 3,381 3,786 3,434 3,740 3,596 3,602 4,302 4,037 Ivory Coast 1,286 1,408 1,229 1,382 1,222 1,245 1,500 1,290 Ghana 599 740 614 729 662 620 1,025 940 Net production 3,256 3,748 3,400 3,694 3,542 3,566 4,259 3,997 Grindings 3,363 3,527 3,690 3,755 3,508 3,700 3,882 4,025 Surplus/deficit -107 221 -290 -61 34 -134 378 -28 Ending stocks 1,666 1,906 1,645 1,584 1,618 1,484 1,861 1,833 Stocks/use 50% 54% 45% 42% 46% 40% 48% 46% Source: Rabobank, 2011
  • 53.
    US agri commoditybalance sheets US corn supply & demand Rabobank USDA (Mln acres/Mln bu.) 06/07 07/08 08/09 09/10 10/11f 11/12f 12/13f 10/11f 11/12f Beginning stocks 1,967 1,304 1,624 1,673 1,708 1,128 608 1,708 1,128 Area harvested 70.6 86.5 78.6 79.5 81.4 83.9 86.0 81.4 83.9 Yield 149.1 150.7 153.9 164.7 152.8 146.3 154.0 152.8 146.7 Production 10,531 13,038 12,092 13,092 12,447 12,275 13,247 12,447 12,310 Imports 12 20 14 8 28 15 15 28 15 Total supply 12,510 14,361 13,729 14,773 14,182 13,418 13,870 14,182 13,453 Exports 2,125 2,437 1,849 1,980 1,835 1,625 1,800 1,835 1,600 Feed consumption 5,540 5,858 5,182 5,125 4,792 4,700 4,550 4,792 4,600 FSI consumption 3,541 4,442 5,025 5,961 6,428 6,485 6,596 6,428 6,410 Ethanol use 2,119 3,049 3,709 4,568 5,020 5,075 5,175 5,020 5,000 Total consumption 9,081 10,300 10,207 11,086 11,219 11,185 11,146 11,219 11,010 Total use 11,207 12,737 12,056 13,066 13,054 12,810 12,946 13,054 12,610 Ending stocks 1,304 1,624 1,673 1,708 1,128 608 924 1,128 843 Stocks/use 11.6% 12.8% 13.9% 13.1% 8.6% 4.7% 7.1% 8.6% 6.7% US soybean supply & demand Rabobank USDA (Mln acres/Mln bu.) 06/07 07/08 08/09 09/10 10/11f 11/12f 12/13f 10/11f 11/12f Beginning stocks 449 574 205 138 151 215 235 151 215 Area harvested 74.6 64.1 74.7 76.4 76.6 73.7 72.9 76.6 73.7 Yield 42.85 41.73 39.73 43.98 43.46 41.40 44.00 43.46 41.34 Production 3,197 2,677 2,967 3,359 3,329 3,050 3,207 3,329 3,046 Imports 9 10 13 15 14 15 15 14 15 Total supply 3,655 3,261 3,185 3,512 3,494 3,280 3,457 3,495 3,275 Exports 1,117 1,159 1,279 1,499 1,500 1,300 1,450 1,501 1,325 Crush 1,808 1,803 1,662 1,752 1,648 1,625 1,675 1,648 1,635 Seed/feed/residual 157 94 106 110 131 120 110 131 120 Domestic consumption 1,965 1,897 1,768 1,862 1,779 1,745 1,785 1,779 1,755 Total use 3,081 3,056 3,047 3,361 3,279 3,045 3,235 3,280 3,080 Surplus/deficit 124 -369 -67 13 64 20 -13 64 -19 Ending stocks 574 205 138 151 215 235 222 215 195 Stocks/use 18.6% 6.7% 4.5% 4.5% 6.6% 7.7% 6.9% 6.5% 6.3% US wheat supply & demand Rabobank USDA (Mln acres/Mln bu.) 06/07 07/08 08/09 09/10 10/11f 11/12f 12/13f 10/11f 11/12f Beginning stocks 571 456 306 656 976 863 824 976 863 Area harvested 46.8 51.0 55.7 49.9 47.6 45.7 46.9 47.6 45.7 Yield 38.7 40.2 44.9 44.5 46.3 43.8 44.2 46.3 43.8 Production 1,808 2,051 2,499 2,218 2,207 1,999 2,073 2,207 1,999 Imports 122 113 127 119 97 120 110 97 120 Total supply 1,930 2,163 2,626 2,336 2,304 2,119 2,183 2,304 2,119 Exports 2,501 2,620 2,932 2,993 3,280 2,982 3,007 3,280 2,982 Feed consumption 117 16 255 150 132 165 145 132 160 FSI consumption 1,020 1,035 1,005 988 996 1,018 1,009 996 1,018 Total consumption 1,137 1,051 1,260 1,138 1,128 1,183 1,154 1,128 1,178 Total use 2,045 2,314 2,275 2,017 2,417 2,158 2,169 2,417 2,153 Surplus deficit -115 -150 351 318 -113 -39 14 -113 -34 Ending stocks 456 306 656 976 863 824 838 863 829 Stocks/use 22.3% 13.2% 28.9% 48.4% 35.7% 38.2% 38.6% 35.7% 38.5% US cotton supply & demand Rabobank USDA (Mln acres/1,000 bales) 06/07 07/08 08/09 09/10 10/11f 11/12f 12/13f 10/11f 11/12f Beginning stocks 6,069 9,479 10,051 6,337 2,947 3,257 3,567 2,947 2,600 Area harvested 5,152 4,245 3,063 3,047 4,360 3,900 3,900 4,330 3,986 Yield 4.2 4.5 4.2 4.0 4.1 4.1 4.6 4.2 4.1 Production 21,588 19,207 12,815 12,188 17,850 16,100 17,900 18,104 16,300 Imports 19 12 0 0 10 10 10 9 10 Total supply 27,676 28,698 22,866 18,525 20,807 19,367 21,477 21,060 18,910 Exports 12,959 13,634 13,261 12,037 14,000 12,000 13,500 14,376 11,300 Loss 303 429 -273 -9 0 0 0 184 10 Use 4,935 4,584 3,541 3,550 3,550 3,800 3,400 3,900 3,800 Total use 18,197 18,647 16,529 15,578 17,550 15,800 16,900 18,460 15,110 Net trade 12,940 13,622 13,261 12,037 13,990 11,990 13,490 14,367 11,290 Surplus/deficit 3,410 572 -3,714 -3,390 310 310 1,010 -347 1,200 Ending stocks 9,479 10,051 6,337 2,947 3,257 3,567 4,577 2,600 3,800 Stocks/use 52.1% 53.9% 38.3% 18.9% 18.6% 22.6% 27.1% 14.1% 25.1% Source: USDA, Rabobank, 2011
  • 54.
    Food & AgribusinessResearch and Advisory Global Financial Markets Agri Commodity Markets Research (ACMR) Corporate sales contacts Luke Chandler—Global Head ASIA—Brandon Ma +44 20 7664 9514 +852 2103 2688 luke.chandler@rabobank.com brandon.ma@rabobank.com Keith Flury—Senior Commodity Analyst ASIA—David Teakle +44 20 7664 9676 +852 2103 2686 keith.flury@rabobank.com david.teakle@rabobank.com Erin FitzPatrick—Commodity Analyst AUSTRALIA—Terry Allom +44 20 7664 9540 +61 2 8115 3103 erin.fitzpatrick@rabobank.com terry.allom@rabobank.com Nick Higgins—Commodity Analyst BRAZIL—Sergio Nakashima +44 20 7664 9543 +55 11 5503 7150 nicholas.higgins@rabobank.com sergio.nakashima@rabobank.com Contributing Analysts CHILE—Gaston Iroume Tracey Allen—Sydney, Australia +56 2 4498536 tracey.allen@rabobank.com gaston.iroume@rabobank.com Dean Smith—Sydney, Australia EUROPE—David Kane dean.smith@rabobank.com +44 20 7664 9744 david.kane@rabobank.com Paula Savanti—Buenos Aires, Argentina paula.savanti@rabobank.com EUROPE—Arjan Veerhoek +31 30 216 9040 Andy Duff—São Paulo, Brazil arjan.veerhoek@rabobank.com andy.duff@rabobank.com MEXICO—Marco Garcia Guilherme Melo—São Paulo, Brazil +52 55 52610029 guilherme.melo@rabobank.com marco.garcia@rabobank.com Renato Rasmussen—São Paulo, Brazil US—Jeff Gibson renato.rasmussen@rabobank.com +1 212 808 6877 jeff.gibson@rabobank.com Jean-Yves Chow—Hong Kong, China Jeanyves.chow@rabobank.com US—Neil Williamson +1 212 808 6966 Daron Hoffman — Shanghai, China neil.williamson@rabobank.com daron.hoffman@rabobank.com Ken Shwedel—Mexico City, Mexico ken.shwedel@rabobank.com Pawan Kumar—Singapore, Singapore pawan.kumar@rabobank.com Scott Colvin—London, UK scott.colvin@rabobank.com Sterling Liddell—Saint Louis, USA sterling.liddell@raboag.com www.rabotransact.com
  • 55.