The historical diamond industry underwent major transformations:
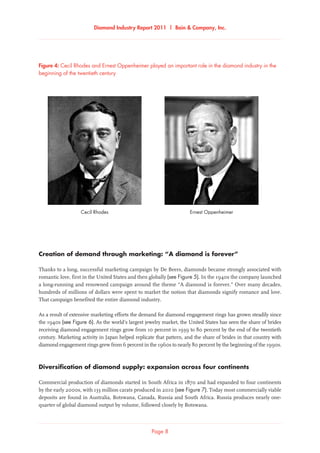
1) Discovery of diamond deposits in South Africa in 1870 led to consolidation under De Beers, which came to control 90% of global supply by early 1900s.
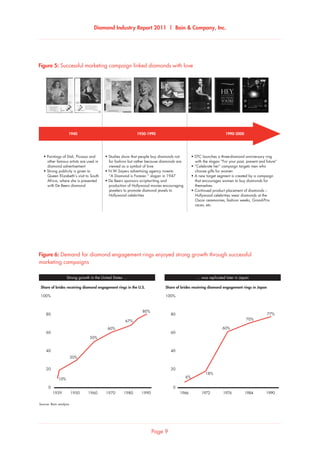
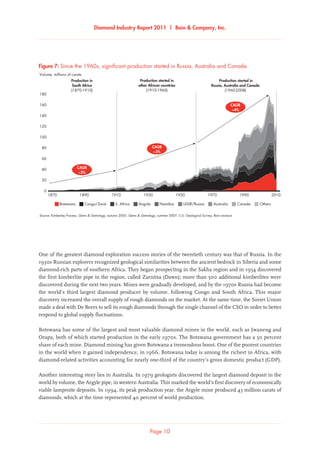
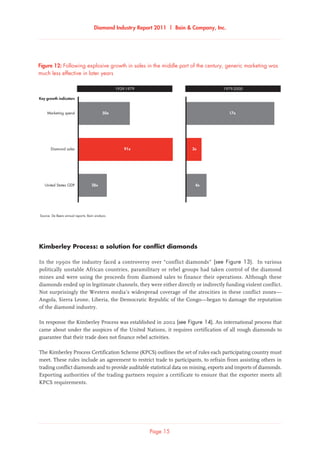
2) Marketing campaigns in later 1900s like "A Diamond is Forever" created vast new demand for diamonds as symbols of love and status.
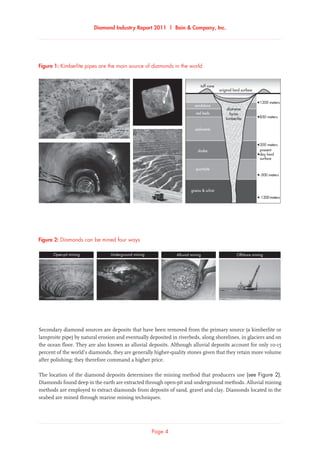
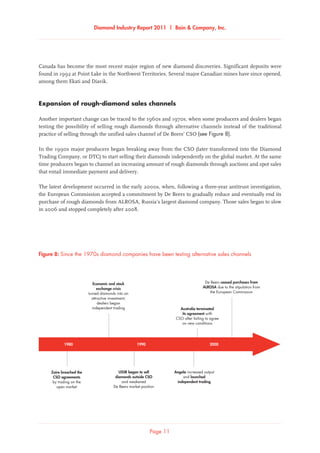
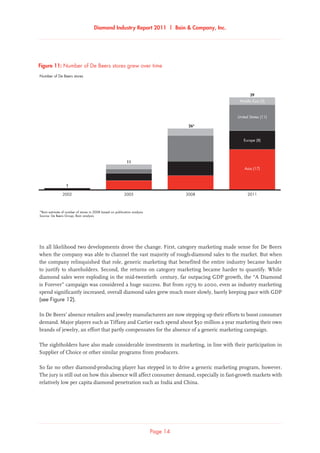
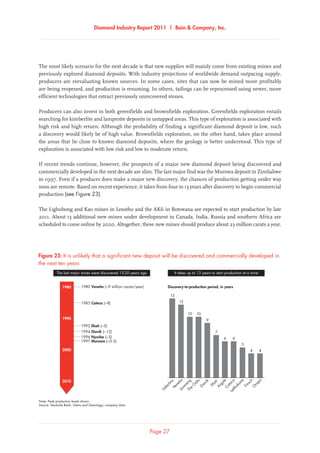
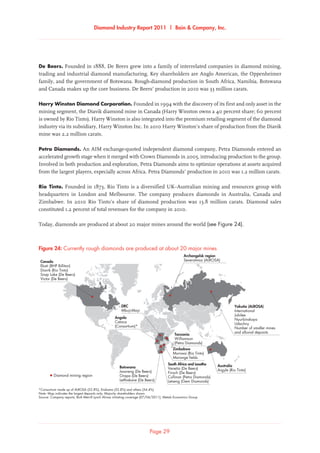
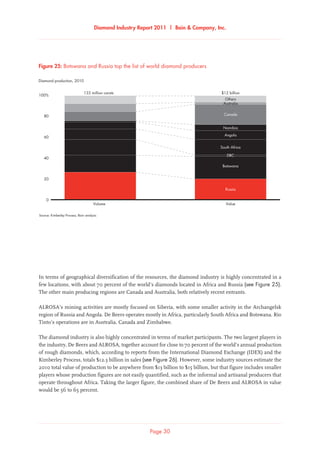
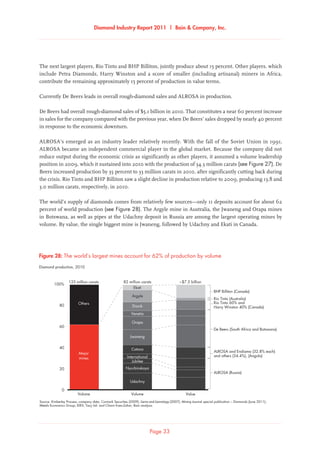
3) Supply diversified across four continents as new mines opened in Russia, Canada, Australia, and Africa beyond South Africa.
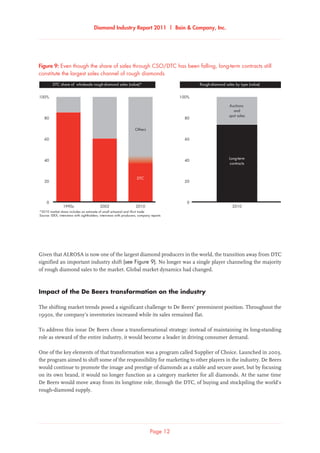
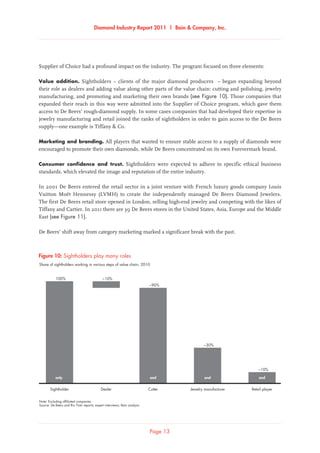
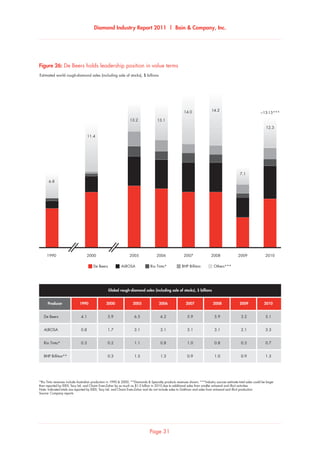
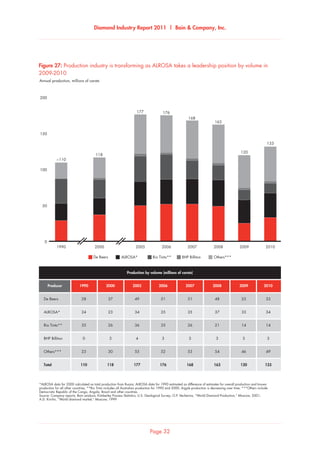
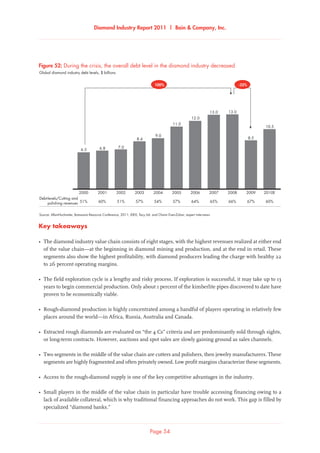
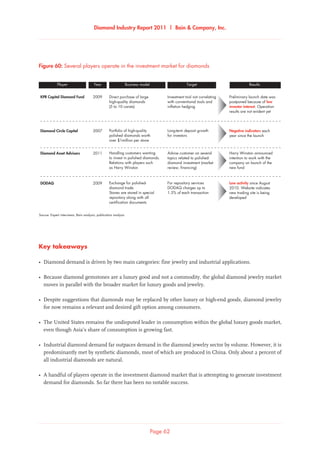
4) Changes introduced by De Beers opened the industry to more competition in rough diamond sales and production.