Download to read offline


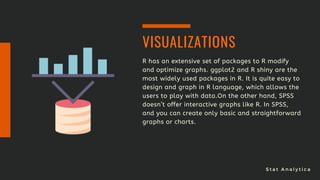


This document compares the statistical programming languages R and SPSS. It discusses that R is an open-source language developed for statistical analysis, while SPSS is a commercial product focused on social science data. Some key differences covered include that R has faster updates but a less user-friendly interface than SPSS. R also has better data visualization, lower costs, and larger community support than SPSS. Overall, the document provides an overview of the capabilities and differences between the two statistical languages.