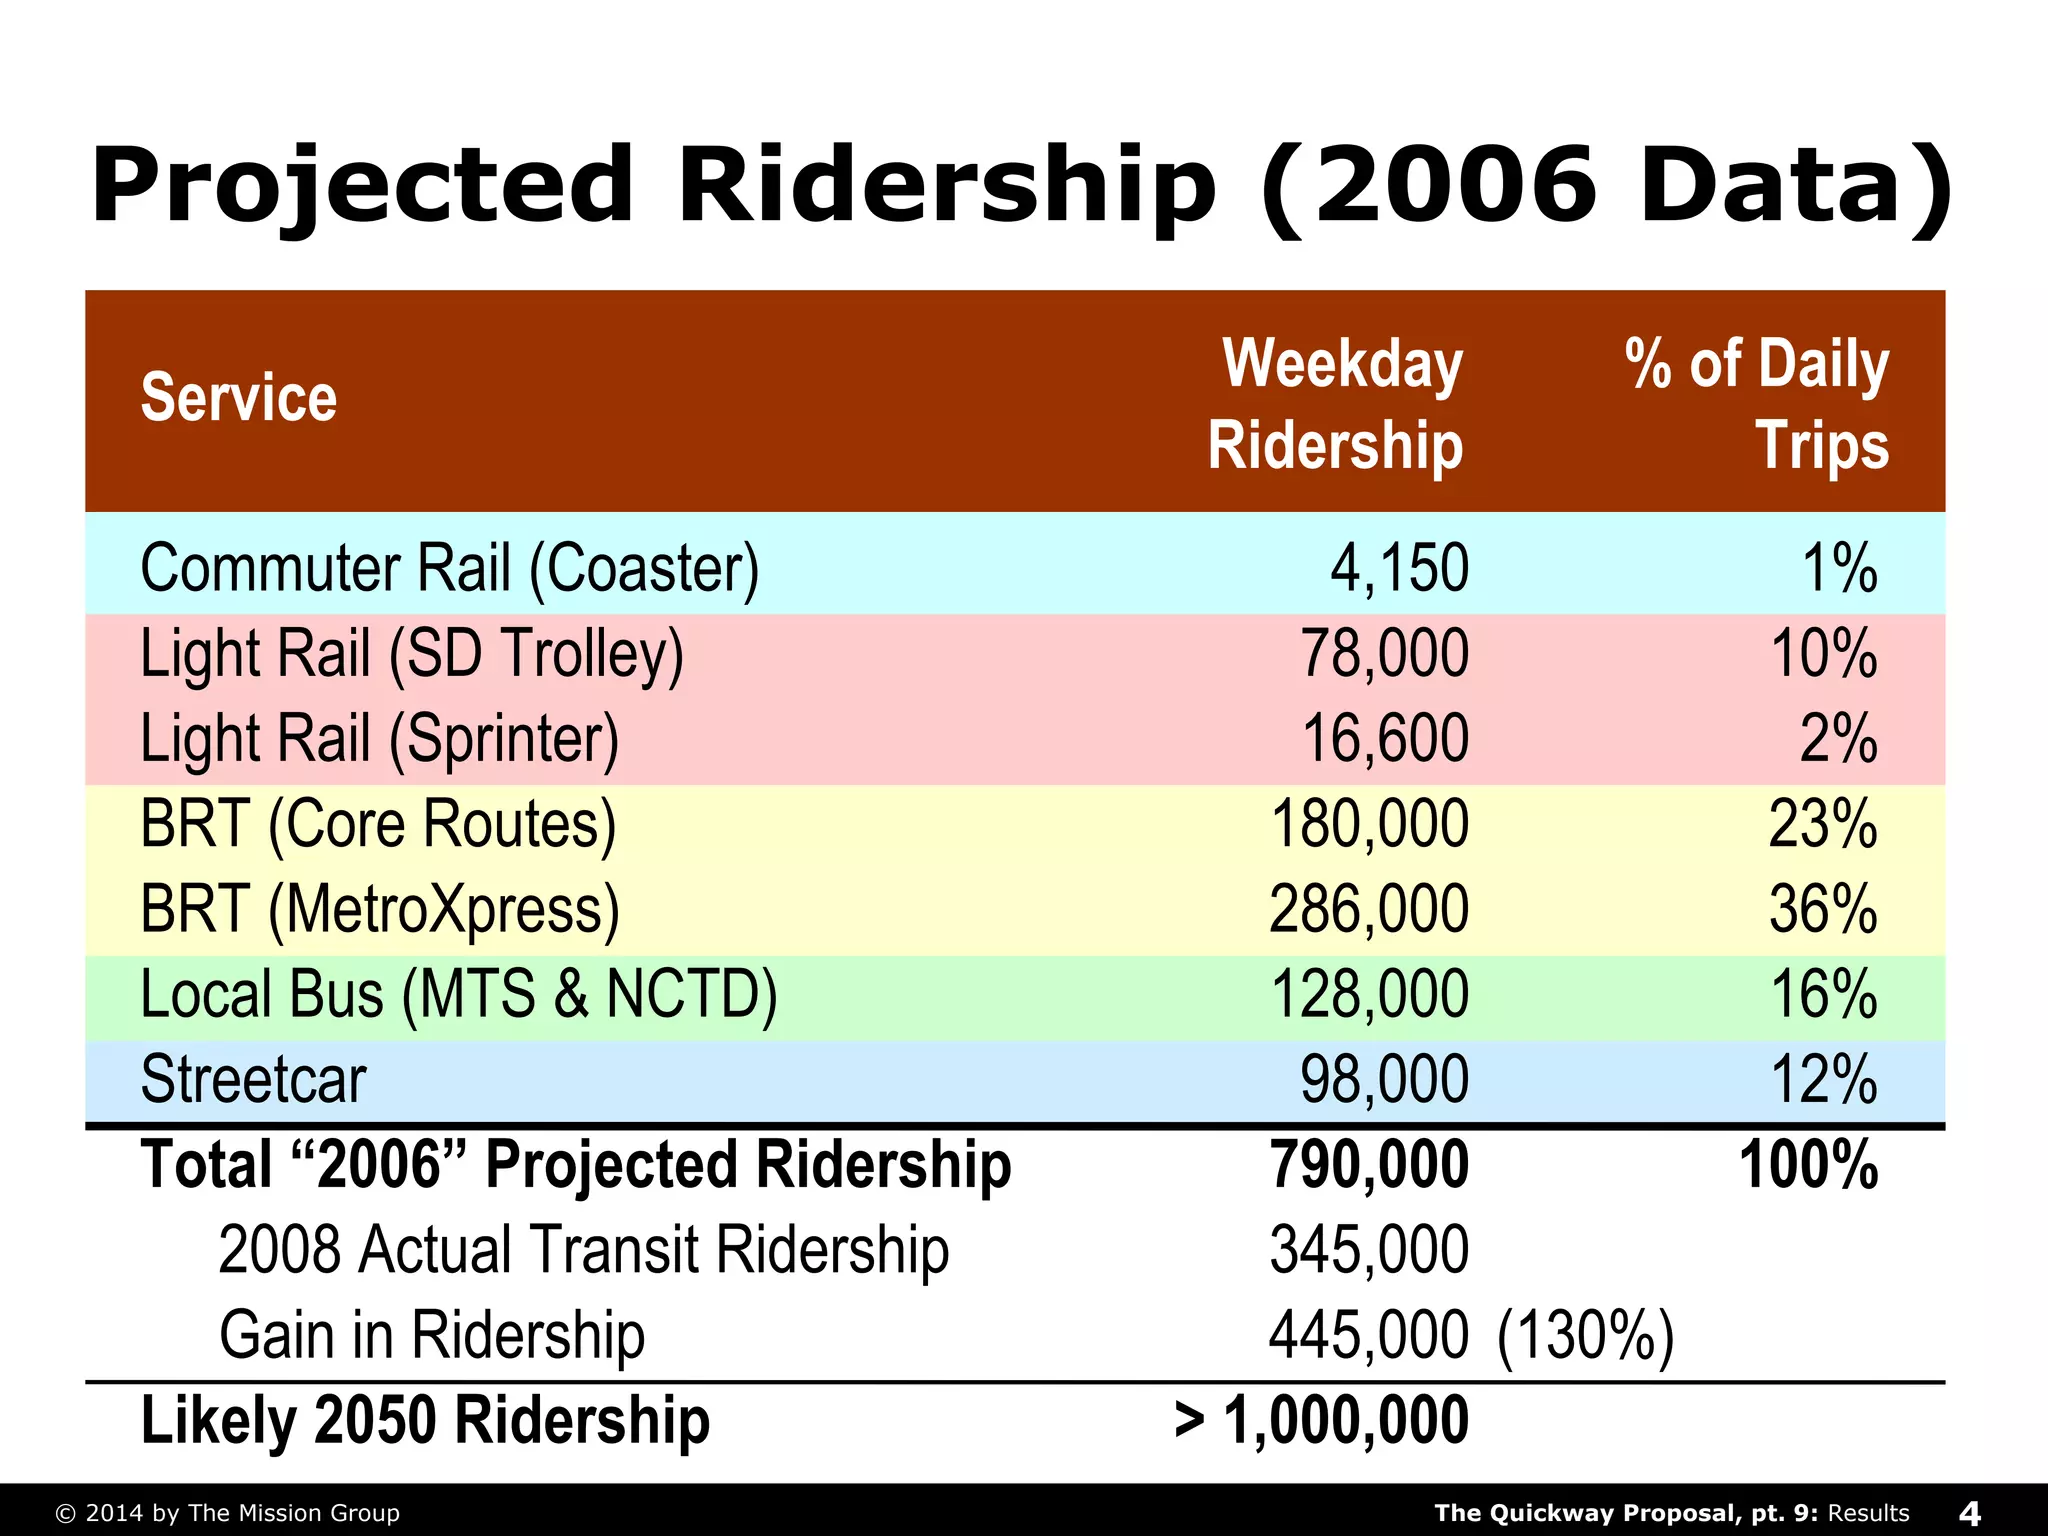
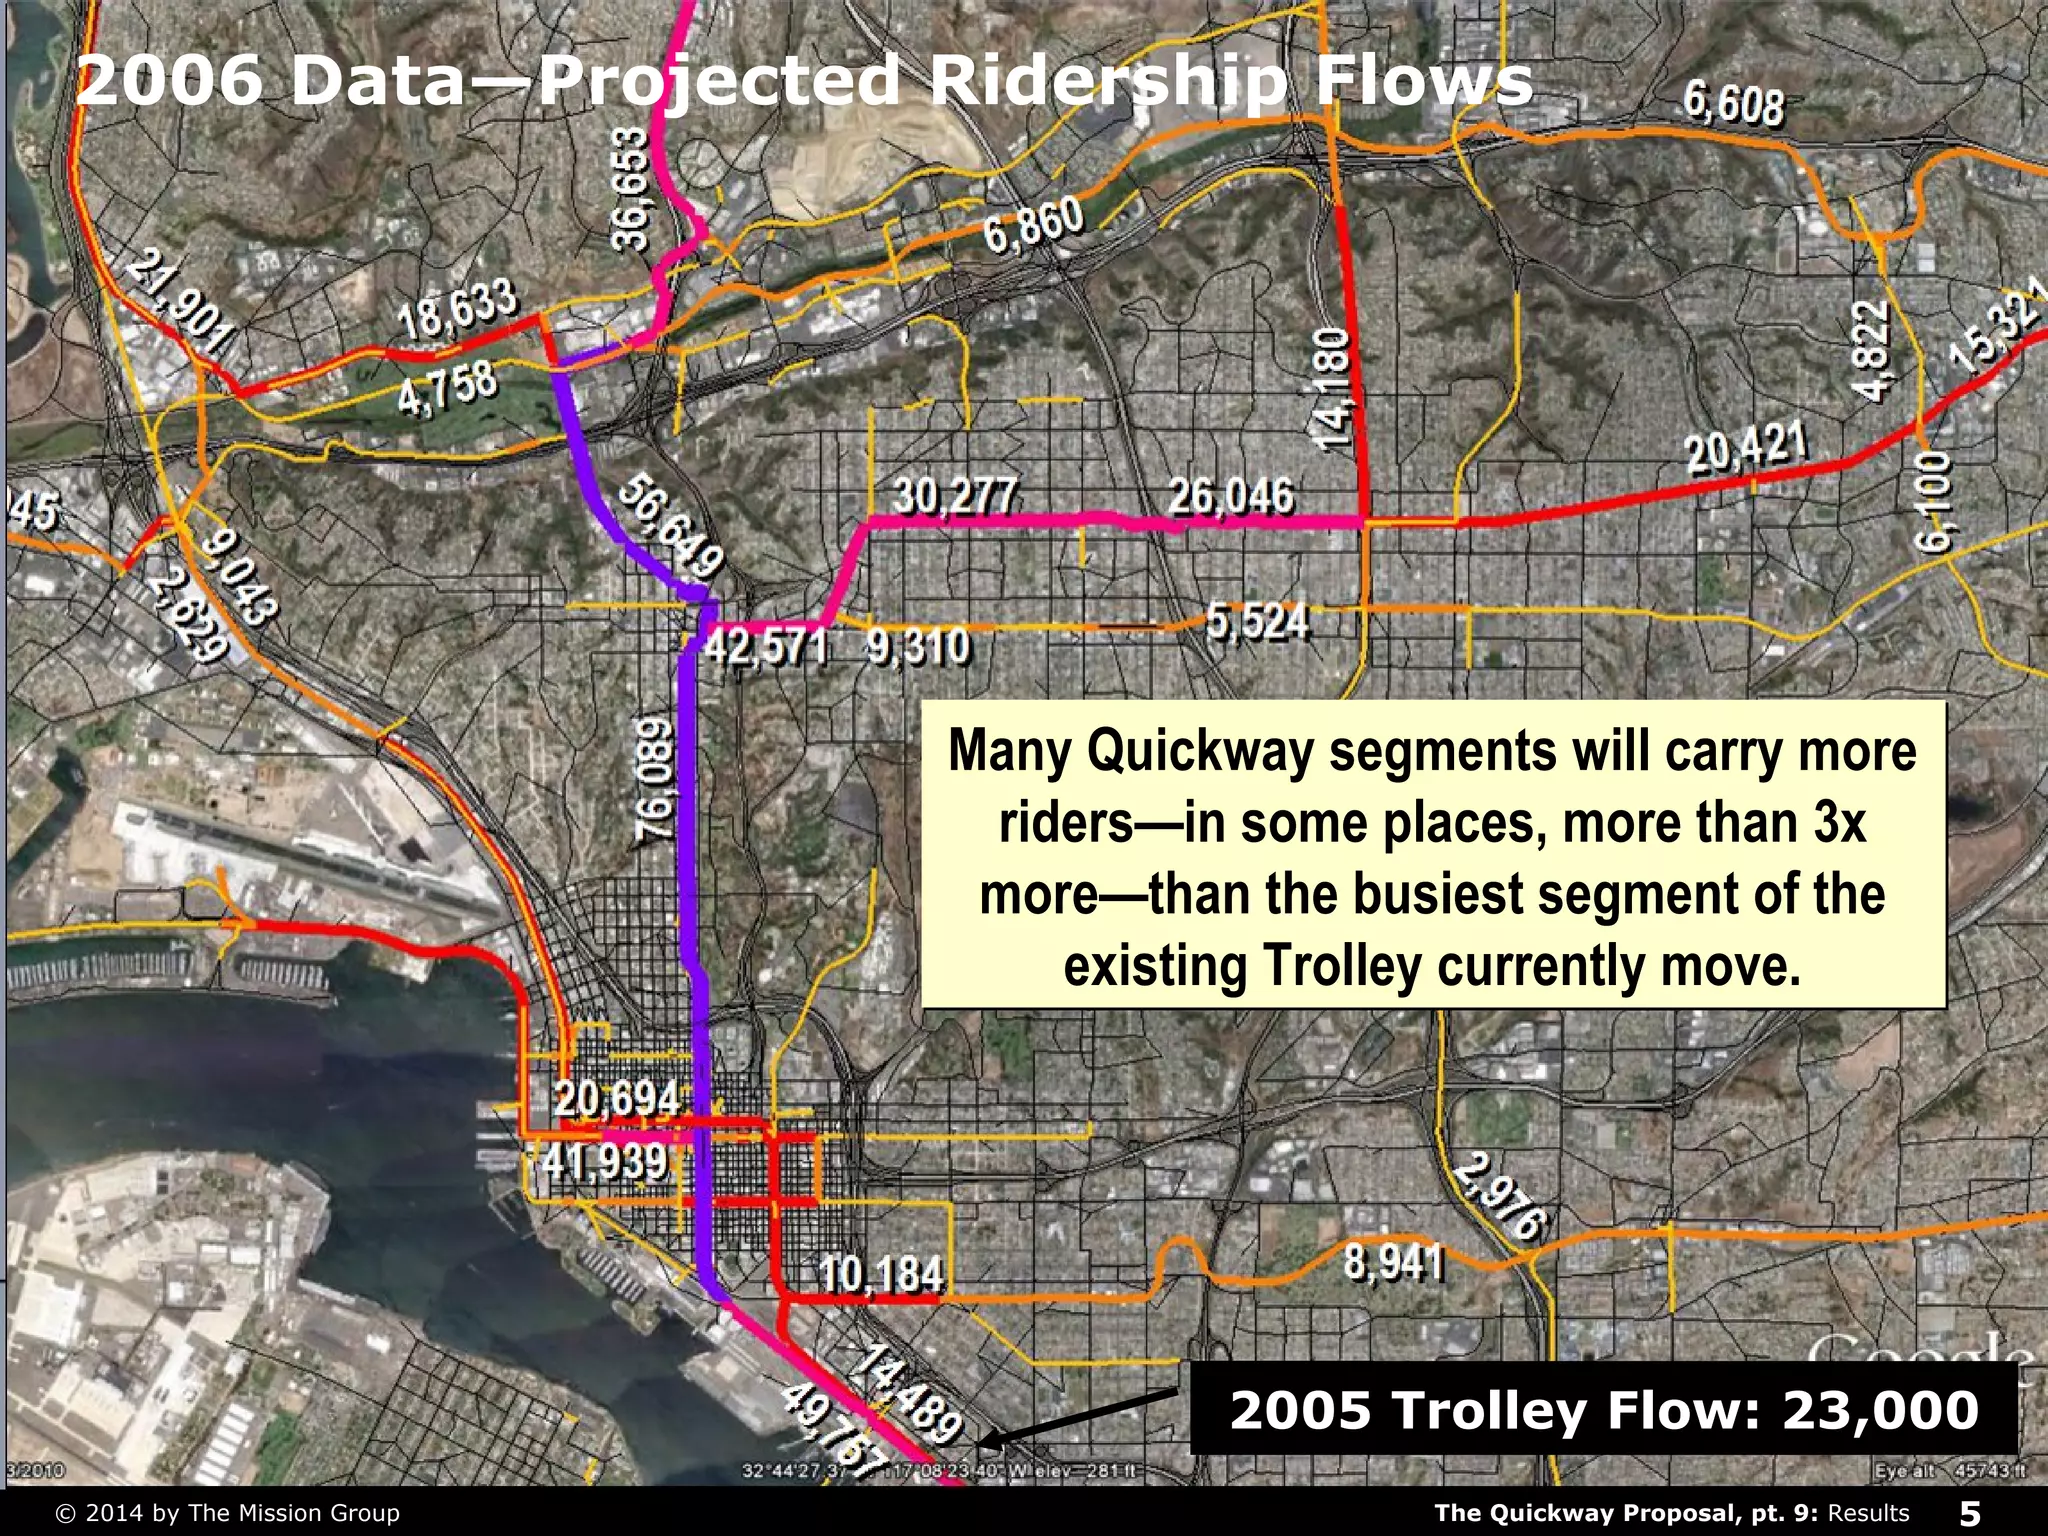
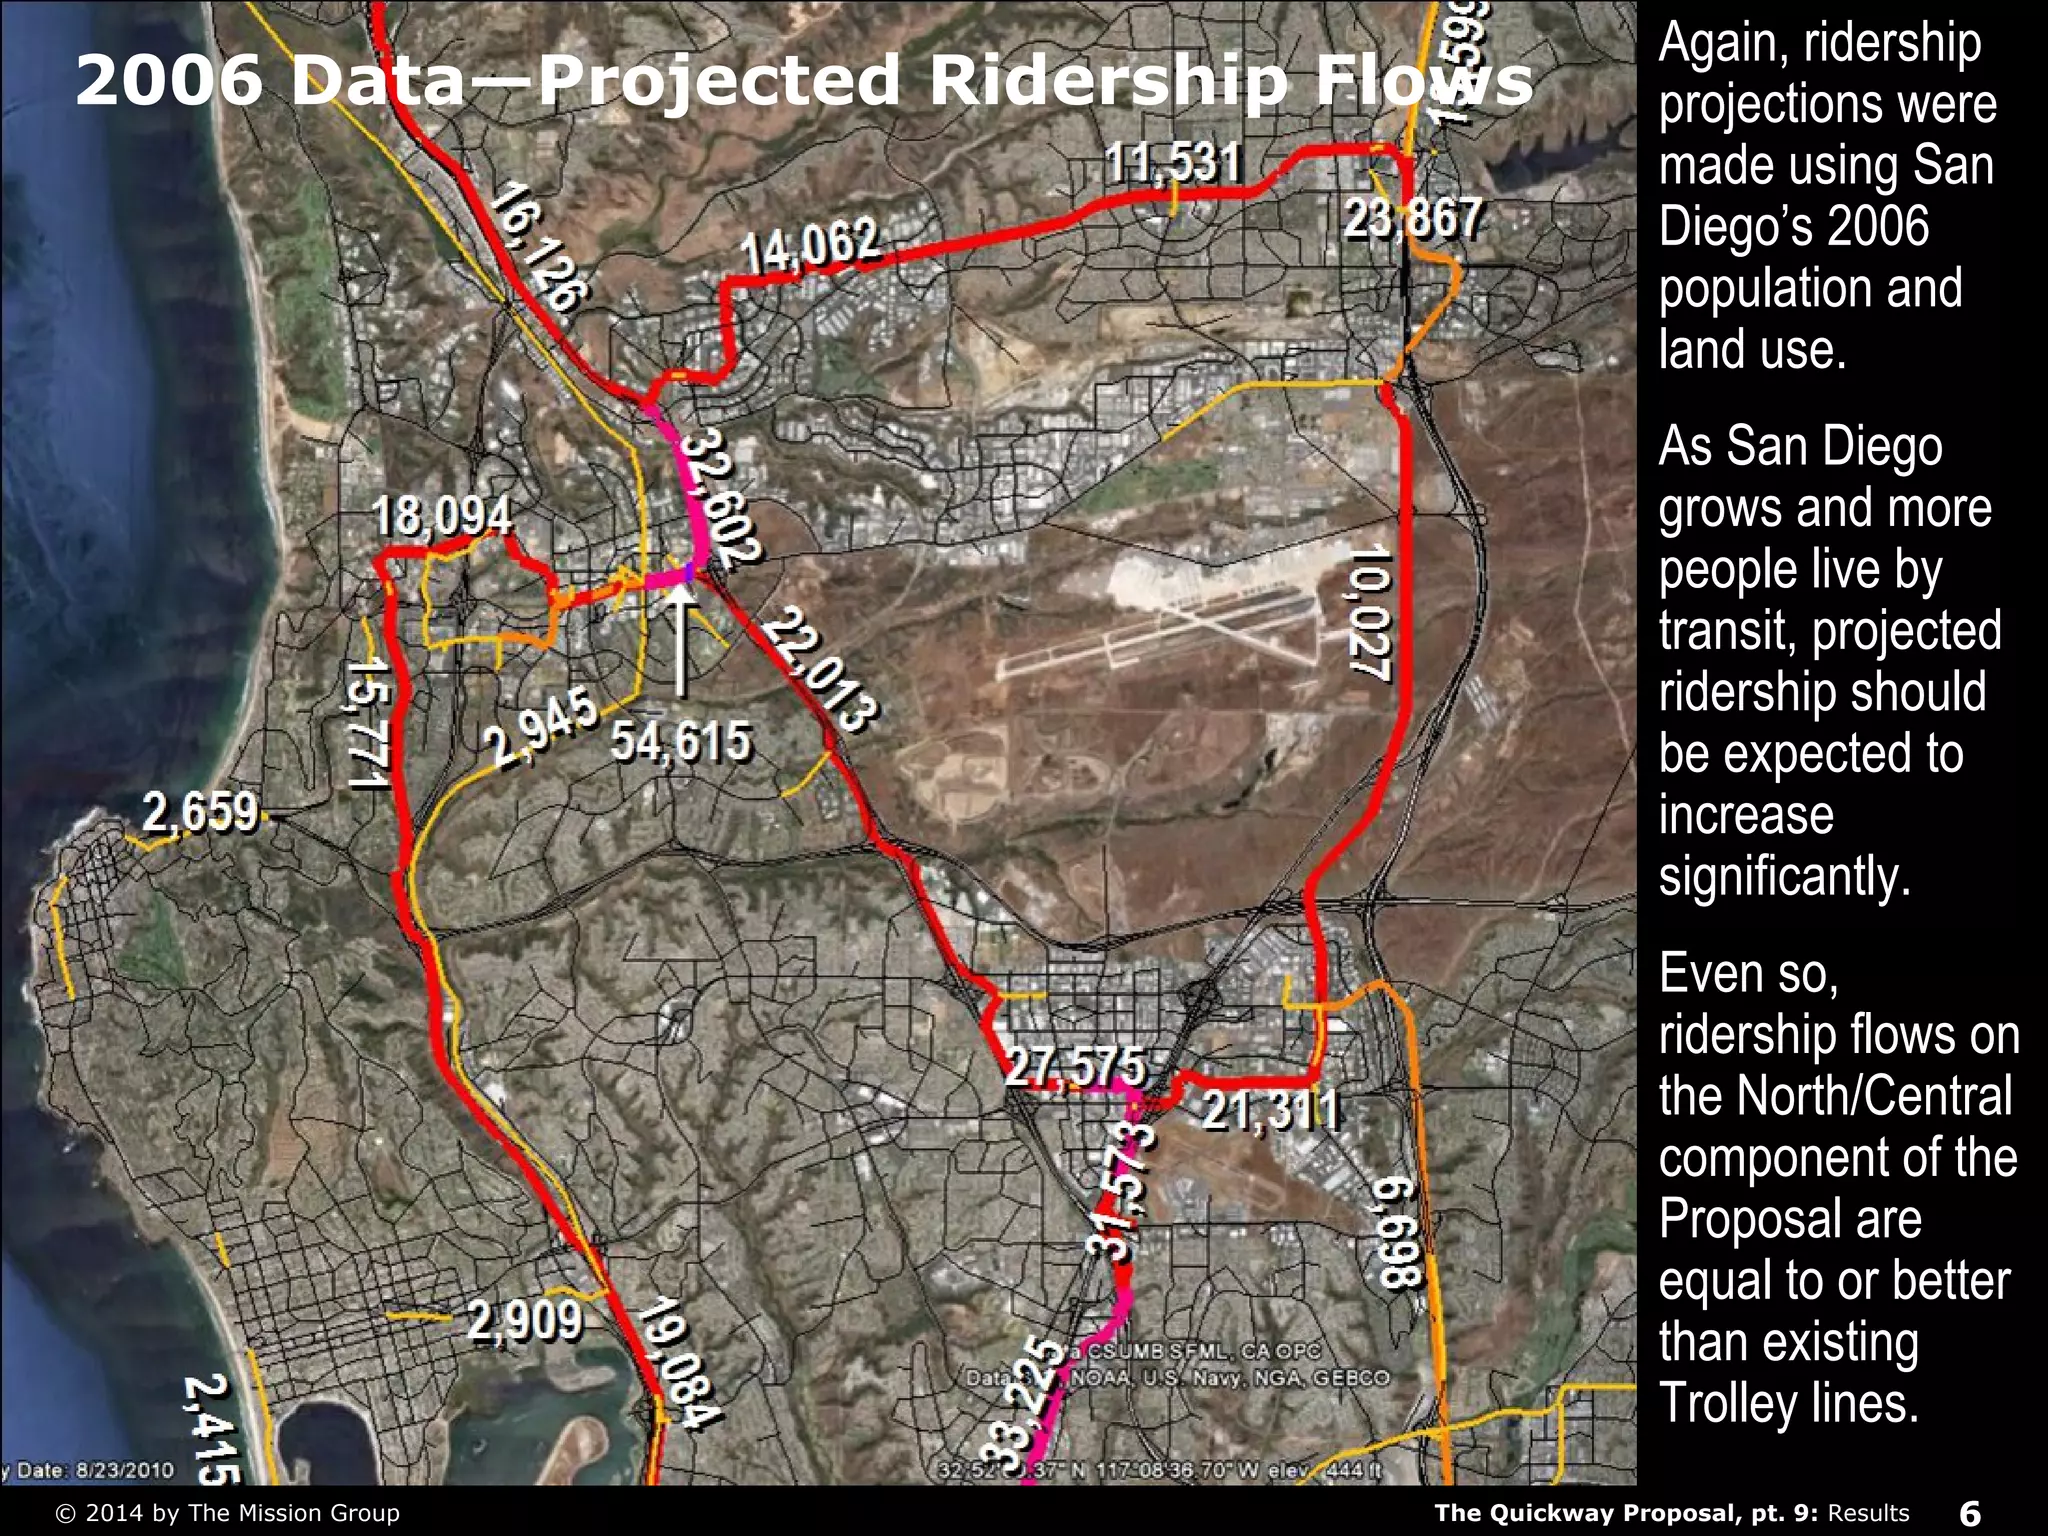
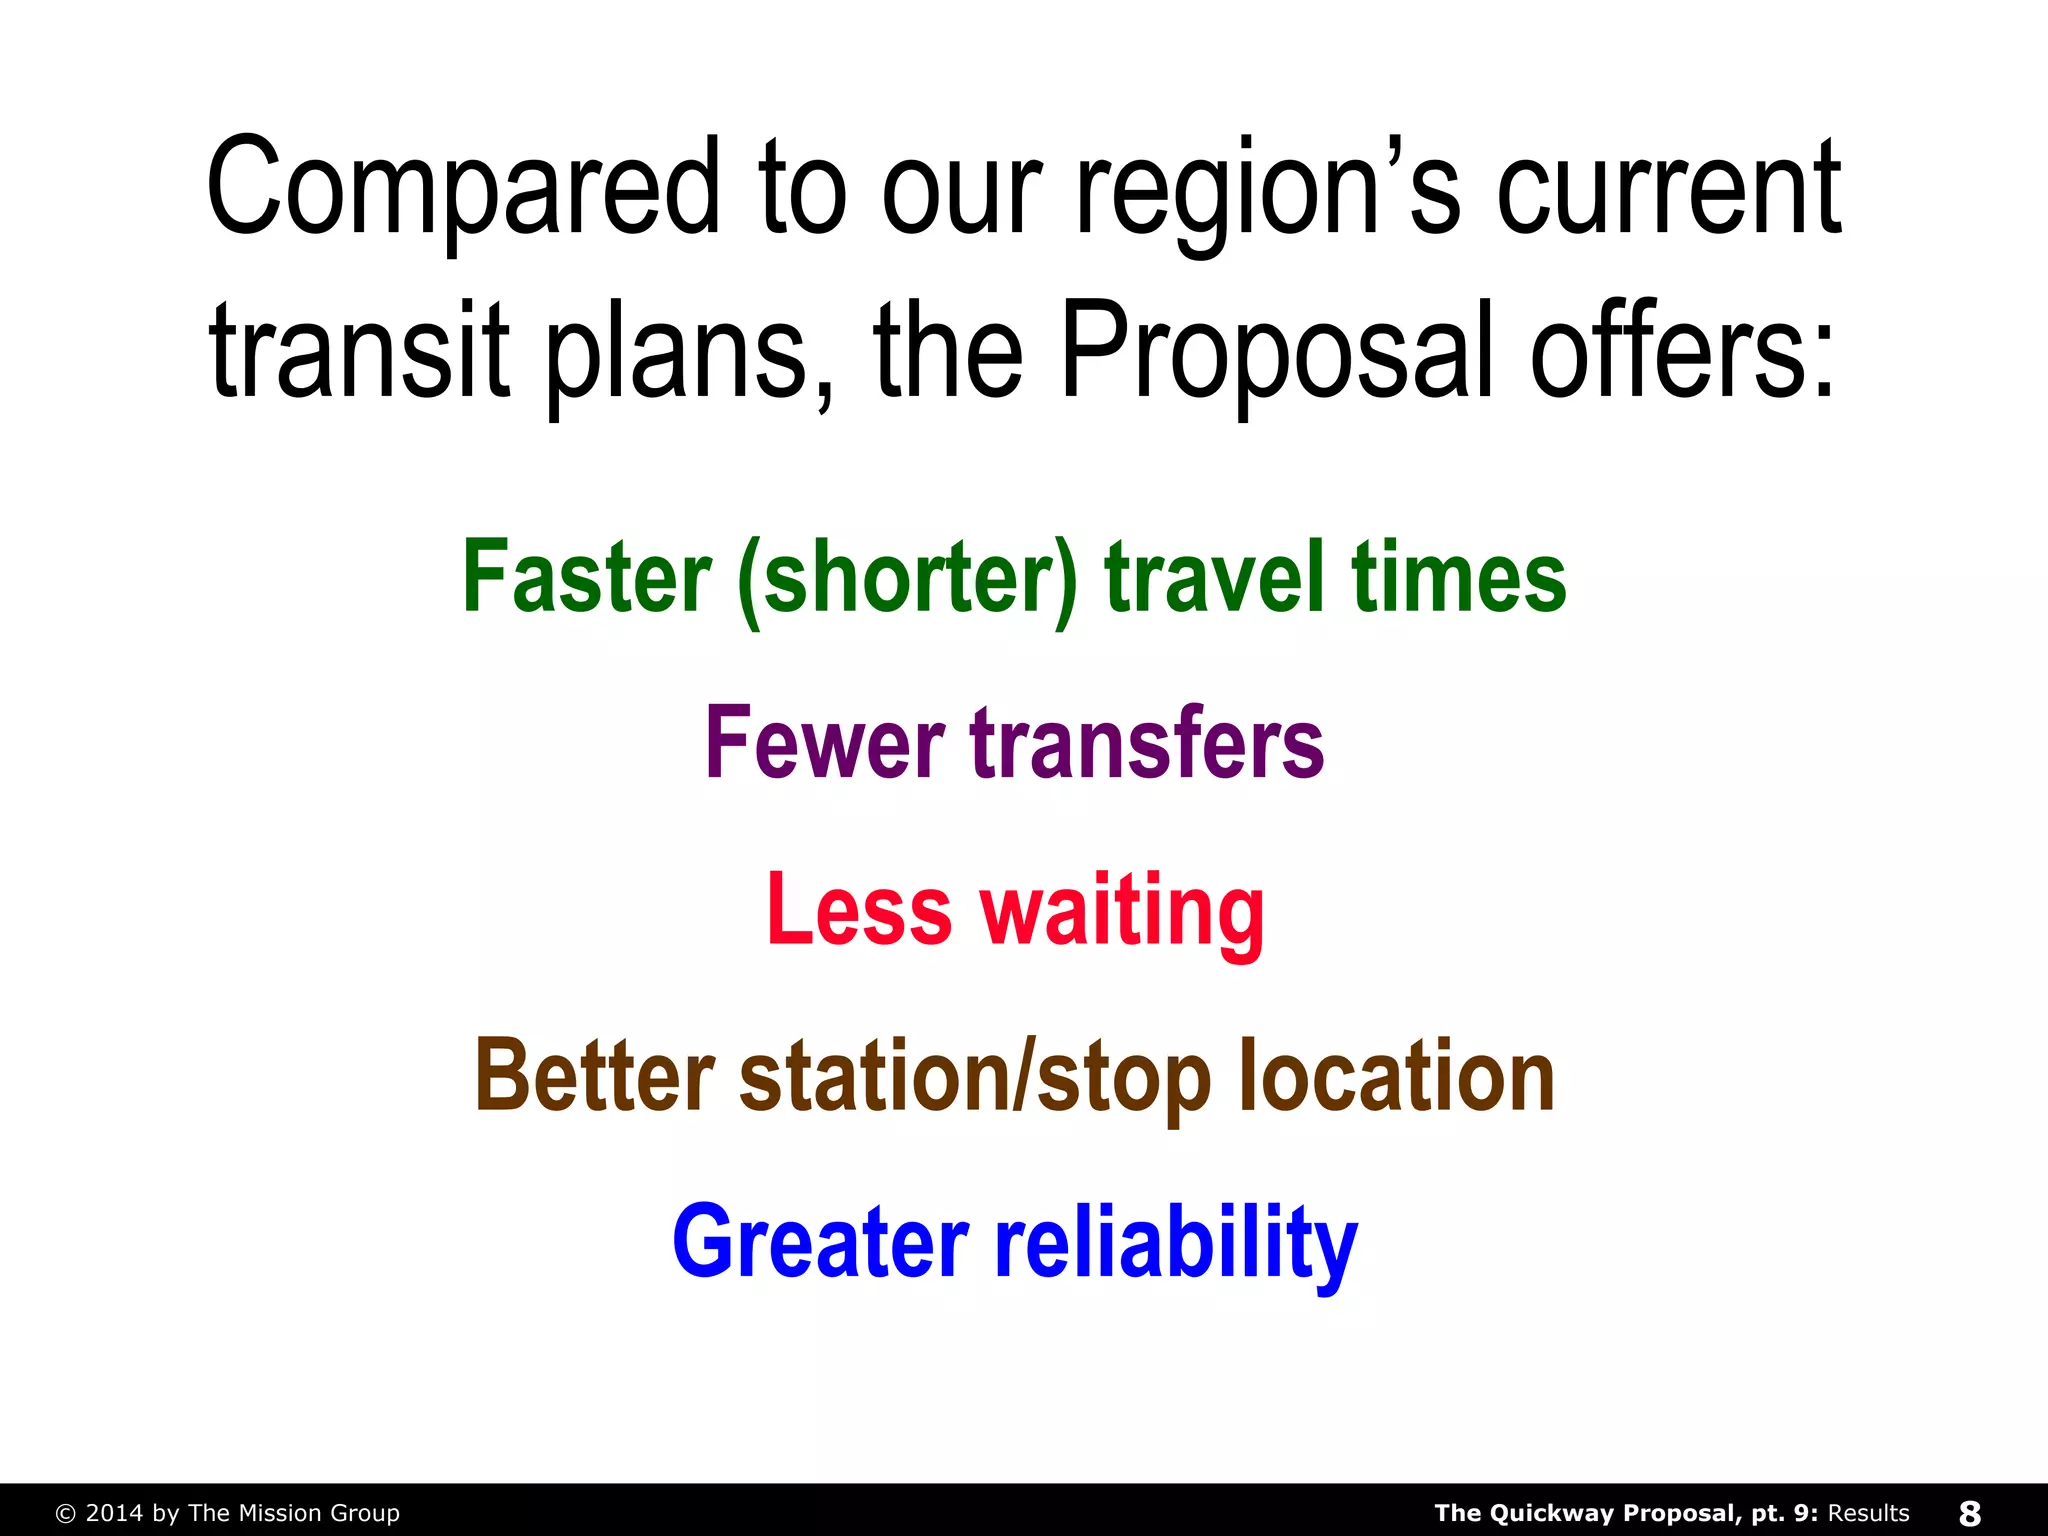
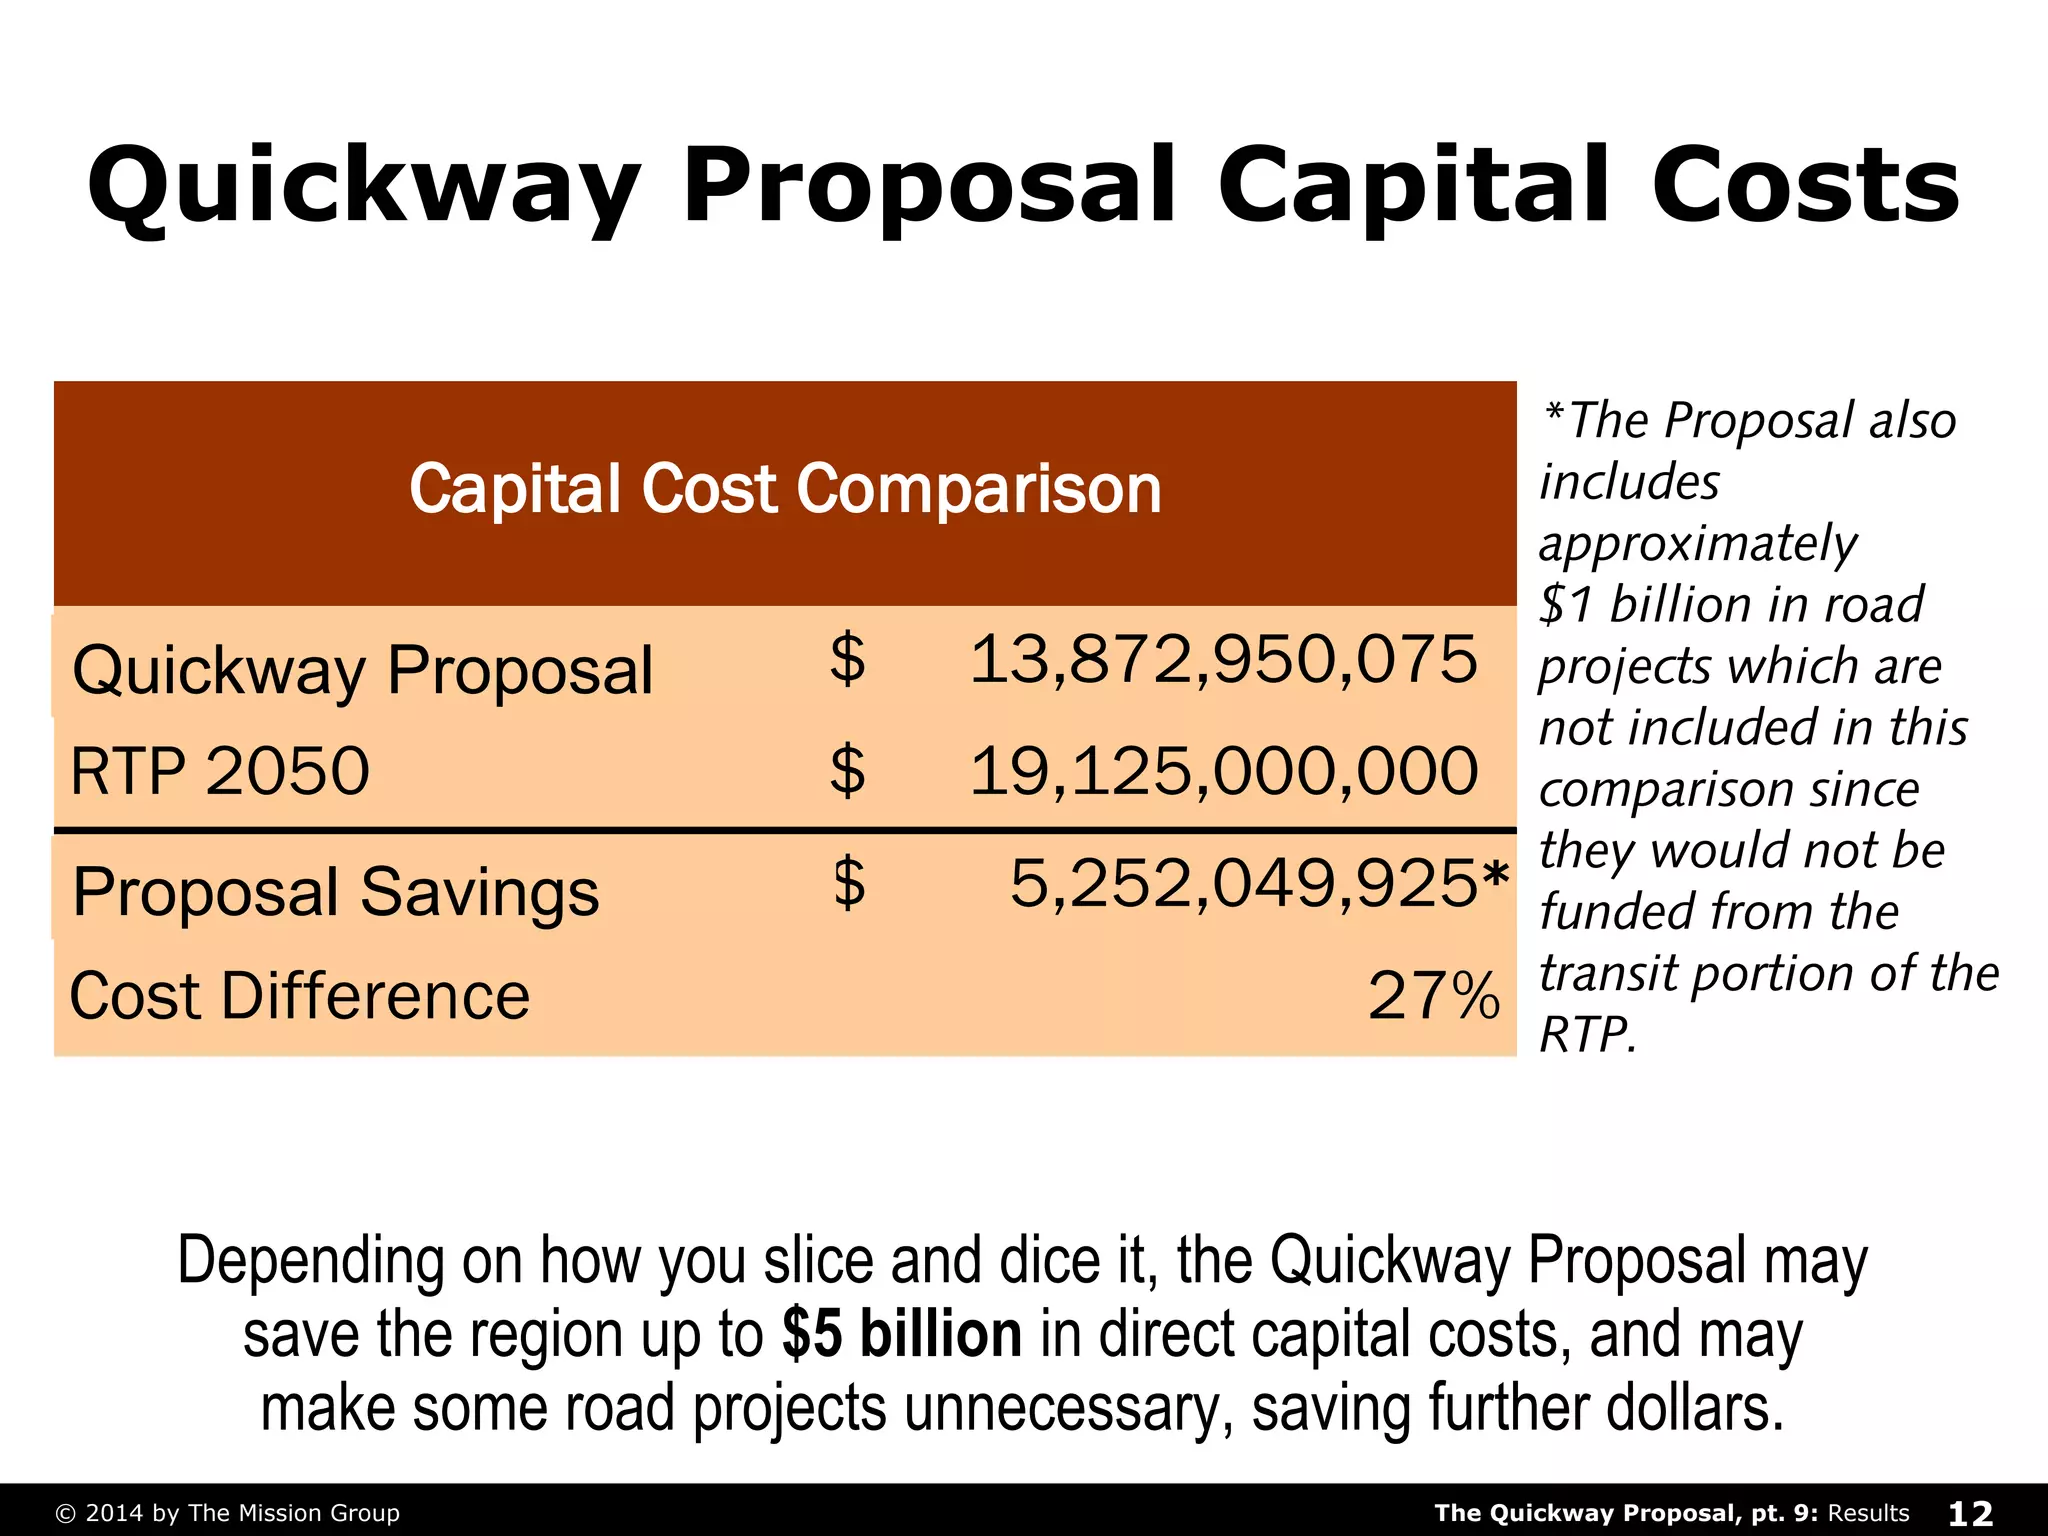
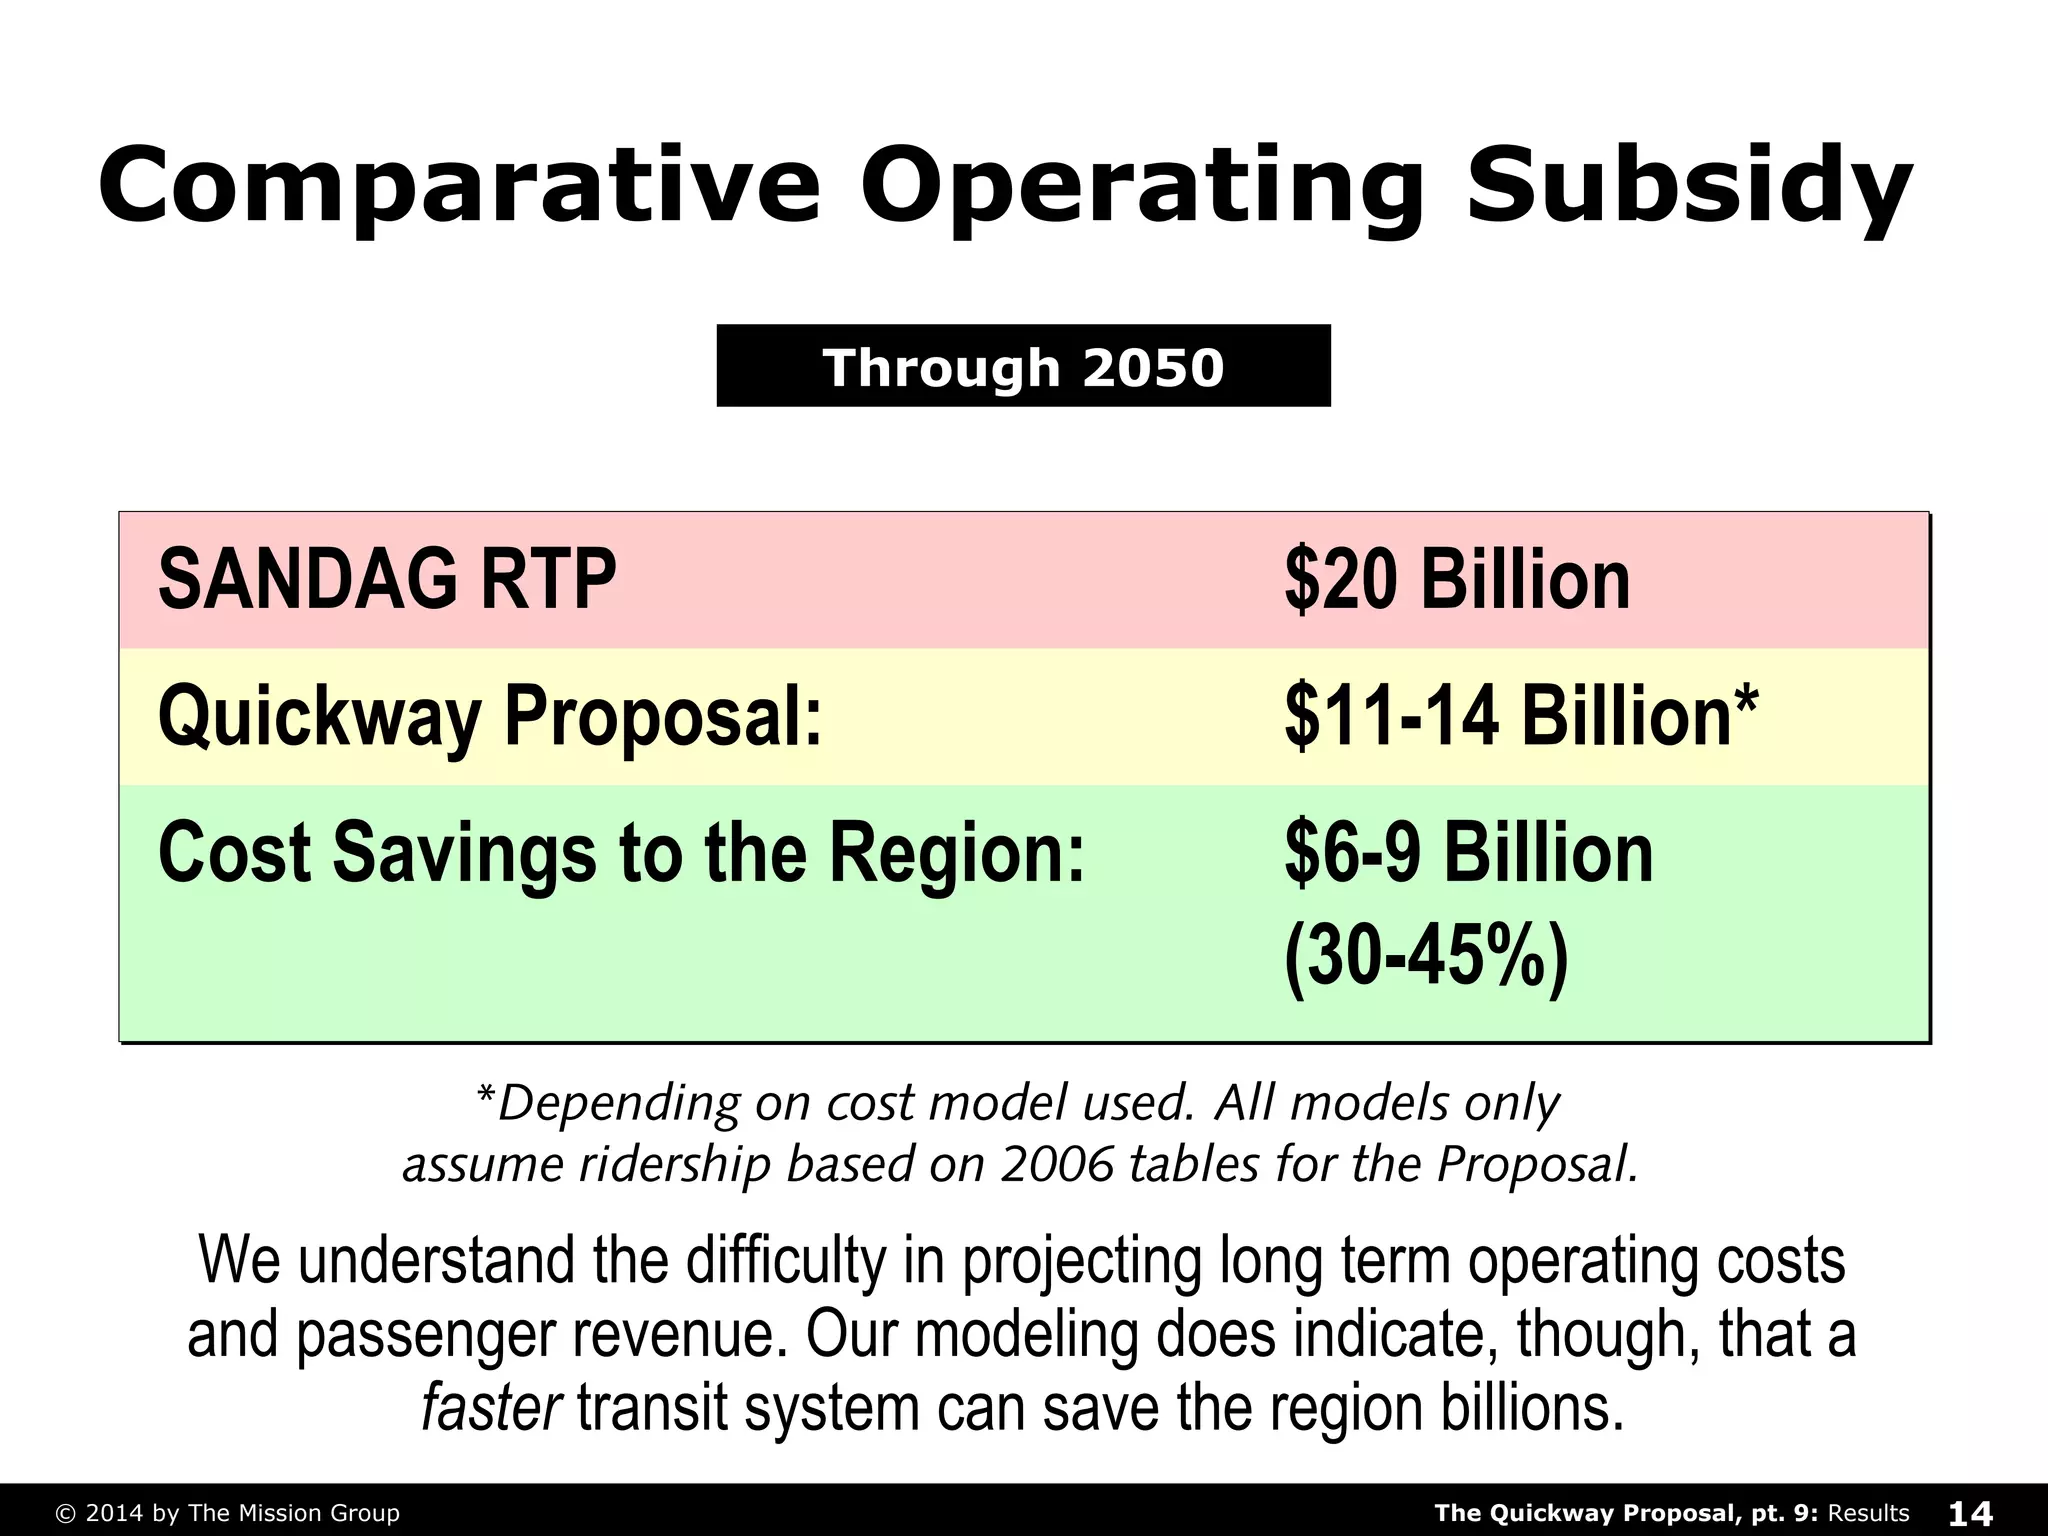
SAN DIEGO CITIZENS’ 
Quickway 
Proposal 
FOR A FAST, FREQUENT, 
CONVENIENT, WORLD-CLASS 
TRANSIT SYSTEM 
PART 9 Results: 
Costs & 
Benefits 
SEPTEMBER 2014 
9 PART 
©2014 BY THE MISSION GROUP, SAN DIEGO, CALIFORNIA. ALL RIGHTS RESERVED. 
The Quickway Proposal, © 2014 by The Mission Group pt. 9: Results 1
How many people would ride 
transit if the Quickway Proposal 
were fairly implemented? 
The Quickway Proposal, © 2014 by The Mission Group pt. 9: Results 2
We can’t be sure, because we 
didn’t have access to projected data 
for 2050, when the County will add 
well over one million people, many 
of whom will live in “transit focus 
areas.” 
However, we did have access 
to data for the year 2006… 
The Quickway Proposal, © 2014 by The Mission Group pt. 9: Results 3
Projected Ridership (2006 Data) 
Service Weekday 
Ridership 
% of Daily 
Trips 
Commuter Rail (Coaster) 4,150 1% 
Light Rail (SD Trolley) 78,000 10% 
Light Rail (Sprinter) 16,600 2% 
BRT (Core Routes) 180,000 23% 
BRT (MetroXpress) 286,000 36% 
Local Bus (MTS & NCTD) 128,000 16% 
Streetcar 98,000 12% 
Total “2006” Projected Ridership 790,000 100% 
2008 Actual Transit Ridership 345,000 
Gain in Ridership 445,000 (130%) . 
Likely 2050 Ridership > 1,000,000 
The Quickway Proposal, © 2014 by The Mission Group pt. 9: Results 4
2006 Data—Projected Ridership Flows 
Many Quickway segments will carry more 
riders—in some places, more than 3x 
more—than the busiest segment of the 
existing Trolley currently move. 
2005 Trolley Flow: 23,000 
The Quickway Proposal, © 2014 by The Mission Group pt. 9: Results 5
2006 Data—Projected Ridership Flows Again, ridership 
projections were 
made using San 
Diego’s 2006 
population and 
land use. 
As San Diego 
grows and more 
people live by 
transit, projected 
ridership should 
be expected to 
increase 
significantly. 
Even so, 
ridership flows on 
the North/Central 
component of the 
Proposal are 
equal to or better 
than existing 
Trolley lines. 
The Quickway Proposal, © 2014 by The Mission Group pt. 9: Results 6
Why would so many new 
people ride transit with 
the Quickway Proposal? 
The Quickway Proposal, © 2014 by The Mission Group pt. 9: Results 7
Compared to our region’s current 
transit plans, the Proposal offers: 
Faster (shorter) travel times 
Fewer transfers 
Less waiting 
Better station/stop location 
Greater reliability 
The Quickway Proposal, © 2014 by The Mission Group pt. 9: Results 8
Just what would 
it cost to build? 
The Quickway Proposal, © 2014 by The Mission Group pt. 9: Results 9
% of Total Plan Guideway Length 
10% 10% 
Total Miles: 171 
19% 21% 22% 
12% 
2% 3% 
40% 
30% 
20% 
10% 
0% 
Bridge Elevated At Grade 
(New) 
At Grade 
(Existing) 
Cut & 
Open 
Cut & 
Cover 
Bored 
Tunnel 
Surface 
Rail 
The Quickway Proposal, © 2014 by The Mission Group pt. 9: Results 10
SANDAG RTP Capital Costs 
Mode Millions 
BRT $ 1 ,028 
Heavy Rail $ 2 ,617 
Light Rail $ 14,416 
Rapid Bus $ 997 
Streetcar $ 67 
Total $ 19,125 
Our region’s 2050 Regional Transportation Plan anticipates spending 
over $19 billion just for public transit capital projects. 
The Quickway Proposal, © 2014 by The Mission Group pt. 9: Results 11
Quickway Proposal Capital Costs 
Capital Cost Comparison 
FAST Plan $ 13,872,950,075 
RTP 2050 $ 19,125,000,000 
FAST Plan Savings $ 5 ,252,049,925 
Cost Difference 27% 
* 
*The Proposal also 
includes 
approximately 
$1 billion in road 
projects which are 
not included in this 
comparison since 
they would not be 
funded from the 
transit portion of the 
RTP. 
Quickway Proposal 
Proposal Savings 
Depending on how you slice and dice it, the Quickway Proposal may 
save the region up to $5 billion in direct capital costs, and may 
make some road projects unnecessary, saving further dollars. 
The Quickway Proposal, © 2014 by The Mission Group pt. 9: Results 12
But could we afford to operate all 
those new services? 
The Quickway Proposal, © 2014 by The Mission Group pt. 9: Results 13
Comparative Operating Subsidy 
Through 2050 
SANDAG RTP $20 Billion 
Quickway Proposal: $11-14 Billion* 
Cost Savings to the Region: $6-9 Billion 
(30-45%) 
*Depending on cost model used. All models only 
assume ridership based on 2006 tables for the Proposal. 
We understand the difficulty in projecting long term operating costs 
and passenger revenue. Our modeling does indicate, though, that a 
faster transit system can save the region billions. 
The Quickway Proposal, © 2014 by The Mission Group pt. 9: Results 14
CONCLUSION: 
The Quickway Proposal, as a strategic approach 
to creating a better-integrated transit network, can: 
Reach into more places 
Save people more travel time 
Better support “smart growth” areas 
Attract many more riders 
Better improve automotive traffic and 
Cost significantly less to build and operate 
than our current transit plans. 
The Quickway Proposal, © 2014 by The Mission Group pt. 9: Results 15

pt 9: The Quickway Proposal: Results

  • 1.
    SAN DIEGO CITIZENS’ Quickway Proposal FOR A FAST, FREQUENT, CONVENIENT, WORLD-CLASS TRANSIT SYSTEM PART 9 Results: Costs & Benefits SEPTEMBER 2014 9 PART ©2014 BY THE MISSION GROUP, SAN DIEGO, CALIFORNIA. ALL RIGHTS RESERVED. The Quickway Proposal, © 2014 by The Mission Group pt. 9: Results 1
  • 2.
    How many peoplewould ride transit if the Quickway Proposal were fairly implemented? The Quickway Proposal, © 2014 by The Mission Group pt. 9: Results 2
  • 3.
    We can’t besure, because we didn’t have access to projected data for 2050, when the County will add well over one million people, many of whom will live in “transit focus areas.” However, we did have access to data for the year 2006… The Quickway Proposal, © 2014 by The Mission Group pt. 9: Results 3
  • 4.
    Projected Ridership (2006Data) Service Weekday Ridership % of Daily Trips Commuter Rail (Coaster) 4,150 1% Light Rail (SD Trolley) 78,000 10% Light Rail (Sprinter) 16,600 2% BRT (Core Routes) 180,000 23% BRT (MetroXpress) 286,000 36% Local Bus (MTS & NCTD) 128,000 16% Streetcar 98,000 12% Total “2006” Projected Ridership 790,000 100% 2008 Actual Transit Ridership 345,000 Gain in Ridership 445,000 (130%) . Likely 2050 Ridership > 1,000,000 The Quickway Proposal, © 2014 by The Mission Group pt. 9: Results 4
  • 5.
    2006 Data—Projected RidershipFlows Many Quickway segments will carry more riders—in some places, more than 3x more—than the busiest segment of the existing Trolley currently move. 2005 Trolley Flow: 23,000 The Quickway Proposal, © 2014 by The Mission Group pt. 9: Results 5
  • 6.
    2006 Data—Projected RidershipFlows Again, ridership projections were made using San Diego’s 2006 population and land use. As San Diego grows and more people live by transit, projected ridership should be expected to increase significantly. Even so, ridership flows on the North/Central component of the Proposal are equal to or better than existing Trolley lines. The Quickway Proposal, © 2014 by The Mission Group pt. 9: Results 6
  • 7.
    Why would somany new people ride transit with the Quickway Proposal? The Quickway Proposal, © 2014 by The Mission Group pt. 9: Results 7
  • 8.
    Compared to ourregion’s current transit plans, the Proposal offers: Faster (shorter) travel times Fewer transfers Less waiting Better station/stop location Greater reliability The Quickway Proposal, © 2014 by The Mission Group pt. 9: Results 8
  • 9.
    Just what would it cost to build? The Quickway Proposal, © 2014 by The Mission Group pt. 9: Results 9
  • 10.
    % of TotalPlan Guideway Length 10% 10% Total Miles: 171 19% 21% 22% 12% 2% 3% 40% 30% 20% 10% 0% Bridge Elevated At Grade (New) At Grade (Existing) Cut & Open Cut & Cover Bored Tunnel Surface Rail The Quickway Proposal, © 2014 by The Mission Group pt. 9: Results 10
  • 11.
    SANDAG RTP CapitalCosts Mode Millions BRT $ 1 ,028 Heavy Rail $ 2 ,617 Light Rail $ 14,416 Rapid Bus $ 997 Streetcar $ 67 Total $ 19,125 Our region’s 2050 Regional Transportation Plan anticipates spending over $19 billion just for public transit capital projects. The Quickway Proposal, © 2014 by The Mission Group pt. 9: Results 11
  • 12.
    Quickway Proposal CapitalCosts Capital Cost Comparison FAST Plan $ 13,872,950,075 RTP 2050 $ 19,125,000,000 FAST Plan Savings $ 5 ,252,049,925 Cost Difference 27% * *The Proposal also includes approximately $1 billion in road projects which are not included in this comparison since they would not be funded from the transit portion of the RTP. Quickway Proposal Proposal Savings Depending on how you slice and dice it, the Quickway Proposal may save the region up to $5 billion in direct capital costs, and may make some road projects unnecessary, saving further dollars. The Quickway Proposal, © 2014 by The Mission Group pt. 9: Results 12
  • 13.
    But could weafford to operate all those new services? The Quickway Proposal, © 2014 by The Mission Group pt. 9: Results 13
  • 14.
    Comparative Operating Subsidy Through 2050 SANDAG RTP $20 Billion Quickway Proposal: $11-14 Billion* Cost Savings to the Region: $6-9 Billion (30-45%) *Depending on cost model used. All models only assume ridership based on 2006 tables for the Proposal. We understand the difficulty in projecting long term operating costs and passenger revenue. Our modeling does indicate, though, that a faster transit system can save the region billions. The Quickway Proposal, © 2014 by The Mission Group pt. 9: Results 14
  • 15.
    CONCLUSION: The QuickwayProposal, as a strategic approach to creating a better-integrated transit network, can: Reach into more places Save people more travel time Better support “smart growth” areas Attract many more riders Better improve automotive traffic and Cost significantly less to build and operate than our current transit plans. The Quickway Proposal, © 2014 by The Mission Group pt. 9: Results 15