Download to read offline
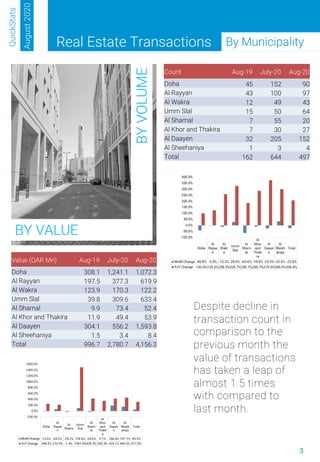
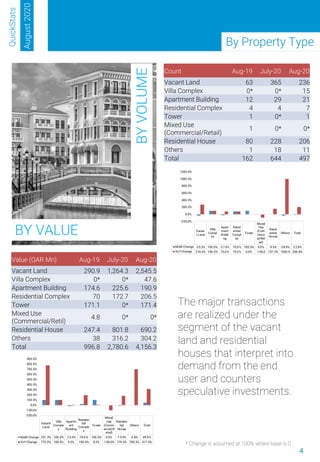

This document provides a summary of Qatar's real estate market for August 2020. Transaction volumes declined 22.8% month-over-month but increased 206.8% year-over-year. While transaction counts fell, overall transaction values increased 49.5% month-over-month and 317% year-over-year, driven primarily by vacant land and residential properties. The hotel sector continues to struggle with occupancy rates down compared to last year. Rental rates for residential and commercial properties have remained stable with incentives offered to tenants.


