Downloaded 131 times

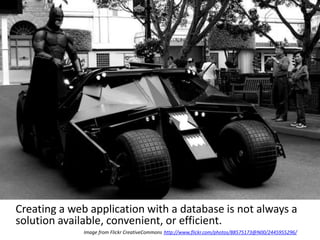
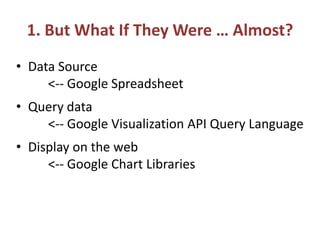

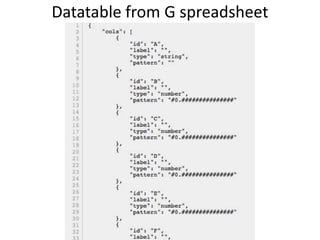
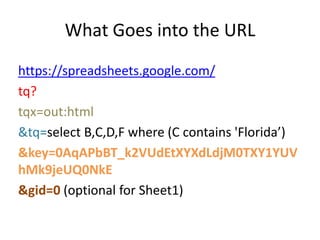

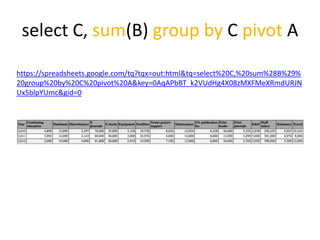
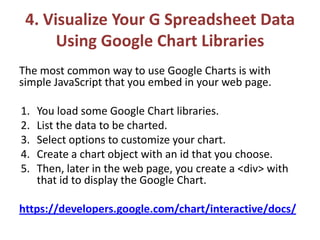
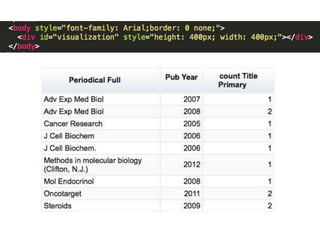
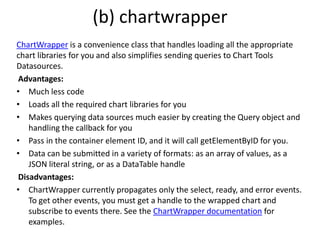
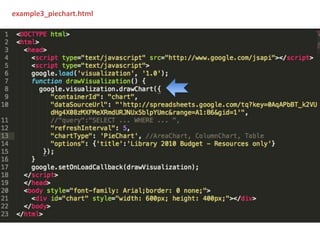
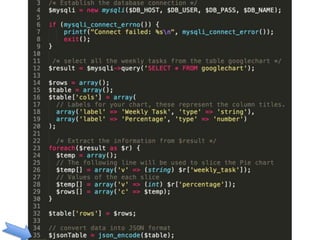
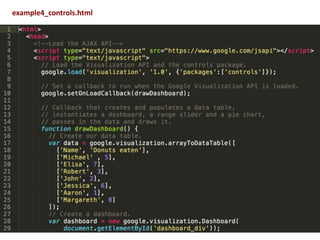
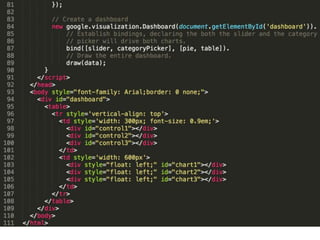
![Construct G DataTable from MySQL db
{
"cols":[{"label":"Weekly
Task","type":"string"},{"label":"Percentage","type":"
number"}],
"rows":[{"c":[{"v":"Sleep"},{"v":30}]},{"c":[{"v":"Watc
hing
Movie"},{"v":10}]},{"c":[{"v":"Job"},{"v":40}]},{"c":[{"
v":"Exercise"},{"v":20}]}]
}](https://image.slidesharecdn.com/c4l14googleviz-140322185332-phpapp01/85/Quick-Easy-Data-Visualization-with-Google-Visualization-API-Google-Chart-Libraries-46-320.jpg)
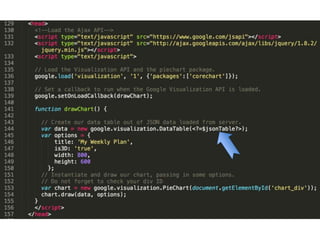
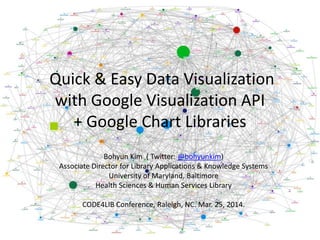
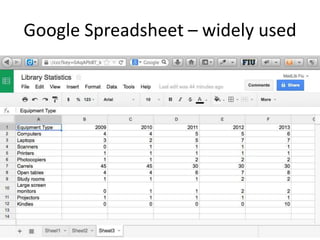
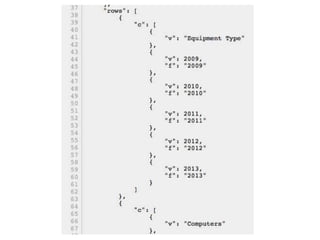
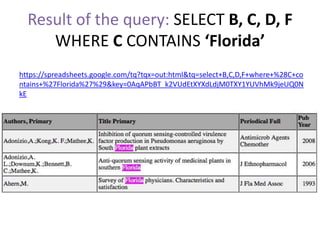
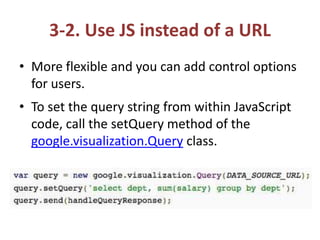
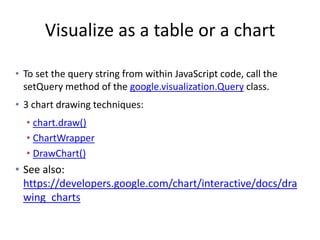
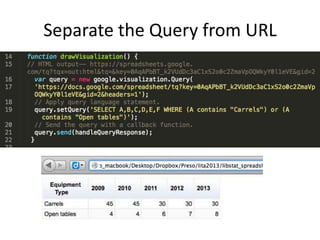
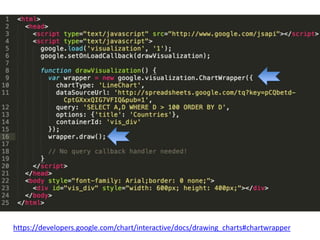
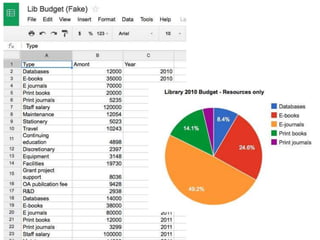
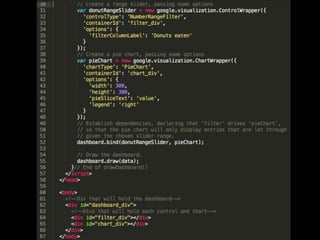
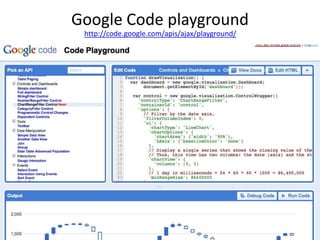
![Draw a Dashboard
1. Create An HTML Skeleton For Your Dashboard
2. Load Your Libraries
3. Prepare Your Data
4. Create a Dashboard Instance
5. Create Control and Chart Instances
6. Establish Dependencies (=bind)
7. Draw Your Dashboard
8. Programmatic Changes after Draw
google.load('visualization', '1.0',{'packages':['controls']});
….
dashboard.bind(donutRangeSlider, pieChart);
dashboard.draw(data);
https://developers.google.com/chart/interactive/docs/gallery/controls](https://image.slidesharecdn.com/c4l14googleviz-140322185332-phpapp01/85/Quick-Easy-Data-Visualization-with-Google-Visualization-API-Google-Chart-Libraries-51-320.jpg)
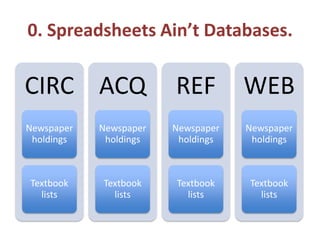
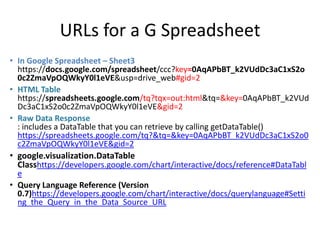
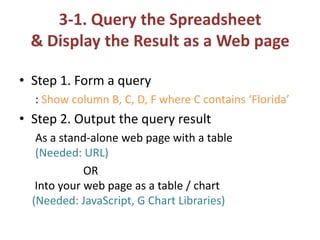
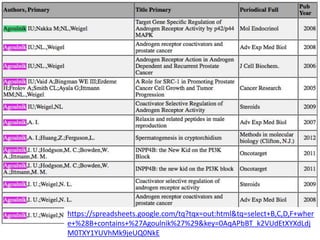
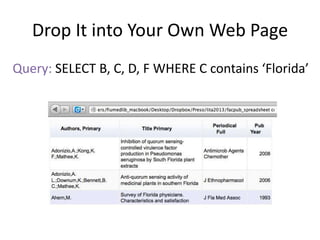
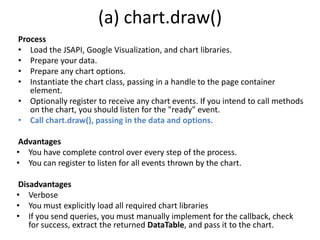
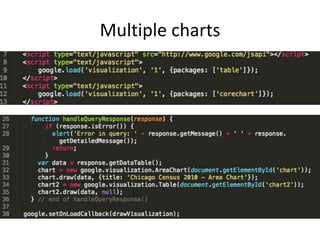
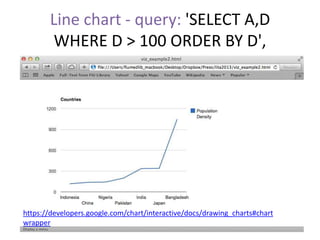
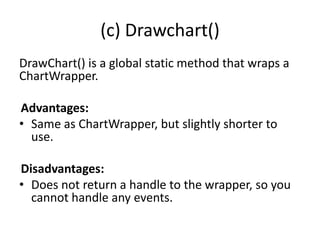
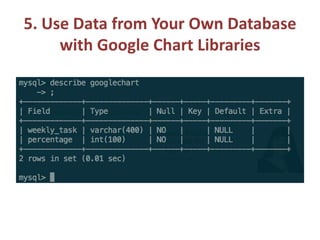
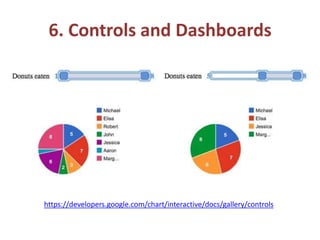
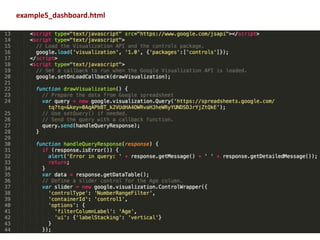
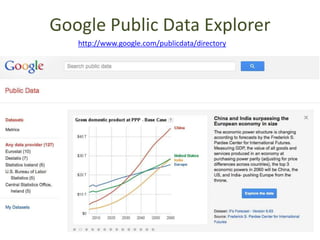
![Dashboard with multiple controls
and a remote data source
new google.visualization.Dashboard(document.getElementById('dashboard'))
.bind([slider, categoryPicker], [pie, table]).draw(data);](https://image.slidesharecdn.com/c4l14googleviz-140322185332-phpapp01/85/Quick-Easy-Data-Visualization-with-Google-Visualization-API-Google-Chart-Libraries-54-320.jpg)

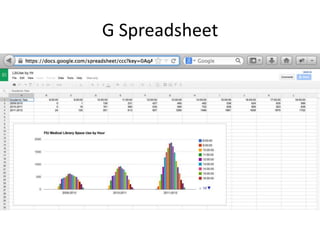
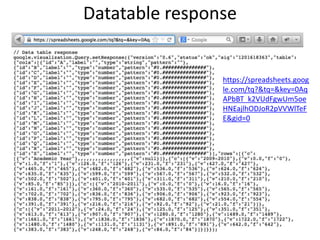
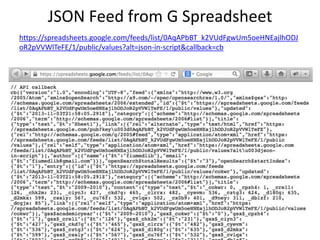
The document provides a comprehensive guide on using the Google Visualization API and Google Chart Libraries for data visualization, specifically leveraging Google Spreadsheets as a data source. It outlines the process of querying data, displaying results on the web, and visualizing them through various chart options. The guide also details utilizing JavaScript for greater flexibility, constructing dashboards, and integrating data from custom databases.