Question 1
Using Powerpoint, Word, Visio or any other graphical editor that allows you to create shapes and arrows, create a simple flow chart that provides the functionality for this pseudocode:
Write “Enter the price in dollars: “
Input Price
Write “Enter state sales tax(e.g. .06) : “
Input SalesTax
Set Price = Price + (Price * SalesTax)
Write “Price with Tax is “ + Price
Also, Provide a test case that you could use to validate your algorithm. (For example, what values for input would you use and what would the resulting output be for those input values)
Attach or embed your flow chart along with your test case as a response to this discussion topic.
Question 2
n everyday life we are all faced with many choices we must make on a daily basis.
1. Provide an Algorithm for your real world decision you must make on a daily basis that involves 2 or more choices
2. Provide your C code that implements your real world decision (be sure to utilize proper formatting and spacing to enhance your codes clarity, and applicable comments)
3. Explain your logic for the conditional statement you decided to use
4. Provide feedback to fellow student’s submission that involves converting their conditional statement to another conditional statement form
Work- homework
Homework 2
Instructions
In this homework, you will design a program to perform the following task:
Calculate the total price based on several key parts required to build a state-of-the-art gaming computer. The user will have the option of selecting different parts. For example, Windows 7, Windows 8 or Mac OS/X for Operating systems, 4 GB, 8 GB or 12 GB for RAM and 15”,17” or 22” Monitors.
There are 5 components of your submission including:
· Program Description- A detailed, clear description of the program you are building.
· Analysis- Demonstrates your thought process and steps used to analyze the problem. Be sure to include the required input and output and how you will obtain the required output from the given input? Also, include your variable names and definitions. Be sure to describe the necessary formulas and sample calculations that might be needed. You should talk about how you determined your computer part prices.
· Test plan - Prepare at least 3 sets of input data (Test data) along with their expected output for testing your program. Your test data can be presented in the form of a table as follows (note: feel free to adapt to your design)
· Flowchart – Provide a flowchart for your design. You can use Word, Powerpoint, Visio or any software you have available that will allow to draw shapes and connectors.
· Pseudocode- Provide pseudocode of your overall design that fulfills the requirements of the project
All of these components should be placed in word document for submission.
Additional details about the program you need to write:
1. You should research current prices of the computer parts on Internet sites such as amazon.com or newegg.com.
2. You can assume a computer will consi ...
Introduction to Problem Solving and Algorithm Design
Using the above Code of Ethics, Pick at least 2 of the 8 principles and describe what these principles mean to you. In your write-up, summarize the principles you selected in your own words and provide at least one example of an activity or action you could take that would support each principle and one example of an activity or action that you believe would violate each principle. Be sure your document is well-written with minimal grammatical and spelling issues.
Cmis 102 Enthusiastic Study / snaptutorial.comStephenson22
Introduction to Problem Solving and Algorithm Design
Using the above Code of Ethics, Pick at least 2 of the 8 principles and describe what these principles mean to you. In your write-up, summarize the principles you selected in your own words and provide at least one example of an activity or action you could take that would support each principle and one example of an activity or action that you believe would violate each principle. Be sure your document is well-written with minimal grammatical and spelling issues.
Cmis 102 Effective Communication / snaptutorial.comHarrisGeorg12
CMIS 102 Homework 1 Solution
Introduction to Problem Solving and Algorithm Design
Using the above Code of Ethics, Pick at least 2 of the 8 principles and describe what these principles mean to you. In your write-up, summarize the principles you selected in your own words and provide at least one example of an activity or action you could take that would support each principle and one example of an activity or action that you believe would violate each principle. Be sure your document is well-written with minimal grammatical and spelling issues.
Case Study Analysis 2The Cholesterol.xls records cholesterol lev.docxwendolynhalbert
Case Study Analysis 2
The Cholesterol.xls records cholesterol level data for individuals. Descriptions for the data follow:
· Cholesterol: Cholesterol level (mg/dL)
· Income: annual income in $
· Age: age of individual
· Jogging: number of hours an individual spends on jogging a day
· Saturated fat: the amount of saturated fat an individual takes a day (g)
(A) Develop an estimated regression equation that can be used to predict Cholesterol level using age, jogging income, and saturated fat. Discuss your findings including interpretation of slope of each variable and significance, using at least 200 words. Use .
(B) Starting with the estimated regression equation developed in part (A), delete any independent variables that are not statistically significant and develop a new estimated regression equation that can be used to predict Cholesterol level. Use . Discuss your findings including interpretation of slope of each variable and significance, using at least 200 words. Use .
(C) Compare model (A) and (B) in terms of R^2 and which model fits the data better? Discuss this using at least 100 words
(D) In model B, what are the most important factors affecting Cholesterol level? What are the least important factors? Discuss this using at least 100 words
Assignment1DueTHURSDAY.zip
Assignment1/Assignment1-17.pdf
ICT209 Assignment 1, Murdoch University 2016
ICT209 Assignment 1, Murdoch University 2016 1
ICT209 Assignment 1 2016
Objectives:
• Demonstrate that you can do Object Oriented design
• Demonstrate that you can write Object Oriented programs using C++.
• Demonstrate that you can design and write programs using user defined data structures.
• Demonstrate that you can work with data files.
• Demonstrate that you can write test plans and show evidence of systematic testing.
• Demonstrate that you can design using UML.
You do not work in groups for this assignment, as this is an individual assignment.
Worth:
14% of the unit
Due:
Midnight (end of Session 7). This would be the 7th teaching week.
How to submit (also see unit guide - section on Assignment/Project submission/return):
Singapore or Dubai Campus:
Into the assignment submission area for the unit in LMS. Follow all directions from your lecturer.
Murdoch Campus Internal students:
Into the assignment submission area for the unit in LMS.
Externals:
Into the assignment submission area for the unit in LMS.
For submitting in LMS, zip up the entire folder. Make sure that you have included all needed files. Do not
include temporary files or files not relevant to the assignment.
Name the zip file with the unit code, Assignment number, your name, student number.
ICT209Asg1JoBlogs12345678.zip
or alternatively,
ICT209_Asg1_JoBlogs_12345678.zip
Textual submissions should be type-written. External documentation can only be in the following formats:
Text (.txt)
PDF (.pdf)
RTF (.rtf)
HTML (.html)
Image formats : PNG ...
CIS 336 STUDY Introduction Education--cis336study.comclaric262
FOR MORE CLASSES VISIT
www.cis336study.com
Question 1. 1. (TCO 1) A DBMS performs several important functions that guarantee the integrity and consistency of the data in the database. Which of the following is NOT one of those functions?
Question 2. 2. (TCO 1) A relational DBMS provides protection of the _____ through security, control, and recovery facilities.
Question 3. 3. (TCO 2) A relationship is an association between _____
PROJECT STORYBOARD: Reducing Software Bug Fix Lead Time From 25 to 15 daysGoLeanSixSigma.com
GoLeanSixSigma.com Green Belt Eduardo Torres did a great job of cutting waste out of the process of fixing software bugs. The use of software is growing fast, and with no known way to guarantee new software is error-free, rapidly fixing bugs found is critical. Eduardo not only cut nearly 40% of the process time, but also cut the variability in half, greatly improving reliability!
– Susan Tighe, GoLeanSixSigma.com Master Black Belt
Coach
---
Eduardo Torres is a Senior Project Manager and Lean Six Sigma Green Belt with expertise in the Telecommunications Field. For his Green Belt Project, he decided to tackle the long lead time for software bug fixes – reducing the total lead time from 25 to 15 days!
Applied Business Project 2 – Data VisualizationYou MUST use th.docxjesuslightbody
Applied Business Project 2 – Data Visualization
You MUST use this template for your report
and submit your ABP-2 report to D2L as a PDF file.
Name: Lastname, Firstname (UA Email address)
Project: ABP-2 – Data Visualization
Task 1: ETL of Transactional Data
1.1.
Extract of Extracted Data (from Yahoo! Finance)
<insert the Header plus
only the first 10 rows of your downloaded CSV datafile here>
Important Note: Be sure your solution for Task 1.1 copies the data directly from your text editor (as lines of “text” and not as an image) so that your solution matches the unformatted data in the CSV file shown in the assignment guidelines. You must use a text editor for this task. You
cannot open your CSV file using Word, Pages, Excel, Sheets or other similar applications.
1.2.
Stock Price Summary Table (Based on Full Data Set)
<insert your solution for Task 1.2 table here>
1.3.
Stock Price Summary Table Formulas
1.3.1.
Excel Formula for the Daily Open Low
<insert your Excel formula for Task 1.3.1 here>
1.3.2.
Excel Formula for the Daily Open High
<insert your Excel formula
for Task 1.3.2 here>
1.3.3.
Excel Formula for the Daily Open Range
<insert your Excel formula
for Task 1.3.3 here>
1.4.
Data Visualizations (Stock Trading Prices)
<insert your visualization solution for Task 1.4 graph>
1.5 Data Visualizations (Trading Volume)
<insert your solution for Task 1.5 graph>
1.6 Assessment of how Visualizations can inform an investor (150 words)
<insert your written Assessment for Task 1.6 here> Task 2: Comparative Market and Financial Strength
2.
2.1. Tabular Data Representation
<insert your solution for Task 2.1>
2.2. Treemap Charts of financial data – your company
<insert your treemap chart for Task 2.2> - your company
2.3. Treemap Charts of financial data – a competitor
<insert your treemap chart for Task 2.3> - a competitor
2.4. Treemap Charts of financial data – a company ourside your industry
<insert your treemap chart for Task 2.4> - an unrelated company
2.5 Value of a Treemap Chart in Investment Analysis (150 words)
<insert your solution for Task 2.5 here>Task 3: Profiling Corporate Sustainability
3.
3.1.
Tabular Data for Sustainability Visualization
<insert your solution for Task 3.1 here>
3.2.
Sustainability Visualization (Radar Chart)
<insert your solution for Task 3.2>
3.3.
Sustainability Assessment (150 words)
<insert your solution for Task 3.3> Task 4: Assessing your stock the Warren Buffet Way
4.
4.1. Selection of Criteria and Visualization Chart Type4.1.1.
Criterion identifier and description
<insert your solution for Task 4.1.1>
4.1.2.
Selected chart type
<insert your solution for Task 4.1.2>
4.2. Visualization Assessment (15.
Introduction to Problem Solving and Algorithm Design
Using the above Code of Ethics, Pick at least 2 of the 8 principles and describe what these principles mean to you. In your write-up, summarize the principles you selected in your own words and provide at least one example of an activity or action you could take that would support each principle and one example of an activity or action that you believe would violate each principle. Be sure your document is well-written with minimal grammatical and spelling issues.
Cmis 102 Enthusiastic Study / snaptutorial.comStephenson22
Introduction to Problem Solving and Algorithm Design
Using the above Code of Ethics, Pick at least 2 of the 8 principles and describe what these principles mean to you. In your write-up, summarize the principles you selected in your own words and provide at least one example of an activity or action you could take that would support each principle and one example of an activity or action that you believe would violate each principle. Be sure your document is well-written with minimal grammatical and spelling issues.
Cmis 102 Effective Communication / snaptutorial.comHarrisGeorg12
CMIS 102 Homework 1 Solution
Introduction to Problem Solving and Algorithm Design
Using the above Code of Ethics, Pick at least 2 of the 8 principles and describe what these principles mean to you. In your write-up, summarize the principles you selected in your own words and provide at least one example of an activity or action you could take that would support each principle and one example of an activity or action that you believe would violate each principle. Be sure your document is well-written with minimal grammatical and spelling issues.
Case Study Analysis 2The Cholesterol.xls records cholesterol lev.docxwendolynhalbert
Case Study Analysis 2
The Cholesterol.xls records cholesterol level data for individuals. Descriptions for the data follow:
· Cholesterol: Cholesterol level (mg/dL)
· Income: annual income in $
· Age: age of individual
· Jogging: number of hours an individual spends on jogging a day
· Saturated fat: the amount of saturated fat an individual takes a day (g)
(A) Develop an estimated regression equation that can be used to predict Cholesterol level using age, jogging income, and saturated fat. Discuss your findings including interpretation of slope of each variable and significance, using at least 200 words. Use .
(B) Starting with the estimated regression equation developed in part (A), delete any independent variables that are not statistically significant and develop a new estimated regression equation that can be used to predict Cholesterol level. Use . Discuss your findings including interpretation of slope of each variable and significance, using at least 200 words. Use .
(C) Compare model (A) and (B) in terms of R^2 and which model fits the data better? Discuss this using at least 100 words
(D) In model B, what are the most important factors affecting Cholesterol level? What are the least important factors? Discuss this using at least 100 words
Assignment1DueTHURSDAY.zip
Assignment1/Assignment1-17.pdf
ICT209 Assignment 1, Murdoch University 2016
ICT209 Assignment 1, Murdoch University 2016 1
ICT209 Assignment 1 2016
Objectives:
• Demonstrate that you can do Object Oriented design
• Demonstrate that you can write Object Oriented programs using C++.
• Demonstrate that you can design and write programs using user defined data structures.
• Demonstrate that you can work with data files.
• Demonstrate that you can write test plans and show evidence of systematic testing.
• Demonstrate that you can design using UML.
You do not work in groups for this assignment, as this is an individual assignment.
Worth:
14% of the unit
Due:
Midnight (end of Session 7). This would be the 7th teaching week.
How to submit (also see unit guide - section on Assignment/Project submission/return):
Singapore or Dubai Campus:
Into the assignment submission area for the unit in LMS. Follow all directions from your lecturer.
Murdoch Campus Internal students:
Into the assignment submission area for the unit in LMS.
Externals:
Into the assignment submission area for the unit in LMS.
For submitting in LMS, zip up the entire folder. Make sure that you have included all needed files. Do not
include temporary files or files not relevant to the assignment.
Name the zip file with the unit code, Assignment number, your name, student number.
ICT209Asg1JoBlogs12345678.zip
or alternatively,
ICT209_Asg1_JoBlogs_12345678.zip
Textual submissions should be type-written. External documentation can only be in the following formats:
Text (.txt)
PDF (.pdf)
RTF (.rtf)
HTML (.html)
Image formats : PNG ...
CIS 336 STUDY Introduction Education--cis336study.comclaric262
FOR MORE CLASSES VISIT
www.cis336study.com
Question 1. 1. (TCO 1) A DBMS performs several important functions that guarantee the integrity and consistency of the data in the database. Which of the following is NOT one of those functions?
Question 2. 2. (TCO 1) A relational DBMS provides protection of the _____ through security, control, and recovery facilities.
Question 3. 3. (TCO 2) A relationship is an association between _____
PROJECT STORYBOARD: Reducing Software Bug Fix Lead Time From 25 to 15 daysGoLeanSixSigma.com
GoLeanSixSigma.com Green Belt Eduardo Torres did a great job of cutting waste out of the process of fixing software bugs. The use of software is growing fast, and with no known way to guarantee new software is error-free, rapidly fixing bugs found is critical. Eduardo not only cut nearly 40% of the process time, but also cut the variability in half, greatly improving reliability!
– Susan Tighe, GoLeanSixSigma.com Master Black Belt
Coach
---
Eduardo Torres is a Senior Project Manager and Lean Six Sigma Green Belt with expertise in the Telecommunications Field. For his Green Belt Project, he decided to tackle the long lead time for software bug fixes – reducing the total lead time from 25 to 15 days!
Applied Business Project 2 – Data VisualizationYou MUST use th.docxjesuslightbody
Applied Business Project 2 – Data Visualization
You MUST use this template for your report
and submit your ABP-2 report to D2L as a PDF file.
Name: Lastname, Firstname (UA Email address)
Project: ABP-2 – Data Visualization
Task 1: ETL of Transactional Data
1.1.
Extract of Extracted Data (from Yahoo! Finance)
<insert the Header plus
only the first 10 rows of your downloaded CSV datafile here>
Important Note: Be sure your solution for Task 1.1 copies the data directly from your text editor (as lines of “text” and not as an image) so that your solution matches the unformatted data in the CSV file shown in the assignment guidelines. You must use a text editor for this task. You
cannot open your CSV file using Word, Pages, Excel, Sheets or other similar applications.
1.2.
Stock Price Summary Table (Based on Full Data Set)
<insert your solution for Task 1.2 table here>
1.3.
Stock Price Summary Table Formulas
1.3.1.
Excel Formula for the Daily Open Low
<insert your Excel formula for Task 1.3.1 here>
1.3.2.
Excel Formula for the Daily Open High
<insert your Excel formula
for Task 1.3.2 here>
1.3.3.
Excel Formula for the Daily Open Range
<insert your Excel formula
for Task 1.3.3 here>
1.4.
Data Visualizations (Stock Trading Prices)
<insert your visualization solution for Task 1.4 graph>
1.5 Data Visualizations (Trading Volume)
<insert your solution for Task 1.5 graph>
1.6 Assessment of how Visualizations can inform an investor (150 words)
<insert your written Assessment for Task 1.6 here> Task 2: Comparative Market and Financial Strength
2.
2.1. Tabular Data Representation
<insert your solution for Task 2.1>
2.2. Treemap Charts of financial data – your company
<insert your treemap chart for Task 2.2> - your company
2.3. Treemap Charts of financial data – a competitor
<insert your treemap chart for Task 2.3> - a competitor
2.4. Treemap Charts of financial data – a company ourside your industry
<insert your treemap chart for Task 2.4> - an unrelated company
2.5 Value of a Treemap Chart in Investment Analysis (150 words)
<insert your solution for Task 2.5 here>Task 3: Profiling Corporate Sustainability
3.
3.1.
Tabular Data for Sustainability Visualization
<insert your solution for Task 3.1 here>
3.2.
Sustainability Visualization (Radar Chart)
<insert your solution for Task 3.2>
3.3.
Sustainability Assessment (150 words)
<insert your solution for Task 3.3> Task 4: Assessing your stock the Warren Buffet Way
4.
4.1. Selection of Criteria and Visualization Chart Type4.1.1.
Criterion identifier and description
<insert your solution for Task 4.1.1>
4.1.2.
Selected chart type
<insert your solution for Task 4.1.2>
4.2. Visualization Assessment (15.
Assessment item 2—Group case studyDue date100pm AEST, Friday.docxdavezstarr61655
Assessment item 2—Group case study
Due date:
1:00pm AEST, Friday, Week 11
ASSESSMENT
Weighting:
35%
2
Length:
No set length
Introduction and Student Guide
The case study simulates a project management scenario where the student takes on the role of project manager. The case information is not complete so where necessary students will have to make assumptions and/or seek clarification from their tutor/lecturer.
To assist students in their solution development, the following information is provided:
· Product development case description
· Specific assessment questions that must be answered
· Information regarding the submission of the assessment
· Marking guide
Software Development Case Description
Jiemba Software is a leading software development company delivering comprehensive solutions in application development, systems integration and software testing. The name of the company is from the Indigenous Wiradjuri language and means ‘Laughing Star’. The company’s headquarter is located in Brisbane and the company has over ten years’ experience in custom software development for medium to large enterprises. The company specialises in developing games to engage Indigenous youth into the area of software development. The company has recently won a contract to develop a 2D-arcade games framework for a global entertainment company.
You are appointed as a project manager to manage the development and production of the new software framework. Several people are involved in this project including you as the project manager, Ms Gurumarra as the Director of Software Development, and your project team members consisting of three software engineers, two technical writers and two test engineers.
Your task is to generate the project schedule and allocate the resources provided to you using the information given regarding the milestones and the work breakdown structure shown in Table 1, and the resources and costs given in Table 2.Milestones
The following milestones have to be taken into account by your team members.
A. M1 Contract signed (This is the start of the project after the contract has been signed). The start date of the project is on 7/12/2015.
B. M2 Design approved. This milestone occurs after the design review meeting (task 1.7). The design must be approved before the project can proceed with the development tasks. For the purpose of this assignment, you can assume that the design will be approved at the review meeting.
C. M3 Test plan approved. This milestone marks the point at which the test plan has been developed and approved.
D. M4 Interface development tasks complete
E. M5 Engine development tasks complete
F. M6 Testing complete. This milestone occurs after all testing has been completed.
G. M7 Customer acceptance. This milestone occurs after task 7.3 Customer acceptance meeting has been completed.Table 1- Work Breakdown Structure
Task Name
WBS
Predecessor(s)
Effort
To be completed prior to the following milestone
1. Requ.
1 CIS105 Survey of Computer Information Systems Fi.docxmercysuttle
1
CIS105 Survey of Computer Information Systems
Final Project Rubric
Grading will be based upon the accuracy of your work, the appearance of your work, and how well
you apply the features you learned throughout the course. You are to complete and submit all
assessments for this project. Points will be granted in each of the categories listed below.
NOTE: You are only allowed to submit the Final Project once, so do your best work!
Category Description Possible
Points
MS Word
The document will be reviewed based on the successful completion of the
following:
• Use of Header and Footer
• Table of Contents
• Description of your experience completing the Final Project
• Formatting of text
• Correct file name
0-15
MS PowerPoint
The presentation will be reviewed based on the successful completion of the
following:
• Application of a theme
• Using of clipart
• Applying animation
• Adding slides
• Correct file name
0-15
MS Excel
The spreadsheet will be reviewed based on the successful completion of the
following:
• Calculating totals
• Applying formatting
• Computing data using formulas
• Computing data using functions
0-20
MS Access
The database will be reviewed based on the successful completion of the
following:
• Creating a report
• Querying data
• Customizing the look of a report
0-20
CIS105 At-Home Final Exam Part 1: Project – 70 points
1
MICROSOFT WORD (15 points)
You will create a business portfolio using the tools in MS Word to go with your Final
Exam for CIS105. You will demonstrate your ability to work with the features of MS
Word by creating a document, inserting a table of contents, and describing your
final exam.
a) Create a new document.
b) Create a Title Page with the following information centered on the page:
a. Your First and Last Name
b. Course and Section Number
c. Date
c) Add your MEID as a footer.
d) Insert a Table of Contents.
e) Create a section for each of the components of the Final Exam.
a. PowerPoint Presentation
b. Excel Spreadsheet
c. Access Database
f) For each section, write at least one paragraph describing the outcome of each
assignment on the Final Project.
a. What worked well?
b. What did you struggle with?
c. How long did it take you to complete the assignment?
g) Make sure that each of the three topics above are referenced in the Table of
Contents and set to automatically update.
h) Apply bold formatting to one item.
i) Apply italics to at least one item.
j) Apply Arial 12 point font to the entire document.
k) Save the file as Portfolio_YourName.docx.
CIS105 At-Home Final Exam Part 1: Project – 70 points
2
MICROSOFT POWERPOINT (15 points)
You will be creating a presentation for Buena Vista Apartments. You are presenting
an overview of the financial outlook for the company. The presentation will include
specific points you want t ...
COMP 2213X2 Assignment #2 Parts A and BDue February 3 in cla.docxdonnajames55
COMP 2213X2 Assignment #2 Parts A and B
Due February 3 in class
PLEASE HAND IN PARTS A AND B SEPARATELY!!!!
For “written” questions, please type your answers, use your very best English, and carefully
consider the material from the chapters. I am usually only looking for a few sentences for each
question, not an essay that goes on for pages. So choose your words carefully and thoughtfully.
PART A
[1] Does a computer need data registers (like D0–D7 in an M68K)? Defend your answer!
[2] Textbook question 5.35. If your student number is even, do parts (a), (c), (e) and (g). Otherwise do
parts (b), (d), (f) and (h). Note that (b) should read “[[[4]]]”, (c) should read “[[[0]]]” and
(h) should start with “[0]”.
[3] Explain why the following assembly language and RTL constructs are incorrect.
a. MOVE D3,#4
b. MOVE [D3],D2
c. MOVE (D3),D2
d. [D3] A0 + 3
e. [D3] #3
f. 3 [D3]
[4] Create a simple M68K program called ADDER. Your program should add together the numbers:
6, 4, 12, 16, 17, and 50. The program should leave the answer in register D0 when it terminates.
The program is to be assembled with the M68K cross-assembler and then run on the M68K simu-
lator. You can either install the cross-assembler and simulator given with the textbook (windows)
or you can use the Linux one available on the course web site. Doing a trace (to hand in) with the
windows version is much more painful than the Linux version, so make your choice carefully (and
you have to figure out the windows one without my help).
To use the Linux assembler (“68kasm”) and simulator (“bsvc”), follow the instructions in my
mail message of January 26, if you have not already done so.
IMPORTANT NOTE: if you are using the Linux simulator, the instructions for creating a program
are slightly different than those in the book. You should have the following at the start of each
program:
ORG $0
DC.L $8000 This is the stack pointer value after a "reset"
DC.L START This is the first instruction to execute
You can then follow that with something like
1
ORG $1000
START MOVE ...
You should still have a STOP instruction and END assembler directive, as described in the book,
but also use a BREAK instruction right before your STOP instruction.
Create your program (ADDER.s) in your (for example) comp2213/bsvc-master directory using
your favourite text editor and assemble it with the command 68kasm -l ADDER.s. If you had no
assembly errors you should now have a file called ADDER.h68 (which is your executable program)
and ADDER.lis (your program listing). Then start up the simulator by typing bsvc. Select
File/Open Setup, drill down to samples/m68000, select serial.setup and click Open; a
new window should pop up on your screen. Now choose File/Load Program, come back up to
your bsvc-master directory, and open your ADDER.h68 program. Now click the GUI’s Reset
button and then the Run button. (Alternatively, instead of Run click Single Step and watch the
result of each instruction..
IT 200 Network DiagramBelow is the wired network configurat.docxpriestmanmable
IT 200: Network Diagram
Below is the wired network configuration for Swagger Distribution. Use this to create and describe a Visio diagram of a wireless networking configuration appropriate for the company. Describe all aspects of the network using IT terminology.
Source: http://www.cityinfrastructure.com/Data/PhysicalDiagram.png
Assignment #10
(10 points)
Using MySQL SELECT commands answer the questions listed below using the Tiny Video schema used in your previous assignment. Submit via the D2L drop box the final SQL script for each problem. All questions are worth 2 points each.
1. Write a query to display the columns listed below. The query should list each customer once, whether they have rented a movie or not. Where the customer has rented a movie it should show only the first rental date. The output should be sorted by membership number.
2. Write a query to display the columns listed below. The query should list each customer who has not rented a move. The output should be sorted by membership number.
3. Write a query to display the columns listed below. The query should list each customer where the total detail rental fee is greater than twice the overall average detail rental fee. The output should be sorted by membership number. (Hint: A HAVING clause will be needed)
4. Write a query to display the columns listed below. The query should list each customer in which the video rental is overdue. The Days_Overdue column should calculate the number of days overdue based upon the due date and return date. The output should be sorted by membership number and then by the detail due date.
5. Write a query to display the columns listed below. For each customer the query should show the current system date, the current day (when you do the problem the date and day will be different), the number of characters in the member last name, the last date the customer rented a video and how many total videos the person rented.
1
IT 200: Program Code
Below is the code that is currently displayed on the computer screen at Swagger Distribution every morning when employees log on to their computers. The new owner would like you to add a second line that tells employees, “Welcome to Swagger Distribution!” It should go before the current date. The new owner would also like you to change the word “Current” to “Today’s” on the date output.
(Hint: To add a second line of output code, simply add a second System.out.print in the statement.)
Take this code to www.ideone.com. Important: On the bottom left of the compiler window, ensure that the toggle menu states Java and not another programming language. (The compiler automatically defaults to whatever language was used last.) Enter the code into the line that states: “// your code goes here”.
When you are ready to compile and run the code, click the green “run” button. Take a screenshot of your output. Use terminology you learned in this module to identify three components of ...
Hello Sir
We are a premier academic writing agency with industry partners in UK, Australia and Middle East and over 15 years of experience. We are looking to establish long-term relationships with industry partners and would love to discuss this opportunity further with you.
Thanks & Regards
visit our website.
www.onlineassignmenthelp.com.au
www.freeassignmenthelp.com
www.btechndassignment.cheapassignmenthelp.co.uk
www.cheapassignmenthelp.com
www.cheapassignmenthelp.co.uk/
Project Description The new computer-controlled convey.docxbriancrawford30935
Project Description
The new computer-controlled conveyor belt is an exciting project that moves and positions
items on the conveyor belt within 1 millimeter. The project will produce a new system for
future installations, and for replacement o f those in the field, at a low cost. The computer-
controlled conveyor belt has the potential to be a critical unit in 30 percent of the systems
installed in factories. The new system is also easier to update with future technologies. Table 1
has been developed for you to use in completing the project exercises.
Table 1 Conveyor Belt Project; WBS
Hardware Hardware specifications
Hardware design
Hardware documentation
Prototypes
Order circuit boards
Assemble preproduction models
Operating system Kernel specifications
Drivers
Disk drivers
Serial I/O drivers
Memory management
Operating system documentation
Network interface
Utilities Utilities specifications
Routine utilities
Complex utilities
Utilities documentation
Shell
System integration Architectural decisions
Integration first phase
System hard/software test
Project documentation
Integration acceptance testing
The project begins January 4, 2010.
The following holidays are observed: January 1, Memorial Day (last Monday in May),
July 4th, Labor Day (first Monday in September), Thanksgiving Day (4th Thursday in
November), December 25 and 26.
If a holiday falls on a Saturday then Friday will be given as an extra day off, and if it falls
on a Sunday, then Monday will be given as a day off.
The project teams work eight-hour days, Monday through Friday.
Part 1
1. Develop the WBS outline using the software available to you.
2. When is the project estimated to be completed?
3. How long will the project take?
4. What is the critical path(s) for the project?
5. Which activity has the greatest amount of slack?
Include the following printouts:
A Gantt chart.
A network diagram highlighting the critical path.
A schedule table reporting. ES, LS, EF, LF, and slack for each activity.
Table 2 Conveyor Belt Project; Schedule
Activity Description Resource (one team each) Duration (days) Preceding Activity
1 Architectural decisions Design 25 —
2 Hardware specifications Development, design 50 1
3 Kernel specifications Design 20 1
4 Utilities specifications Development, design 15 1
5 Hardware design Design, development 70 2
6 Disk drivers Assembly, development 100 3
7 Memory management Development 90 3
8 Operating system documentation Design, documentation 25 3
9 Routine utilities Development 60 4
10 Complex utilities Development 80 4
11 Utilities documentation Documentation, design 20 4
12 Hardware documentation Documentation, design 30 5
13 Integration first phase Assembly, development 50 6,7,8,9,10,11,12
14 Prototypes Assembly, development 80 13
15 Serial I/O drivers Development 130 13
16 System hard/software test Assembly 25 14.
75629 Topic prevention measures for vulneranbilitiesNumber of.docxsleeperharwell
75629 Topic: prevention measures for vulneranbilities
Number of Pages: 2 (Double Spaced)
Number of sources: 1
Writing Style: APA
Type of document: Editing
Academic Level:Undergraduate
Category: Computer Science
Language Style: English (U.S.)
Order Instructions: Attached
After identifying your organizations' vulnerabilities through previous weekly assignments, you now need to develop security measures to protect those vulnerabilities.
Create a spreadsheet of vulnerabilities and prevention measures for your organization.
Categorize by people, process, or technology.
Provide 350- to 700-word paper onnext steps for each prevention measure based on the vulnerability, potential incident, environmental and security controls in SDLC.
Submit your spreadsheet and paper using the Assignment Files tab.
Data Flow Diagram (DFD) Tips
Processes: Verbs
Dataflows: Nouns
Data Stores: Nouns
External Entities: Nouns
1) Process’s input & output are different
2) Each data store should have at least
one data flow in and one data flow out
3) Each process should have at least one
data flow in and one data flow out
4) All inputs and outputs should be
labeled
5) Processes should have an identifier
(Ex., 1.0, 2.0, etc.)
Process Process
Process-to-Process
Process Process
Process-to-Process
Process-to-External Entity
Process
External
Entity
Process-to-External Entity
Process
External
Entity
Data S tore
Process-to-Data Store
Process Data S tore
Process-to-Data Store
Process
External Entity-to-External Entity
External
Entity
External
Entity
External Entity-to-External Entity
External
Entity
External
Entity
Data S tore
Data Store-to-Data Store
Data S toreData S tore
Data Store-to-Data Store
Data S tore
External Entity-to-Data StoreExternal Entity-to-Data Store
External
Entity
Data S tore
External
Entity
Data S tore
External
Entity
Data S tore
External Entity-to-Data Store
External
Entity
Data S toreProcess Process
Process-to-Process
Process-to-External Entity
Process
External
Entity
Data S tore
Process-to-Data Store
Process
External Entity-to-External Entity
External
Entity
External
Entity
Data S tore
Data Store-to-Data Store
Data S tore
External Entity-to-Data Store
External
Entity
Data S tore
DFD_Rules.vsdxTop Process
Stage 2: Requirements Specification
Before you begin this assignment, be sure you have read the Case Study and all assignments for this class, especially Stage 4: Final System Report. The feedback you received on your Stage 1 assignment should be reviewed and used as you proceed with Stage 2.
Purpose of this Assignment
This assignment gives you the opportunity to specify clear and concise requirements, including the use of data and process models, for a system that enables a productive change in a way the business is conducted. This assignment specifically addresses the following course outcomes to enable you to:
· apply a systematic approach to .
PreparationGo to httpwww.excelsior.edumediaoelstutoringSm.docxIRESH3
Preparation:
Go to: http://www.excelsior.edu/media/oels/tutoring/Smarthinking/new1/Excelsior_ST_intro_0613.htm
Now complete the following:
After you have used the Smarthinking service, write a short paragraph on your experience with Smarthinking.
What did you like or dislike about it? Was it helpful?
Submit your paragraph in a Word document in the assignment. Be sure to check your content and spelling before you submit.
.
Practice Nurses will be comfortable having discussions about dea.docxIRESH3
Practice
Nurses will be comfortable having discussions about death, and will collaborate with the care teams to ensure that patients and families have current and accurate information about the possibility or probability of a patient’s impending death.
Education
Basic and specialist End-of-Life Nursing Education Consortium (ELNEC) resources will be available.
Research
Support the use of evidence-based and ethical care, and support decision-making for care at the end of life.
Administration
Promote work environments in which the standards for excellent care extend through the patient’s death and into post-death care for families.
-from each subcategory of practice, education, research and administration above, 1) describe how the APRN can provide effective care in end of life management.
Minimum 300 words,
3 references no more than 5 years
APA Style
no plagiarism
.
PrejudiceAlthough related, stereotypes and prejudice are separ.docxIRESH3
Prejudice
Although related, stereotypes and prejudice are separate entities.
Prejudice
is holding negative feelings for a group of people, or even a particular person, and is often considered the “emotional component to intergroup attitudes” (Levy & Hughes, 2009, p. 24). As mentioned in the previous week,
stereotyping
is the “cognitive process of intergroup attitudes,” generally referring to associating attributes to a particular group (Levy & Hughes, 2009, p. 24). The presence of stereotypes or intergroup bias leads to prejudiced behavior in some instances. When prejudice behavior does occur, the individual’s emotional response often plays a role.
For this Discussion, review the media
Prejudice
and consider how the emotions and stereotyping of the people in the media impacted their prejudiced behavior.
Reference:
Levy, S. R., & Hughes, J. M. (2009). Development of racial and ethnic prejudice among children. In T. D. Nelson (Ed.),
Handbook of prejudice, stereotyping, and discrimination
(pp. 23–42). New York, NY: Psychology Press.
With these thoughts in mind:
Post by Day 4
a brief interpretation of the events in the media. Then, describe any prejudiced behavior you observed and explain two ways the emotions of hte people in the media may have impacted their prejudiced behavior and why. Next, explain how the prejudice you observed in the media reinforced or disconfirmed stereotype content. Finally, explain how this information helps us understand the maintenance of group attitudes over time and situation.
Bottom of Form
·
Media: Laureate Education, Inc. (Executive Producer). (2011).
Prejudice
.
Baltimore, MD: Author.
(Click on the television screen once the video opens in a new window. “The Company” will appear on the television image.)
Note:
While the content within this media piece references Week 11, it is intended for Week 10 in this course.
·
o
Transcript
Readings
·
Course Text:
Handbook of Prejudice, Stereotyping, and Discrimination
·
o
Chapter 2, "Development of Racial and Ethnic Prejudice Among Children"
o
Chapter 14, "Intergroup Emotions Theory"
o
Chapter 15, "How Our Dreams of Death Transcendence Breed Prejudice, Stereotyping, and Conflict: Terror Management Theory"
·
Article: Devine, P. G. (1989). Stereotypes and prejudice: Their automatic and controlled components.
Journal of Personality and Social Psychology, 56
(1), 5–18. Retrieved from the Walden Library using the PsycINFO database.
.
More Related Content
Similar to Question 1Using Powerpoint, Word, Visio or any other graphical e.docx
Assessment item 2—Group case studyDue date100pm AEST, Friday.docxdavezstarr61655
Assessment item 2—Group case study
Due date:
1:00pm AEST, Friday, Week 11
ASSESSMENT
Weighting:
35%
2
Length:
No set length
Introduction and Student Guide
The case study simulates a project management scenario where the student takes on the role of project manager. The case information is not complete so where necessary students will have to make assumptions and/or seek clarification from their tutor/lecturer.
To assist students in their solution development, the following information is provided:
· Product development case description
· Specific assessment questions that must be answered
· Information regarding the submission of the assessment
· Marking guide
Software Development Case Description
Jiemba Software is a leading software development company delivering comprehensive solutions in application development, systems integration and software testing. The name of the company is from the Indigenous Wiradjuri language and means ‘Laughing Star’. The company’s headquarter is located in Brisbane and the company has over ten years’ experience in custom software development for medium to large enterprises. The company specialises in developing games to engage Indigenous youth into the area of software development. The company has recently won a contract to develop a 2D-arcade games framework for a global entertainment company.
You are appointed as a project manager to manage the development and production of the new software framework. Several people are involved in this project including you as the project manager, Ms Gurumarra as the Director of Software Development, and your project team members consisting of three software engineers, two technical writers and two test engineers.
Your task is to generate the project schedule and allocate the resources provided to you using the information given regarding the milestones and the work breakdown structure shown in Table 1, and the resources and costs given in Table 2.Milestones
The following milestones have to be taken into account by your team members.
A. M1 Contract signed (This is the start of the project after the contract has been signed). The start date of the project is on 7/12/2015.
B. M2 Design approved. This milestone occurs after the design review meeting (task 1.7). The design must be approved before the project can proceed with the development tasks. For the purpose of this assignment, you can assume that the design will be approved at the review meeting.
C. M3 Test plan approved. This milestone marks the point at which the test plan has been developed and approved.
D. M4 Interface development tasks complete
E. M5 Engine development tasks complete
F. M6 Testing complete. This milestone occurs after all testing has been completed.
G. M7 Customer acceptance. This milestone occurs after task 7.3 Customer acceptance meeting has been completed.Table 1- Work Breakdown Structure
Task Name
WBS
Predecessor(s)
Effort
To be completed prior to the following milestone
1. Requ.
1 CIS105 Survey of Computer Information Systems Fi.docxmercysuttle
1
CIS105 Survey of Computer Information Systems
Final Project Rubric
Grading will be based upon the accuracy of your work, the appearance of your work, and how well
you apply the features you learned throughout the course. You are to complete and submit all
assessments for this project. Points will be granted in each of the categories listed below.
NOTE: You are only allowed to submit the Final Project once, so do your best work!
Category Description Possible
Points
MS Word
The document will be reviewed based on the successful completion of the
following:
• Use of Header and Footer
• Table of Contents
• Description of your experience completing the Final Project
• Formatting of text
• Correct file name
0-15
MS PowerPoint
The presentation will be reviewed based on the successful completion of the
following:
• Application of a theme
• Using of clipart
• Applying animation
• Adding slides
• Correct file name
0-15
MS Excel
The spreadsheet will be reviewed based on the successful completion of the
following:
• Calculating totals
• Applying formatting
• Computing data using formulas
• Computing data using functions
0-20
MS Access
The database will be reviewed based on the successful completion of the
following:
• Creating a report
• Querying data
• Customizing the look of a report
0-20
CIS105 At-Home Final Exam Part 1: Project – 70 points
1
MICROSOFT WORD (15 points)
You will create a business portfolio using the tools in MS Word to go with your Final
Exam for CIS105. You will demonstrate your ability to work with the features of MS
Word by creating a document, inserting a table of contents, and describing your
final exam.
a) Create a new document.
b) Create a Title Page with the following information centered on the page:
a. Your First and Last Name
b. Course and Section Number
c. Date
c) Add your MEID as a footer.
d) Insert a Table of Contents.
e) Create a section for each of the components of the Final Exam.
a. PowerPoint Presentation
b. Excel Spreadsheet
c. Access Database
f) For each section, write at least one paragraph describing the outcome of each
assignment on the Final Project.
a. What worked well?
b. What did you struggle with?
c. How long did it take you to complete the assignment?
g) Make sure that each of the three topics above are referenced in the Table of
Contents and set to automatically update.
h) Apply bold formatting to one item.
i) Apply italics to at least one item.
j) Apply Arial 12 point font to the entire document.
k) Save the file as Portfolio_YourName.docx.
CIS105 At-Home Final Exam Part 1: Project – 70 points
2
MICROSOFT POWERPOINT (15 points)
You will be creating a presentation for Buena Vista Apartments. You are presenting
an overview of the financial outlook for the company. The presentation will include
specific points you want t ...
COMP 2213X2 Assignment #2 Parts A and BDue February 3 in cla.docxdonnajames55
COMP 2213X2 Assignment #2 Parts A and B
Due February 3 in class
PLEASE HAND IN PARTS A AND B SEPARATELY!!!!
For “written” questions, please type your answers, use your very best English, and carefully
consider the material from the chapters. I am usually only looking for a few sentences for each
question, not an essay that goes on for pages. So choose your words carefully and thoughtfully.
PART A
[1] Does a computer need data registers (like D0–D7 in an M68K)? Defend your answer!
[2] Textbook question 5.35. If your student number is even, do parts (a), (c), (e) and (g). Otherwise do
parts (b), (d), (f) and (h). Note that (b) should read “[[[4]]]”, (c) should read “[[[0]]]” and
(h) should start with “[0]”.
[3] Explain why the following assembly language and RTL constructs are incorrect.
a. MOVE D3,#4
b. MOVE [D3],D2
c. MOVE (D3),D2
d. [D3] A0 + 3
e. [D3] #3
f. 3 [D3]
[4] Create a simple M68K program called ADDER. Your program should add together the numbers:
6, 4, 12, 16, 17, and 50. The program should leave the answer in register D0 when it terminates.
The program is to be assembled with the M68K cross-assembler and then run on the M68K simu-
lator. You can either install the cross-assembler and simulator given with the textbook (windows)
or you can use the Linux one available on the course web site. Doing a trace (to hand in) with the
windows version is much more painful than the Linux version, so make your choice carefully (and
you have to figure out the windows one without my help).
To use the Linux assembler (“68kasm”) and simulator (“bsvc”), follow the instructions in my
mail message of January 26, if you have not already done so.
IMPORTANT NOTE: if you are using the Linux simulator, the instructions for creating a program
are slightly different than those in the book. You should have the following at the start of each
program:
ORG $0
DC.L $8000 This is the stack pointer value after a "reset"
DC.L START This is the first instruction to execute
You can then follow that with something like
1
ORG $1000
START MOVE ...
You should still have a STOP instruction and END assembler directive, as described in the book,
but also use a BREAK instruction right before your STOP instruction.
Create your program (ADDER.s) in your (for example) comp2213/bsvc-master directory using
your favourite text editor and assemble it with the command 68kasm -l ADDER.s. If you had no
assembly errors you should now have a file called ADDER.h68 (which is your executable program)
and ADDER.lis (your program listing). Then start up the simulator by typing bsvc. Select
File/Open Setup, drill down to samples/m68000, select serial.setup and click Open; a
new window should pop up on your screen. Now choose File/Load Program, come back up to
your bsvc-master directory, and open your ADDER.h68 program. Now click the GUI’s Reset
button and then the Run button. (Alternatively, instead of Run click Single Step and watch the
result of each instruction..
IT 200 Network DiagramBelow is the wired network configurat.docxpriestmanmable
IT 200: Network Diagram
Below is the wired network configuration for Swagger Distribution. Use this to create and describe a Visio diagram of a wireless networking configuration appropriate for the company. Describe all aspects of the network using IT terminology.
Source: http://www.cityinfrastructure.com/Data/PhysicalDiagram.png
Assignment #10
(10 points)
Using MySQL SELECT commands answer the questions listed below using the Tiny Video schema used in your previous assignment. Submit via the D2L drop box the final SQL script for each problem. All questions are worth 2 points each.
1. Write a query to display the columns listed below. The query should list each customer once, whether they have rented a movie or not. Where the customer has rented a movie it should show only the first rental date. The output should be sorted by membership number.
2. Write a query to display the columns listed below. The query should list each customer who has not rented a move. The output should be sorted by membership number.
3. Write a query to display the columns listed below. The query should list each customer where the total detail rental fee is greater than twice the overall average detail rental fee. The output should be sorted by membership number. (Hint: A HAVING clause will be needed)
4. Write a query to display the columns listed below. The query should list each customer in which the video rental is overdue. The Days_Overdue column should calculate the number of days overdue based upon the due date and return date. The output should be sorted by membership number and then by the detail due date.
5. Write a query to display the columns listed below. For each customer the query should show the current system date, the current day (when you do the problem the date and day will be different), the number of characters in the member last name, the last date the customer rented a video and how many total videos the person rented.
1
IT 200: Program Code
Below is the code that is currently displayed on the computer screen at Swagger Distribution every morning when employees log on to their computers. The new owner would like you to add a second line that tells employees, “Welcome to Swagger Distribution!” It should go before the current date. The new owner would also like you to change the word “Current” to “Today’s” on the date output.
(Hint: To add a second line of output code, simply add a second System.out.print in the statement.)
Take this code to www.ideone.com. Important: On the bottom left of the compiler window, ensure that the toggle menu states Java and not another programming language. (The compiler automatically defaults to whatever language was used last.) Enter the code into the line that states: “// your code goes here”.
When you are ready to compile and run the code, click the green “run” button. Take a screenshot of your output. Use terminology you learned in this module to identify three components of ...
Hello Sir
We are a premier academic writing agency with industry partners in UK, Australia and Middle East and over 15 years of experience. We are looking to establish long-term relationships with industry partners and would love to discuss this opportunity further with you.
Thanks & Regards
visit our website.
www.onlineassignmenthelp.com.au
www.freeassignmenthelp.com
www.btechndassignment.cheapassignmenthelp.co.uk
www.cheapassignmenthelp.com
www.cheapassignmenthelp.co.uk/
Project Description The new computer-controlled convey.docxbriancrawford30935
Project Description
The new computer-controlled conveyor belt is an exciting project that moves and positions
items on the conveyor belt within 1 millimeter. The project will produce a new system for
future installations, and for replacement o f those in the field, at a low cost. The computer-
controlled conveyor belt has the potential to be a critical unit in 30 percent of the systems
installed in factories. The new system is also easier to update with future technologies. Table 1
has been developed for you to use in completing the project exercises.
Table 1 Conveyor Belt Project; WBS
Hardware Hardware specifications
Hardware design
Hardware documentation
Prototypes
Order circuit boards
Assemble preproduction models
Operating system Kernel specifications
Drivers
Disk drivers
Serial I/O drivers
Memory management
Operating system documentation
Network interface
Utilities Utilities specifications
Routine utilities
Complex utilities
Utilities documentation
Shell
System integration Architectural decisions
Integration first phase
System hard/software test
Project documentation
Integration acceptance testing
The project begins January 4, 2010.
The following holidays are observed: January 1, Memorial Day (last Monday in May),
July 4th, Labor Day (first Monday in September), Thanksgiving Day (4th Thursday in
November), December 25 and 26.
If a holiday falls on a Saturday then Friday will be given as an extra day off, and if it falls
on a Sunday, then Monday will be given as a day off.
The project teams work eight-hour days, Monday through Friday.
Part 1
1. Develop the WBS outline using the software available to you.
2. When is the project estimated to be completed?
3. How long will the project take?
4. What is the critical path(s) for the project?
5. Which activity has the greatest amount of slack?
Include the following printouts:
A Gantt chart.
A network diagram highlighting the critical path.
A schedule table reporting. ES, LS, EF, LF, and slack for each activity.
Table 2 Conveyor Belt Project; Schedule
Activity Description Resource (one team each) Duration (days) Preceding Activity
1 Architectural decisions Design 25 —
2 Hardware specifications Development, design 50 1
3 Kernel specifications Design 20 1
4 Utilities specifications Development, design 15 1
5 Hardware design Design, development 70 2
6 Disk drivers Assembly, development 100 3
7 Memory management Development 90 3
8 Operating system documentation Design, documentation 25 3
9 Routine utilities Development 60 4
10 Complex utilities Development 80 4
11 Utilities documentation Documentation, design 20 4
12 Hardware documentation Documentation, design 30 5
13 Integration first phase Assembly, development 50 6,7,8,9,10,11,12
14 Prototypes Assembly, development 80 13
15 Serial I/O drivers Development 130 13
16 System hard/software test Assembly 25 14.
75629 Topic prevention measures for vulneranbilitiesNumber of.docxsleeperharwell
75629 Topic: prevention measures for vulneranbilities
Number of Pages: 2 (Double Spaced)
Number of sources: 1
Writing Style: APA
Type of document: Editing
Academic Level:Undergraduate
Category: Computer Science
Language Style: English (U.S.)
Order Instructions: Attached
After identifying your organizations' vulnerabilities through previous weekly assignments, you now need to develop security measures to protect those vulnerabilities.
Create a spreadsheet of vulnerabilities and prevention measures for your organization.
Categorize by people, process, or technology.
Provide 350- to 700-word paper onnext steps for each prevention measure based on the vulnerability, potential incident, environmental and security controls in SDLC.
Submit your spreadsheet and paper using the Assignment Files tab.
Data Flow Diagram (DFD) Tips
Processes: Verbs
Dataflows: Nouns
Data Stores: Nouns
External Entities: Nouns
1) Process’s input & output are different
2) Each data store should have at least
one data flow in and one data flow out
3) Each process should have at least one
data flow in and one data flow out
4) All inputs and outputs should be
labeled
5) Processes should have an identifier
(Ex., 1.0, 2.0, etc.)
Process Process
Process-to-Process
Process Process
Process-to-Process
Process-to-External Entity
Process
External
Entity
Process-to-External Entity
Process
External
Entity
Data S tore
Process-to-Data Store
Process Data S tore
Process-to-Data Store
Process
External Entity-to-External Entity
External
Entity
External
Entity
External Entity-to-External Entity
External
Entity
External
Entity
Data S tore
Data Store-to-Data Store
Data S toreData S tore
Data Store-to-Data Store
Data S tore
External Entity-to-Data StoreExternal Entity-to-Data Store
External
Entity
Data S tore
External
Entity
Data S tore
External
Entity
Data S tore
External Entity-to-Data Store
External
Entity
Data S toreProcess Process
Process-to-Process
Process-to-External Entity
Process
External
Entity
Data S tore
Process-to-Data Store
Process
External Entity-to-External Entity
External
Entity
External
Entity
Data S tore
Data Store-to-Data Store
Data S tore
External Entity-to-Data Store
External
Entity
Data S tore
DFD_Rules.vsdxTop Process
Stage 2: Requirements Specification
Before you begin this assignment, be sure you have read the Case Study and all assignments for this class, especially Stage 4: Final System Report. The feedback you received on your Stage 1 assignment should be reviewed and used as you proceed with Stage 2.
Purpose of this Assignment
This assignment gives you the opportunity to specify clear and concise requirements, including the use of data and process models, for a system that enables a productive change in a way the business is conducted. This assignment specifically addresses the following course outcomes to enable you to:
· apply a systematic approach to .
PreparationGo to httpwww.excelsior.edumediaoelstutoringSm.docxIRESH3
Preparation:
Go to: http://www.excelsior.edu/media/oels/tutoring/Smarthinking/new1/Excelsior_ST_intro_0613.htm
Now complete the following:
After you have used the Smarthinking service, write a short paragraph on your experience with Smarthinking.
What did you like or dislike about it? Was it helpful?
Submit your paragraph in a Word document in the assignment. Be sure to check your content and spelling before you submit.
.
Practice Nurses will be comfortable having discussions about dea.docxIRESH3
Practice
Nurses will be comfortable having discussions about death, and will collaborate with the care teams to ensure that patients and families have current and accurate information about the possibility or probability of a patient’s impending death.
Education
Basic and specialist End-of-Life Nursing Education Consortium (ELNEC) resources will be available.
Research
Support the use of evidence-based and ethical care, and support decision-making for care at the end of life.
Administration
Promote work environments in which the standards for excellent care extend through the patient’s death and into post-death care for families.
-from each subcategory of practice, education, research and administration above, 1) describe how the APRN can provide effective care in end of life management.
Minimum 300 words,
3 references no more than 5 years
APA Style
no plagiarism
.
PrejudiceAlthough related, stereotypes and prejudice are separ.docxIRESH3
Prejudice
Although related, stereotypes and prejudice are separate entities.
Prejudice
is holding negative feelings for a group of people, or even a particular person, and is often considered the “emotional component to intergroup attitudes” (Levy & Hughes, 2009, p. 24). As mentioned in the previous week,
stereotyping
is the “cognitive process of intergroup attitudes,” generally referring to associating attributes to a particular group (Levy & Hughes, 2009, p. 24). The presence of stereotypes or intergroup bias leads to prejudiced behavior in some instances. When prejudice behavior does occur, the individual’s emotional response often plays a role.
For this Discussion, review the media
Prejudice
and consider how the emotions and stereotyping of the people in the media impacted their prejudiced behavior.
Reference:
Levy, S. R., & Hughes, J. M. (2009). Development of racial and ethnic prejudice among children. In T. D. Nelson (Ed.),
Handbook of prejudice, stereotyping, and discrimination
(pp. 23–42). New York, NY: Psychology Press.
With these thoughts in mind:
Post by Day 4
a brief interpretation of the events in the media. Then, describe any prejudiced behavior you observed and explain two ways the emotions of hte people in the media may have impacted their prejudiced behavior and why. Next, explain how the prejudice you observed in the media reinforced or disconfirmed stereotype content. Finally, explain how this information helps us understand the maintenance of group attitudes over time and situation.
Bottom of Form
·
Media: Laureate Education, Inc. (Executive Producer). (2011).
Prejudice
.
Baltimore, MD: Author.
(Click on the television screen once the video opens in a new window. “The Company” will appear on the television image.)
Note:
While the content within this media piece references Week 11, it is intended for Week 10 in this course.
·
o
Transcript
Readings
·
Course Text:
Handbook of Prejudice, Stereotyping, and Discrimination
·
o
Chapter 2, "Development of Racial and Ethnic Prejudice Among Children"
o
Chapter 14, "Intergroup Emotions Theory"
o
Chapter 15, "How Our Dreams of Death Transcendence Breed Prejudice, Stereotyping, and Conflict: Terror Management Theory"
·
Article: Devine, P. G. (1989). Stereotypes and prejudice: Their automatic and controlled components.
Journal of Personality and Social Psychology, 56
(1), 5–18. Retrieved from the Walden Library using the PsycINFO database.
.
PowerPoint1.Apple effects on Samsung·8 slides·Refe.docxIRESH3
PowerPoint
1.
Apple effects on Samsung
·
8 slides
·
References or Citation (MLA)
2.
Global, Ethics and Security Management
·
8 slides and 1 video
·
References or Citation (MLA)
.
PowerPoint with 10 slides and speaker notes with 75-150 words per .docxIRESH3
PowerPoint with 10 slides and speaker notes with 75-150 words per slide
The Medical Staff Coordinator has requested that you prepare a 10 slide PowerPoint presentation on one of the following topics to discuss with the incoming residents. The Medical Staff Coordinator has also requested you maintain a neutral position, discussing the legal and ethical issues surrounding the topic. You are also asked to use research (at least 2 sources) to substantiate your discussion.
Choose one of the following topics of contemporary ethical dilemmas.
Acquired Immune Deficiency Syndrome (AIDS)
Organ Donations
Human Genetics
Euthanasia
Assisted Suicide
Stem Cell Research
Abortion
.
preferences
Document Viewer
Turnitin
Originality Report
Processed on: 28-Oct-2014 8:41 AM CDT
ID: 470269214
Word Count: 1441
Submitted: 1
1
By Renu Kumar
Similarity Index
17%
Similarity by Source
Internet Sources:
12%
Publications:
9%
Student Papers:
N/A
include quoted
include bibliography
exclude small matches
download
refresh
print
mode:
6% match (Internet from 18-Jun-2014)
http://www.antiessays.com
3% match (Internet from 18-Jun-2014)
http://www.antiessays.com
2% match (publications)
Goines, Lisa Hagler, Louis. "Noise pollution: a modern plague.", Southern Medical Journal, March 2007 Issue
2% match (publications)
"Personal Space", Encyclopedia of Applied Psychology, 2004
1% match (Internet from 17-Jun-2014)
http://www.antiessays.com
1% match (publications)
Nia, Mahin Etemedi, Majid Mahmood Aliloo, and Khalil Ansarin. "The role of stress and coping strategies in the emergence of asthma, and the moderating effects of gender in this illness", Procedia - Social and Behavioral Sciences, 2010.
1% match (Internet from 30-Jul-2014)
http://kerry43.hubpages.com
1% match (Internet from 29-Aug-2007)
http://www.overnightessays.com
<1% match (Internet from 18-Oct-2011)
http://www.brainmass.com
Running head: THE EFFECTS OF POPULATION DENSITY AND NOISE The Effects of Population Density and Noise
Renu Kumar
PSY/460
November 3, 2013 Christine Hander The
Effects of Population Density and Noise Population density and noise
can have many
effects
on individuals.
Population density
is
the
amount
of
people, which live in a particular area. Along with population density, comes noise; noise is typically an unwanted distraction. In this paper the subject to discuss is
the concepts of territoriality, privacy, and personal space; examine how the concepts of territoriality, privacy, and personal space have become increasingly important as
populations become
denser; clarify the effect nature has on individuals living in urban environments, describe the concept of noise and examine the effect it has on individuals; and examine strategies that can be used to reduce noise in the workplace or in the living environment. Concepts of
Territoriality,
Privacy, and Personal Space
Territories are areas
marked and defended by
their owners
and
often
used for life- sustaining activities
(Territoriality, 2004). The most common example of a person's territory would be his or her home because one tends to personalize and defend what is theirs. A person identifies themselves with his or her territory and any threat to that territory feels like a threat to themselves (Territoriality, 2004). A person feels connected to his or her territory and sees it as a means to satisfying his or her needs within society. Privacy is the selective control of access to oneself and group (Privacy, 2004). A person has the ability to decide who to allow in his or her territory or personal space. A person's
personal space
describes
the emotionally tinged zone around the .
Precedents Set By George WashingtonGeorge Washington was aware tha.docxIRESH3
Precedents Set By George Washington
George Washington was aware that many of his actions would be regarded as precedents. Here are three precedents that Washington established:
Washington created the first Presidential Cabinet. Who was on the Cabinet, and what Departments did they represent? Who is on the Cabinet today, and what Departments do they represent?
Washington was the first President to leave office after two terms. Is that precedent still followed today? Why or why not?
Washington was the first to establish foreign policy, and issued the Proclamation of Neutrality. What situation did this proclamation address? What agency advises the President on foreign policy today? What is the role of this agency?
Be sure to include where you got your information. For example, include web site addresses. Must be a page and half.
.
Predictors of Abusive Supervision Supervisor Perceptions of Deep.docxIRESH3
“Predictors of Abusive Supervision: Supervisor Perceptions of Deep
-Level Dissimilarity, Relationship Conflict, and
Subordinate Performance,” by Bennett Tepper, Sherry Moss, and
Michelle Duffy.
Write your critique in standard essay form. Begin with an introduction that defines the subject of your critique and your
point of view. You will need to identify and explain the author's ideas. Include specific passages that support your
description of the author's point of view. Offer your own opinion. Explain what you think about the argument. Defend your
point of view by raising specific issues or aspects of the argument. Describe several points with which you agree or
disagree and include specific passages from the article (you may summarize, quote, or paraphrase) that provide evidence
for your point of view. Explain how the passages support your opinion. Conclude your critique by summarizing your
argument and re-emphasizing your opinion. Your critique should be at least two full pages in length, using 12-point
double-spaced Times Roman font using APA format.
.
Pre-Lab QuestionsWhat major event occurs during interphase.docxIRESH3
Pre-Lab Questions
What major event occurs during interphase?
A person, residing in a location where they are exposed to the sun often, develops a mutation in some of their skin cells resulting in cancer. Consider whether their offspring will be born with the same mutation. Use scientific evidence to support your answer.
Experiment 1: Following Chromosomal DNA Movement through Meiosis
Data Tables and Post-Lab Assessment
Part 1 - Meiotic Division Beads Diagram without Crossing Over
Prophase I
Metaphase I
Anaphase I
Telophase I
Prophase II
Metaphase II
Anaphase II
Telophase II
Cytokinesis
Part 2:
Meiotic Division Beads Diagram
with Crossing Over
Prophase I
Metaphase I
Anaphase I
Telophase I
Prophase II
Metaphase II
Anaphase II
Telophase II
Cytokinesis
Post-Lab Questions
1.
What is the ploidy of the DNA at the end of meiosis I? What about at the end of meiosis II?
2.
How are meiosis I and meiosis II different?
3.
Why do you use non-sister chromatids to demonstrate crossing over?
4.
What combinations of alleles could result from a crossover between BD and bd chromosomes?
5.
How many chromosomes were present when meiosis I started?
6.
How many nuclei are present at the end of meiosis II? How many chromosomes are in each?
7.
Identify two ways that meiosis contributes to genetic recombination.
8.
Why is it necessary to reduce the number of chromosomes in gametes, but not in other cells?
9.
Blue whales have 44 chromosomes in every cell. Determine how many chromosomes you would expect to find in the following:
Sperm Cell:
Egg Cell:
Daughter Cell from Meiosis I:
Daughter Cell from Meiosis II:
10.
Research and find a disease that is caused by chromosomal mutations. When does the mutation occur? What chromosomes are affected? What are the consequences?
11.
Diagram what would
happen if sexual reproduction took place for four generations using diploid (2n) cells.
Experiment 2: The Importance of Cell Cycle Control
Data
Post-Lab Questions
1.
Record your hypothesis from Step 1 in the Procedure section here.
2.
What do your results indicate about cell cycle control?
3.
Suppose a person developed a mutation in a somatic cell which diminishes the performance of the body’s natural cell cycle control proteins. This mutation resulted in cancer, but was effectively treated with a cocktail of cancer-fighting techniques. Is it possible for this person’s future children to inherit this cancer-causing mutation? Be specific when you explain why or why not.
4.
Why do cells which lack cell cycle control exhibit karyotypes which look physically different than cells with normal cell cycle.
5.
What are HeLa cells? Why are HeLa cells appropriate for this experiment?
.
Pre-Lab QuestionsUse the following classificatio.docxIRESH3
Pre-Lab Questions
Use the following classifications to determine which organism is least related out of the three. Explain your rationale.
Table 2: Classifications
Classification Level
American Green Tree Frog
European Fire- Bellied Toad
Eastern Newt
Domain
Eukarya
Eukarya
Eukarya
Kingdom
Animalia
Animalia
Animalia
Phylum
Chordata
Chordata
Chordata
Class
Amphibia
Amphibia
Amphibia
Order
Anura
Anura
Caudata
Family
Hylidae
Bombinatoridae
Salamandridae
Genus
Tursipops
Bombina
Notophthalmus
Species
cinerea
bombina
viridescens
How has DNA sequencing affected the science of classifying organisms?
You are on vacation and see an organism that you do not recognize. Discuss what possible steps you can take to classify it.
Exercise 1: Dichotomous Key Practice
Table 3: Dichotomous Key Results
Organism
Binomial Name
i
ii
iii
iv
v
vi
vii
viii
ix
x
xi
xii
xiii
Post-Lab Questions
What do you notice about the options of each step as they go from number one up?
How does your answer from Que
stion 1 relate to the Linnaean classification system?
Exercise 2: Classification of Organisms
Data Tables and Post-Lab Assessment
Table 2: Key Characteristics of Some Organisms
Organism
Kingdom
Domain
Defined Nucleus
Motile
Cell Wall
Photosynthesis
Unicellular
E. coli
Yes
Yes
Protozoa
Yes
Yes
Yes
Mushroom
Yes
Yes
Sunflower
Yes
Yes
Yes
Bear
Yes
Yes
Figure 4:
Exercise 2 - Classification of Organisms Flow Chart
Post-Lab Questions
Did this series of questions correctly organize each organism? Why or why not?
What additional questions would you ask to further categorize the items
within
the kingdoms (Hint: think about other organisms in each of the kingdoms and what makes them different than the examples used here)?
What questions would you have asked instead of the ones that you answered above when classifying the organisms?
.
Pre-Lab QuestionsNitrogen fixation is a natural process by whi.docxIRESH3
Pre-Lab Questions
Nitrogen fixation is a natural process by which inert or unreactive forms of nitrogen are transformed into usable nitrogen. Why is this process important to life?
Given when you have learned about the hydrogen bonding shared between nucleic acids in DNA, which pair is more stable under increasing heat: adenine and thymine, or cytosine and guanine? Explain why.
Which of the following is not an organic molecule; Methane (CH
4
), Fructose (C
6
H
12
O
6
), Ethanol (C
6
H
12
O), or Ammonia (NH
3
)? How do you know?
Experiment 1: Testing for Proteins
Data Tables and Post-Lab Assessment
Table 1: A Priori Predictions
Sample
Will There be Protein Present?
Initial Color
Final Color
1 - Albumin
Solution
2 - Gelatin
.
Pre-AssignmentWrite a 3-4 page paper (not counting cover page and .docxIRESH3
Pre-Assignment
Write a 3-4 page paper (not counting cover page and refeence page) that addresses your view on the following:
1. Why do you think people protest?
2. What aspects of movements do you feel reflect a democratic character and democratic processes?
3. Why do you think some movements, notably the U.S.Civil Rights Movement, are widely celebrated and others are feared?
4. Why do you think protesters sometimes become violent, and does it help or hurt their cause?
5. In your opinion, are conventional tactics like rallies and marches more effective; why or why not?
Course textbook using: Eitzen, D. Stanley & Stewart, Kenneth (2007).
Solution
s to social problems from the bottom up:
successful social movements
.
Pearson Education, Inc. [ISBN-10: 0205468845]
.
PowerPoint Length 6 slides (excluding title and reference slid.docxIRESH3
PowerPoint Length:
6 slides (excluding title and reference slides) and speaker notes of 200 words per slide
A key component of an effective workplace is the ability of the groups to successfully collaborate. Choose a work group within your organization. Using a model of organizational improvement, plan a development project for this group. Include responses to the following in your presentation:
Describe the group, its purpose (work function), how this group fits into the overall organization, its reporting relationships, and its key stakeholders.
How will you gather data (interviews, questionnaires, or group discussions) from the group and any key stakeholders?
Describe the type of data that you will need to design your development plan.
How will you diagnose the level of functioning for the group?
Give a few examples of developmental activities that you would use for various levels of functioning that are based on your diagnosis.
How would you communicate the progress of the group to both group members and key stakeholders?
4ip
.
Practice Before IRS Please respond to the followinghttpwww..docxIRESH3
Practice Before IRS"
Please respond to the following:
http://www.irs.gov/Tax-Professionals/Enrolled-Agents/Circular-230-Disciplinary-Proceedings
,
analyze the persons / parties that the disciplinary proceedings are applicable too. Based on your analysis, propose at least two (2) other persons / parties that you would add. Provide support for your proposal.
Analyze Section 10.82 disciplinary proceedings for expedited suspension. Based on your analysis, give your opinion as to whether or not the expedited suspension rules are an effective deterrent to violators. Justify your response.
.
PPT about fair use advertisement case in bisiness law.Introduce pr.docxIRESH3
PPT about fair use advertisement case in bisiness law.
Introduce presenter and case.
What is the subject of the case?
Highest Court which heard case.
Relevant facts stated concisely.
Outcome of case.
Court’s reasoning explained clearly.
Historical context explained. At least date.
Update of law.
.
Prejudice, Stereotypes, and DiscriminationIn many cases, prejudice.docxIRESH3
Prejudice, Stereotypes, and Discrimination
In many cases, prejudice stems from the unknown. As individuals, we tend to migrate toward those who may look like us, act like us, and think like us. As a result, it may be difficult for us to open our minds and embrace those whose values, beliefs, and overall sense of self differ from our own.
For this assignment, compose a paper that is three to four pages in length. In your paper, discuss the impacts of prejudice, stereotypes, and discrimination in the context of social psychology. Be sure to address the following points:
1. Define and describe the following terms: prejudice, stereotype, discrimination, and ingroup vs. outgroup. Based on your own experiences in the social world, can you relate to any of these terms? Do you identify with a particular term? Why or why not?
2. Examine the social, cognitive, and societal origins of prejudice and stereotypes. Be sure to include specific information regarding categorization, such as ingroup favoritism and the outgroup homogeneity effect, norms, competition for resources, and social inequalities. Of the categories presented, which do you think are the most significant in our society and in your particular community?
3. Analyze the influences that promote stereotyping, and offer strategies to reduce prejudice. What are the consequences of stereotyping and discrimination? Who does this behavior hurt, and in what ways does it hurt them? Are we inadvertently creating self-fulfilling prophecies in our society? If so, how can we take steps to improve attitudes, judgments, and behaviors?
Your paper must include an introduction, a thesis statement, and a conclusion. Your completed assignment should be three to four pages in length (excluding title and reference pages), include a minimum of three references, and follow APA guidelines as outlined in the Ashford Writing Center.
.
Preparation•Review the document titled City of Charlottesville 20.docxIRESH3
Preparation
•Review the document titled “City of Charlottesville 2010 Annual Comprehensive Plan” located in the course shell. Write a three to four (3-4) page paper in which you:
1.
Review the “City of Charlottesville 2010 Annual Comprehensive Plan” and then complete Exercise 1 on page 152 using Exhibits C and D in the Annual Report and Table 9.4 on page 148. Change the title headers to the agency name. Save the Excel File as the agency’s name and include the Multiyear Plan.
2.
Analyze the comparison of ratios.
3.
Analyze the measures of liquidity.
4.
Analyze the long-term solvency.
5.
Analyze asset management rations.
.
PowerPoint presentationImagine that you are a consultant for a.docxIRESH3
PowerPoint presentation
Imagine that you are a consultant for an organization, and they want you to work on developing their core values. The organization would like their core values to reflect key attributes of their culture.
Select an organization, such as a company, community group, or nonprofit organization.
Create a 10- to 12-Microsoft® PowerPoint® slide presentation describing cultural, research-based models and how they help clarify the organization's core values.
Include at least three credible, peer-reviewed references.
Format the citations in your presentation consistent with APA guidelines.
.
PowerPoint PresentationImagine that you are at your job discussi.docxIRESH3
PowerPoint Presentation
Imagine that you are at your job discussing how much you are learning throughout your Sociology of Sport class.This has
led some of them to ask you to present the newfound knowledge to your monthly
“brown bag lunch”
group at work.
Create a PowerPoint presentation to share with your colleagues that discusses the three major theories found in Unit I:
1. Cultural theories
2. Interactionist theories
3. Structural theories
Include the following information regarding the theories:
What is known about the theory
Major focus of the analysis
Major concepts used
Related research studies
Please make sure to have a title slide with the title of the slideshow and your name, slides that are relevant for this
presentation, and a closing reference slide. You can also use the slide notes at the bottom of each slide as well, but it is
not required. Also, be creative with your slides.
You are required to have
at least six (6) slides
not including the title slide and reference slide. Please be creative with your
presentation through the use of colors, pictures, and other graphics.
Use your own words, and include citations for sources. In addition, consider utilizing the Success Center to help with
your presentation.
.
Macroeconomics- Movie Location
This will be used as part of your Personal Professional Portfolio once graded.
Objective:
Prepare a presentation or a paper using research, basic comparative analysis, data organization and application of economic information. You will make an informed assessment of an economic climate outside of the United States to accomplish an entertainment industry objective.
Model Attribute Check Company Auto PropertyCeline George
In Odoo, the multi-company feature allows you to manage multiple companies within a single Odoo database instance. Each company can have its own configurations while still sharing common resources such as products, customers, and suppliers.
Acetabularia Information For Class 9 .docxvaibhavrinwa19
Acetabularia acetabulum is a single-celled green alga that in its vegetative state is morphologically differentiated into a basal rhizoid and an axially elongated stalk, which bears whorls of branching hairs. The single diploid nucleus resides in the rhizoid.
Unit 8 - Information and Communication Technology (Paper I).pdfThiyagu K
This slides describes the basic concepts of ICT, basics of Email, Emerging Technology and Digital Initiatives in Education. This presentations aligns with the UGC Paper I syllabus.
The Roman Empire A Historical Colossus.pdfkaushalkr1407
The Roman Empire, a vast and enduring power, stands as one of history's most remarkable civilizations, leaving an indelible imprint on the world. It emerged from the Roman Republic, transitioning into an imperial powerhouse under the leadership of Augustus Caesar in 27 BCE. This transformation marked the beginning of an era defined by unprecedented territorial expansion, architectural marvels, and profound cultural influence.
The empire's roots lie in the city of Rome, founded, according to legend, by Romulus in 753 BCE. Over centuries, Rome evolved from a small settlement to a formidable republic, characterized by a complex political system with elected officials and checks on power. However, internal strife, class conflicts, and military ambitions paved the way for the end of the Republic. Julius Caesar’s dictatorship and subsequent assassination in 44 BCE created a power vacuum, leading to a civil war. Octavian, later Augustus, emerged victorious, heralding the Roman Empire’s birth.
Under Augustus, the empire experienced the Pax Romana, a 200-year period of relative peace and stability. Augustus reformed the military, established efficient administrative systems, and initiated grand construction projects. The empire's borders expanded, encompassing territories from Britain to Egypt and from Spain to the Euphrates. Roman legions, renowned for their discipline and engineering prowess, secured and maintained these vast territories, building roads, fortifications, and cities that facilitated control and integration.
The Roman Empire’s society was hierarchical, with a rigid class system. At the top were the patricians, wealthy elites who held significant political power. Below them were the plebeians, free citizens with limited political influence, and the vast numbers of slaves who formed the backbone of the economy. The family unit was central, governed by the paterfamilias, the male head who held absolute authority.
Culturally, the Romans were eclectic, absorbing and adapting elements from the civilizations they encountered, particularly the Greeks. Roman art, literature, and philosophy reflected this synthesis, creating a rich cultural tapestry. Latin, the Roman language, became the lingua franca of the Western world, influencing numerous modern languages.
Roman architecture and engineering achievements were monumental. They perfected the arch, vault, and dome, constructing enduring structures like the Colosseum, Pantheon, and aqueducts. These engineering marvels not only showcased Roman ingenuity but also served practical purposes, from public entertainment to water supply.
Palestine last event orientationfvgnh .pptxRaedMohamed3
An EFL lesson about the current events in Palestine. It is intended to be for intermediate students who wish to increase their listening skills through a short lesson in power point.
Welcome to TechSoup New Member Orientation and Q&A (May 2024).pdfTechSoup
In this webinar you will learn how your organization can access TechSoup's wide variety of product discount and donation programs. From hardware to software, we'll give you a tour of the tools available to help your nonprofit with productivity, collaboration, financial management, donor tracking, security, and more.
Operation “Blue Star” is the only event in the history of Independent India where the state went into war with its own people. Even after about 40 years it is not clear if it was culmination of states anger over people of the region, a political game of power or start of dictatorial chapter in the democratic setup.
The people of Punjab felt alienated from main stream due to denial of their just demands during a long democratic struggle since independence. As it happen all over the word, it led to militant struggle with great loss of lives of military, police and civilian personnel. Killing of Indira Gandhi and massacre of innocent Sikhs in Delhi and other India cities was also associated with this movement.
Question 1Using Powerpoint, Word, Visio or any other graphical e.docx
1. Question 1
Using Powerpoint, Word, Visio or any other graphical editor
that allows you to create shapes and arrows, create a simple
flow chart that provides the functionality for this pseudocode:
Write “Enter the price in dollars: “
Input Price
Write “Enter state sales tax(e.g. .06) : “
Input SalesTax
Set Price = Price + (Price * SalesTax)
Write “Price with Tax is “ + Price
Also, Provide a test case that you could use to validate your
algorithm. (For example, what values for input would you use
and what would the resulting output be for those input values)
Attach or embed your flow chart along with your test case as a
response to this discussion topic.
Question 2
n everyday life we are all faced with many choices we must
make on a daily basis.
1. Provide an Algorithm for your real world decision you must
make on a daily basis that involves 2 or more choices
2. Provide your C code that implements your real world
decision (be sure to utilize proper formatting and spacing to
enhance your codes clarity, and applicable comments)
3. Explain your logic for the conditional statement you decided
to use
4. Provide feedback to fellow student’s submission that involves
converting their conditional statement to another conditional
statement form
Work- homework
Homework 2
Instructions
In this homework, you will design a program to perform the
following task:
2. Calculate the total price based on several key parts required to
build a state-of-the-art gaming computer. The user will have the
option of selecting different parts. For example, Windows 7,
Windows 8 or Mac OS/X for Operating systems, 4 GB, 8 GB or
12 GB for RAM and 15”,17” or 22” Monitors.
There are 5 components of your submission including:
· Program Description- A detailed, clear description of the
program you are building.
· Analysis- Demonstrates your thought process and steps used to
analyze the problem. Be sure to include the required input and
output and how you will obtain the required output from the
given input? Also, include your variable names and definitions.
Be sure to describe the necessary formulas and sample
calculations that might be needed. You should talk about how
you determined your computer part prices.
· Test plan - Prepare at least 3 sets of input data (Test data)
along with their expected output for testing your program. Your
test data can be presented in the form of a table as follows
(note: feel free to adapt to your design)
· Flowchart – Provide a flowchart for your design. You can use
Word, Powerpoint, Visio or any software you have available
that will allow to draw shapes and connectors.
· Pseudocode- Provide pseudocode of your overall design that
fulfills the requirements of the project
All of these components should be placed in word document for
submission.
Additional details about the program you need to write:
1. You should research current prices of the computer parts on
Internet sites such as amazon.com or newegg.com.
2. You can assume a computer will consist of the following
components:
CPU
Case
Power supply
Motherboard
Hard Drive
3. RAM
DVD
Sound Card
Monitor
Graphics Card
Operating System
I would recommend you keep the option choices limited to 3
different components, or your program will really grow fast. For
example, you could provide options for the Operating System
(Windows 7, Windows 8 or Mac OS/X), the RAM (4 MB, 8 MB,
12 MB) and the Hard Drive Size (500 GB, 1 TB, 1.5 TB) and
leave everything else as a baseline. These are just examples. I
leave it up to you to determine which components you want the
user to select options. Be sure your prices are realistic.
1. There is much flexibility for this project. You should reach a
unique design. I recommend keeping it simple at first and then
add more user options if you have time.
Example application test data:
Test Case #
Input
Expected Output
1
Baseline Cost: $500
CPU Option 1 (2.2 GHz,$400)
Monitor Option 2 (Dell,$200)
RAM Option 1 (4 GB,$89)
(Total price would be $500 + cost of CPU+ cost of Monitor +
Cost of Ram)
Total Price = $1189
2
Your Computer selection options
Your output
3
Your Computer selection options
Your output
4. Submission requirements:
Your completed assignment should be saved as Word document
and submitted to your assignment area no later than the due date
listed in the syllabus. Your document should be neat, well-
written with minimal grammatical and spelling errors. Your
name should be clearly listed on the first page along with the
class/section, professor and due date. Your document should
contain page numbers at the bottom of each page. Single or
double space line formatting is acceptable.
(BA 3653 HW #1) (Page 1 of 5)
BA 3653: Assignment #1 (Due: Oct. 20, 2015)
I. General Instructions
1. Each group (or team) consists of 3~4 students (maximum 5
students)
enrolled in the same section. The right table shows the
deduction
percentage for other than 3~4 students in a group.
All the group members will get the same grade. You may use
“Discussions” to find your partners in
the Blackboard.
2. Please read carefully the syllabus to find the detailed
information about
group formation.
5. 3. Please refer to the right figure for the desirable cover page.
4. A late assignment will not be accepted in any excuse. The
answers for
assignment & quiz will be either posted on the D2L or handed
out in
the class. However, the answers for the case study will not be
posted.
Instead, it will be discussed in the class.
II. Questions [Total 100 points]
(Please use your educational guess for incomplete information.)
Q1 (10 points): For the Alton Bridge video
(https://youtu.be/YiDJeSFBtWI), answer the followings:
(a) [3] Draw the process diagram.
(b) [5] What kind of problems happened to delay the
construction? For each problem, describe how
many days delayed and how they solved it.
(c) [2] What were the reasons for successful or failed
operations? Find at least three reasons.
Q2 (12 points): Watch the BMW video
(http://youtu.be/o7XxmbvsfR0).
(a) [2] What would be the ultimate goal in their operation?
(b) [3] What do they provide to customers? Find at least five
benefits from the video. How do these
6. services relate to customers’ expectation (that is, explain them
with Price, Quality, Time &
Variety)?
(c) [3] Draw the flow (or process) chart for a car service (based
on the manager’s explanation).
(d) [2] What do they do to customers and technicians, if the
repair work is not satisfactory?
(e) [2] What would be the result from their excellent
operations?
Q3 (13 points): Read the case of CUSTOM MOLDS, INC. (see
page 4-5 in this document).
(a) [3] What are the major issues facing Tom and Mason Miller?
(b) [5] Identify the individual processes on a flow diagram.
What are the competitive priorities for
these processes and the changing nature of the industry?
(c) [5] What alternatives might the Millers pursue? What key
factors should they consider as they
evaluate these alternatives?
Q4 (10 points): Watch the King Soopers video
(http://youtu.be/nObVu-_Jfqg).
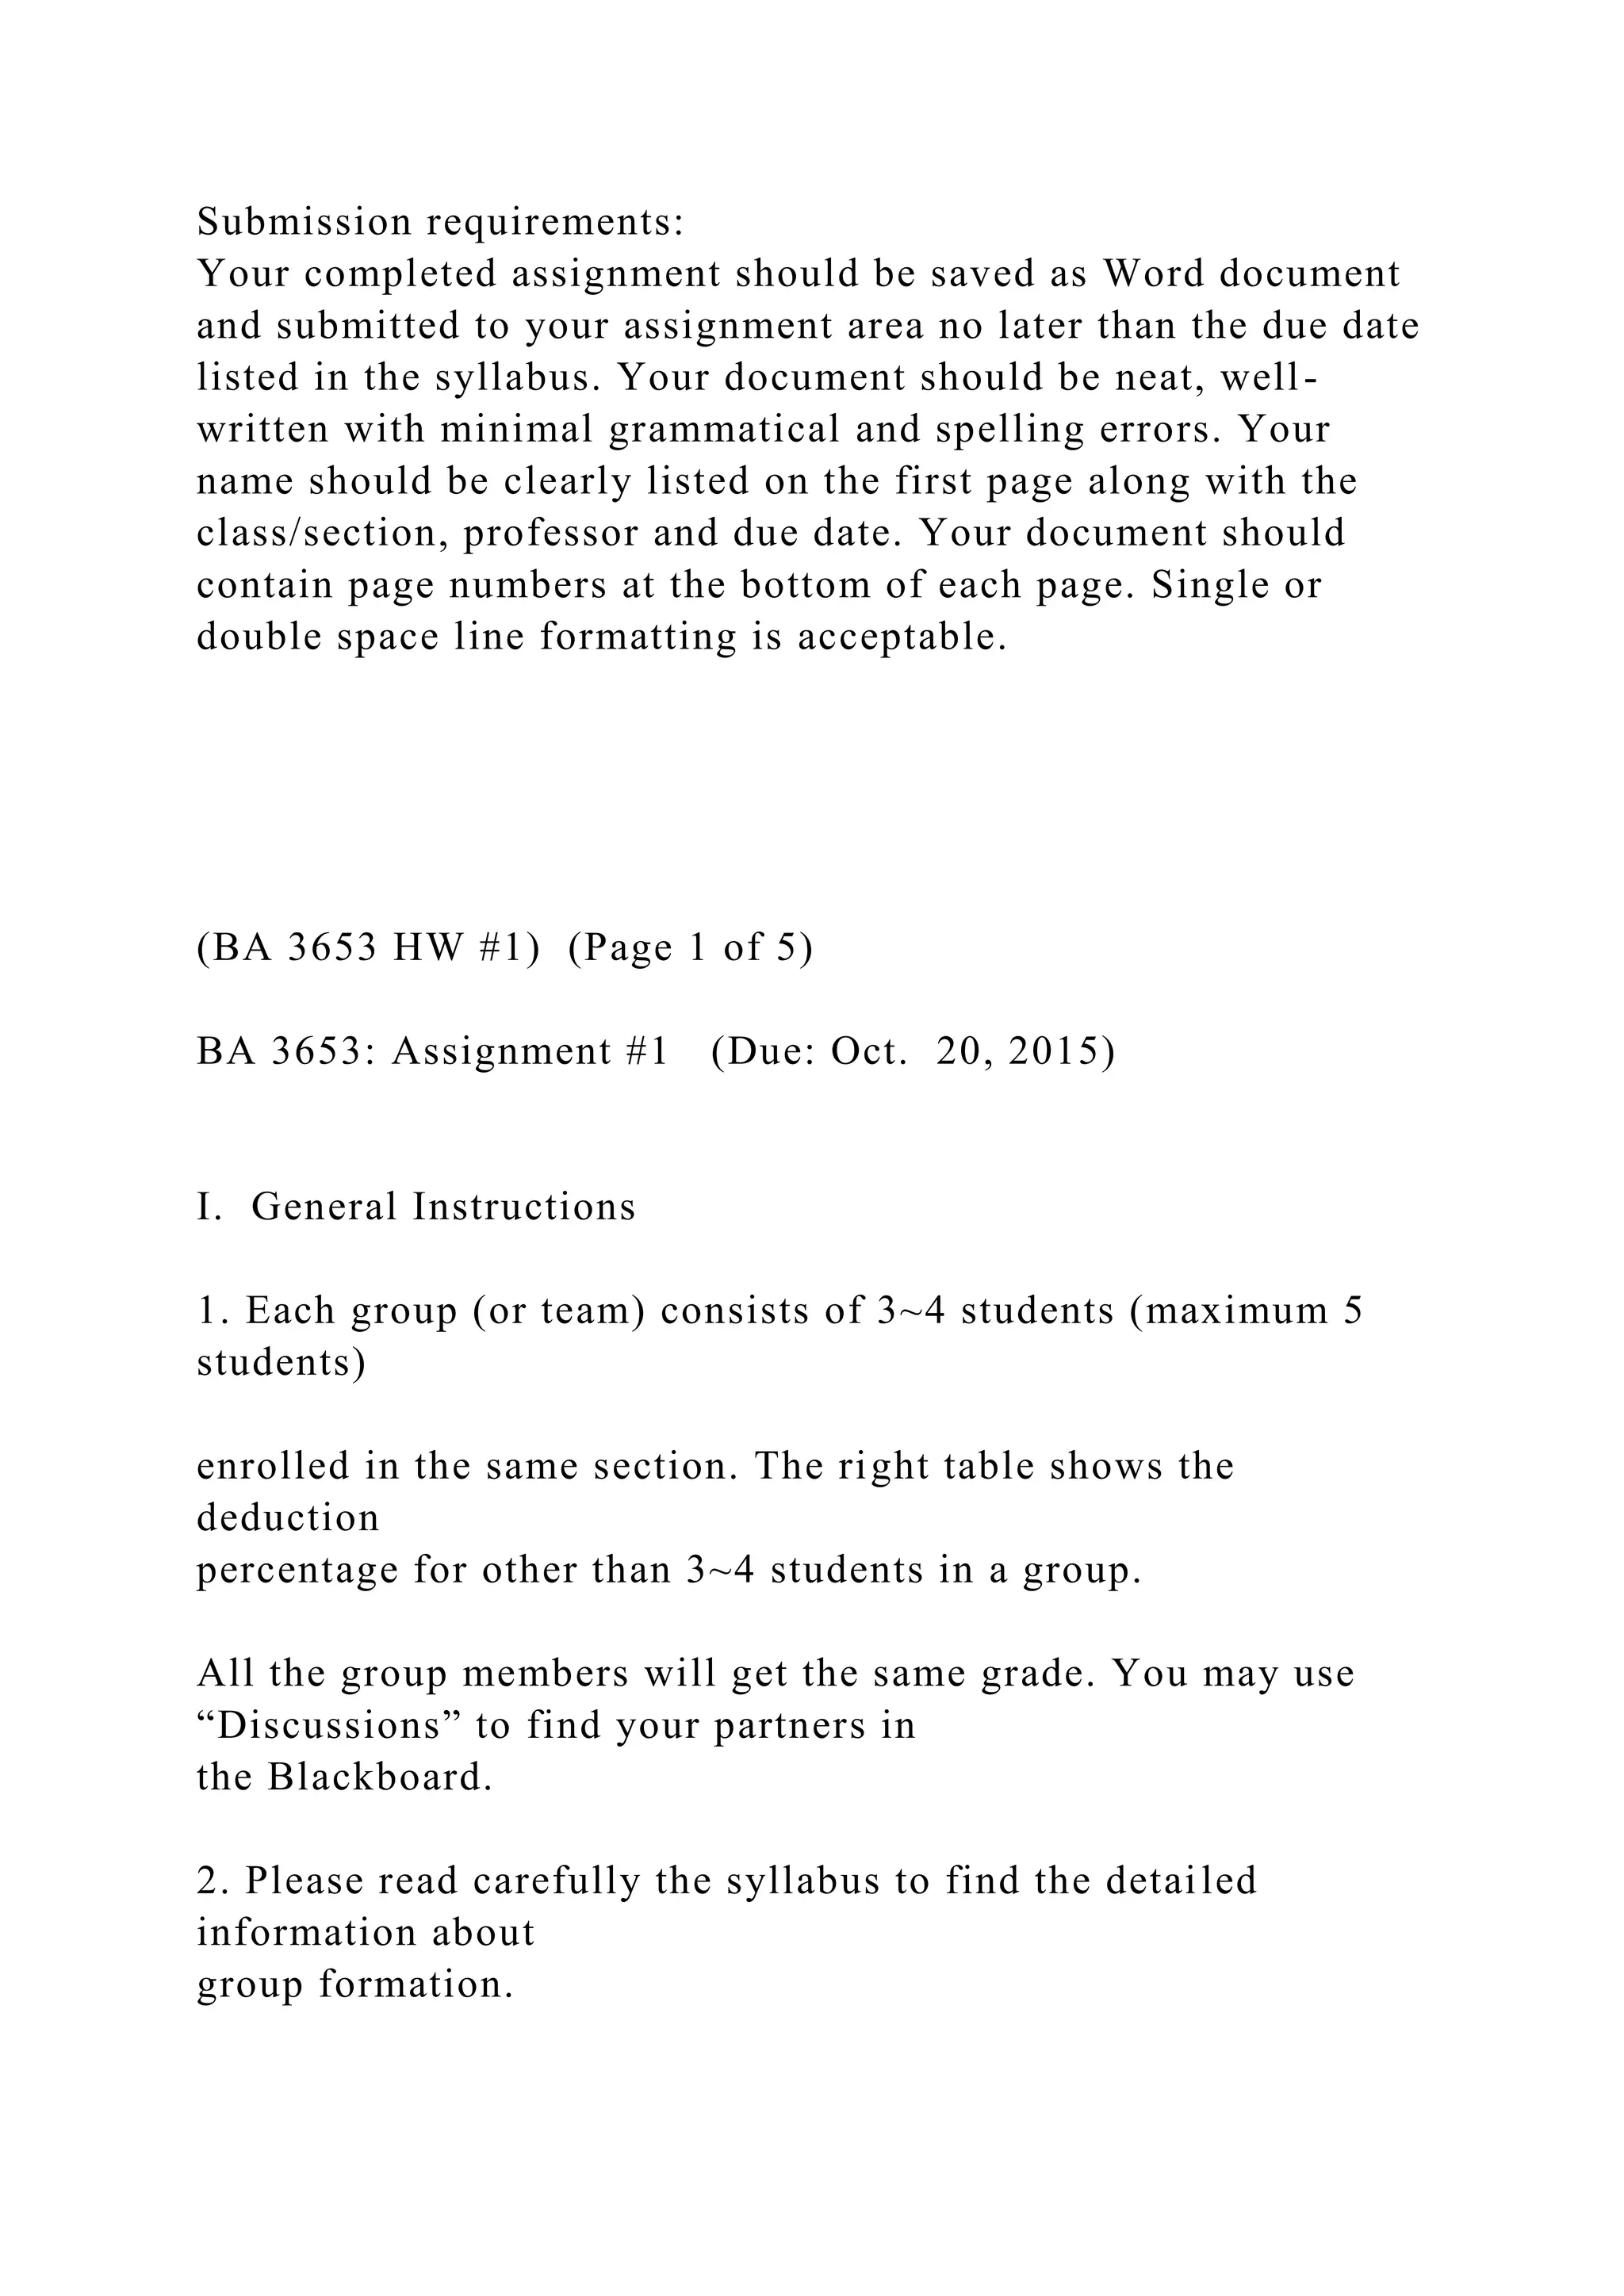
(a) [5] Fill up the blanks below.
# in group Deduction
7. 1 25 %
2 15 %
5 15%
BA3653: HW # 1 (Due: Oct. 20, 2015)
Alex Tender 321234 [email protected]
Chris Soft 332111 [email protected]
Troy Mania 214567 [email protected]
(Give 1” space here for grading)
Q1.
(a) …
(b) …
mailto:[email protected]
(BA 3653 HW #1) (Page 2 of 5)
Breads Pastry Line Custom decorated Cakes
Process
(by Classification 2)
Equipments
(describe in detail)
8. Easiness to changing
capacity
Skill level of workers
Variety of product
Capacity or volume
mentioned
(b) [3] Draw the process diagram (or flow chart) for Pastry
Line.
(c) [2] Why does King Soopers Bakery use three different
processes?
Q5 (20 points): The layout of a three-stage process consists of
three welding machines in parallel (W1, W2
and W3) at stage 1, a single drill machine (D1) at stage 2 and
two grind machines in parallel (G1 and G2) at
stage 3. The processing times are (where unit is minute): W1: 4,
W2: 6, W3: 6, D1: 2, G1: 3 and G2: 5.
Buffer B1 is between stages 1 and 2 and Buffer B2 is between
stages 2 and 3.
(a) [2] Draw a neat process flow diagram. (It should have the
input arrow and output arrow.)
(b) [2] What is the minimum MLT?
(c) [2] Calculate hourly capacities of each stage.
(d) [2] What is the overall capacity of the process?
(e) [6] Jobs are numbered 1, 2, 3, 4 and so on (at least draw 9
jobs). These jobs are released to W1,
W2 and W3, whenever it’s necessary. Plot a Gantt chart using
9. for you. (You may copy or cut & paste the diagram to your
answer).
4 W1 1 1 1 1
6 W2
6 W3
(B1)
2 D1 1 1
(B2)
3 G1 1 1 1
5 G2
0 2 4 6 8 10 12
14 16 18 20 22 24 26
Parts (f) to (i) are based on schedule described in the above
Gantt chart of part (e). Assume that the
system becomes stable after six jobs.
(f) [1] Say the finished time for Job 1 ~ 6.
(g) [1] From your Gantt chart, what will be the average MLT?
(h) [2] What are the contributions to WIP for resources?
(i) [2] Verify little’s formula.
Q6 (10 points):
(a) [4] Canada Revenue Agency completes 400 projects per
year, on average. In October 2015, it
was reported that the number of projects currently “on their
plate” (i.e. pending at various stages)
is 90. The Agency head claims that the average time to
complete a project is less than three
10. months. Is the estimate of average time to complete a project
realistic? Justify your answer.
(BA 3653 HW #1) (Page 3 of 5)
(b) [3] “Inventory Turnover” is defined as the number of times
that a company’s inventory cycles or
turns over per year. Suppose the inventory turnover for HP
Computer was 20 and the average
inventory of the company was $100 million (based on purchase
price). How much “annual” profit
would the company make if they make on an average 2 % profit
on each item sold?
(c) [3] A bank finds that the average number of people waiting
in queue during lunch hour is 15. On
average, during this period 3 people per minute leave the bank
after receiving service. How long
do people spend on average in the bank?
Q7 (25 points): Read the Shouldice Hospital in the “Course
materials”.
(a) [2] Describe its products or services.
(b) [4] Analyze all the costs incurred by customers and compare
them with other competitors in the
following table. Assume the value of time lost to employer
ranged between $50 ~ 300 per day.
11. (c) [3] Research about the profitability of the operations in
Shouldice. Let’s assume that they
performed 7,000 operations in 50 weeks in 1983. (If you use
some assumptions, please specify
them.) [Note: Use the following table.]
(d) [3] What are the competitive advantages in Shouldice? List
at least four competitive edges.
(e) [2] Why is the ratio of nurse to patient low, compared to
other hospitals? Find at least three
reasons.
(f) [3] Show your neat diagram for admission process before
arriving to the hospital.
(g) [3] Analyze Shouldice’s process on the quality factors. (on
slide #6 @ Topic 2)
(h) [5] What kinds of facilities do they have? For each facility,
show the capacity and utilization.
Let’s assume that they performed 7,000 operations in 50 weeks
in 1982. [Hint: Facilities are
exam room, admitting personnel, number of beds, … which
related to process the patients.]
Key Resources Capacity Utilization
1. Exam room 6 rooms * [60/17.5] patient/hr * 2 hrs/day
140/206 = 68%
<6>15~20min * 5 days/wk = 206 patients/wk
2. Admit. Proc.
…
12. …
Shouldice Other Hospitals
1. Cost of typical operation
2. Transportation
3. Value of time lost to employer
(at hospital & while recovering)
4. Subtotal before allowance for recurrence
5. Expected cost of recurrence
6. Total cost
Clinic Hospital
Revenue
Cost
Profit
(sample)
(BA 3653 HW #1) (Page 4 of 5)
[CUSTOM MOLDS, INC.]
Custom Molds, Inc., manufactures custom-designed
molds for plastic parts and produces custom-made plastic
connectors for the electronics industry. Located in Tucson,
Arizona, Custom Molds was founded by the father and son
team of Tom and Mason Miller in 1975. Tom Miller, a
mechanical engineer, had more than 20 years of experience
in the connector industry with AMP, Inc., a large
multinational producer of electronic connectors. Mason
13. Miller had graduated from the University of Arizona in
1974 with joint degrees in chemistry and chemical
engineering.
The company was originally formed to provide
manufacturers of electronic connectors with a source of
high quality, custom-designed molds for producing plastic
parts. The market consisted mainly of the product design
and development divisions of those manufacturers. Custom
Molds worked closely with each customer to design and
develop molds to be used in the customer’s product
development processes. Thus, virtually every mold had to
meet exacting standards and was somewhat unique. Orders
for multiple molds would arrive when customers moved
from the design and pilot-run stage of development to
large-scale production of newly designed parts.
As the years went by, Custom Molds’ reputation grew
as a designer and fabricator of precision molds. Building
on this reputation, the Millers decided to expand into the
limited manufacture of plastic parts. Ingredient-mixing
facilities and injection-molding equipment were added,
and by the mid-1980s Custom Molds developed its
reputation to include being a supplier of high-quality
plastic parts. Because of limited capacity, the company
concentrated its sales efforts on supplying parts that were
used in limited quantities for research and development
efforts and in preproduction pilot runs.
PRODUCTION PROCESSES
By 1985, operations at Custom Molds involved two
distinct processes: one for fabricating molds and one for
producing plastic parts. Although different, in many
instances these two processes were linked, as when a
14. customer would have Custom Molds both fabricate a mold
and produce the necessary parts to support the customer’s
R&D efforts. All fabrication and production operations
were housed in a single facility. The layout was
characteristic of a typical job shop, with like processes and
similar equipment grouped in various places in the plant.
Figure C2.1 shows a schematic of the plant floor. Multiple
pieces of various types of high-precision machinery,
including milling, turning, cutting, and drilling equipment,
were located in the mold-fabrication area.
Fabricating molds is a skill-oriented, craftsman-driven
process. When an order is received, a design team,
comprising a design engineer and one of 13 master
machinists, reviews the design specifications. Working
closely with the customer, the team establishes the final
specifications for the mold and gives them to the master
machinist for fabrication. It is always the same machinist
who was assigned to the design team. At the same time,
the purchasing department is given a copy of the design
specifications, from which it orders the appropriate raw
materials and special tooling. The time needed to receive
the ordered materials is usually three to four weeks. When
the materials are received for a particular mold, the plant
master scheduler reviews the workload of the assigned
master machinist and schedules the mold for fabrication.
Fabricating a mold takes from two to four weeks,
depending on the amount of work the machinist already
has scheduled. The fabrication process itself takes only
three to five days. Upon completion, the mold is sent to the
testing and inspection area, where it is used to produce a
small number of parts on one of the injection molding
machines. If the parts meet the design specifications
established by the design team, the mold is passed on to be
15. cleaned and polished. It is then packed and shipped to the
customer. One day is spent inspecting and testing the mold
and a second day cleaning, polishing, packing, and
shipping it to the customer. If the parts made by the mold
do not meet design specifications, the mold is returned to
the master machinist for retooling and the process starts
over. Currently, Custom Molds has a published lead time
of nine weeks for delivery of custom-fabricated molds.
Dock Dock
Receiving raw
materials
inventory
Lunch room Packing and shipping
finished goods
inventory Cut and trim
Dry mix Testing and inspection
Wet mix Injection machines
Assembly
Mold fabrication
Offices
FIGURE C2.1 • Plant Layout
The manufacturing process for plastic parts is
somewhat different from that for mold fabrication. An
order for parts may be received in conjunction with an
order for a mold to be fabricated. In instances where
Custom Molds has previously fabricated the mold and
16. maintains it in inventory, an order may be just for parts. If
the mold is already available, the order is reviewed by a
design engineer, who verifies the part and raw material
specifications. If the design engineer has any questions
concerning the specifications, the customer is contacted
and any revisions to specifications are mutually worked
out and agreed upon.
Upon acceptance of the part and raw material
specifications, raw material orders are placed and
(BA 3653 HW #1) (Page 5 of 5)
production is scheduled for the order. Chemicals and
compounds that support plastic-parts manufacturing are
typically ordered and received within one week. Upon
receipt, the compounds are first dry-mixed and blended to
achieve the correct composition. Then the mixture is wet-
mixed to the desired consistency (called slurry) for
injection into molding machines. When ready, the slurry is
transferred to the injection molding area by an overhead
pipeline and deposited in holding tanks adjacent to the
injection machines. The entire mixing process takes only
one day.
When the slurry is staged and ready, the proper molds
are secured—from inventory or from the clean and polish
operation if new molds were fabricated for the order—and
the parts are manufactured. Although different parts
require different temperature and pressure settings, the
time to produce a part is relatively constant. Custom Molds
has the capacity to produce 5,000 parts per day in the
injection-molding department; historically, however, the
lead time for handling orders in this department has
17. averaged one week. Upon completion of molding, the parts
are taken to the cut and trim operation, where they are
disconnected and leftover flashing is removed. After being
inspected, the parts may be taken to assembly or
transferred to the packing and shipping area for shipment
to the customer. If assembly of the final parts is not
required, the parts can be on their way to the customer two
days after being molded.
Sometimes the final product requires some assembly.
Typically, this entails attaching metal leads to plastic
connectors. If assembly is necessary, an additional three
days is needed before the order can be shipped. Custom
Molds is currently quoting a three-week lead time for parts
not requiring fabricated molds.
THE CHANGING ENVIRONMENT
In early 1991, Tom and Mason Miller began to realize
that the electronics industry they supplied, along with their
own business, was changing. Electronics manufacturers
had traditionally used vertical integration into component
parts manufacturing to reduce costs and ensure a timely
supply of parts. By the late 1980s, this trend had changed.
Manufacturers were developing strategic partnerships with
parts suppliers to ensure the timely delivery of high quality,
cost-effective parts. This approach allowed funds to be
diverted to other uses that could provide a larger return on
investment.
The impact on Custom Molds could be seen in sales
figures over the past three years. The sales mix was
changing. Although the number of orders per year for
mold fabrication remained virtually constant, orders for
multiple molds were declining, as shown in the following
table:
18. NUMBER OF ORDERS
ORDER Molds Molds Molds
SIZE 1988 1989 1990
1 80 74 72
2 60 70 75
3 40 51 55
4 5 6 5
5 3 5 4
6 4 8 5
7 2 0 1
8 10 6 4
9 11 8 5
10 15 10 5
Total orders 230 238 231
The reverse was true for plastic parts, for which the
number of orders per year had declined but for which the
order sizes were becoming larger, as illustrated in the
following table:
NUMBER OF ORDERS
ORDER Parts Parts Parts
SIZE 1988 1989 1990
50 100 93 70
100 70 72 65
150 40 30 35
200 36 34 38
250 25 27 25
19. 500 10 12 14
750 1 3 5
1,000 2 2 8
3,000 1 4 9
5,000 1 3 8
Total orders 286 280 277
During this same period Custom Molds began having
delivery problems. Customers were complaining that parts
orders were taking four to five weeks instead of the stated
three weeks and that the delays were disrupting production
schedules. When asked about the situation, the master
scheduler said that determining when a particular order
could be promised for delivery was very difficult.
Bottlenecks were occurring during the production process,
but where or when they would occur could not be
predicted. They always seemed to be moving from one
operation to another.
Tom Miller thought that he had excess labor capacity
in the mold-fabrication area. So, to help push through
those orders that were behind schedule, he assigned one of
the master machinists the job of identifying and expediting
those late orders. However, that tactic did not seem to help
much. Complaints about late deliveries were still being
received. To add to the problems, two orders had been
returned recently because of the number of defective parts.
The Millers knew that something had to be done. The
question was “What?”
(Source: This case was prepared by Dr. Brooke Saladin, Wake
Forest University, as a basis for classroom discussion.)
BA 3653: Assignment #1 (Due: Oct. 20, 2015)BA 3653 HW
#1 (