Download as PDF, PPTX


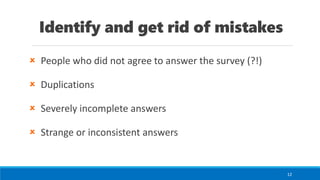
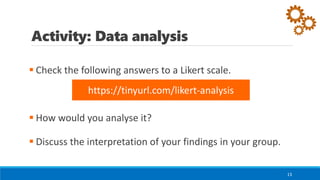


This document discusses quantitative research methods, including learning analytics data sources like grades, forum posts, resource clicks and video watch times. It covers questionnaires, Likert scales, developing accurate scales, advantages like ease of analysis, disadvantages like oversimplification. It recommends identifying and removing mistakes from survey responses like incomplete answers. Data analysis is discussed, like interpreting average results on a scale. Other tests mentioned are correlations, regressions, t-tests and ANOVA. Ensuring valid educational research is challenging given potential confounding variables from human diversity. Lab studies also have limitations.