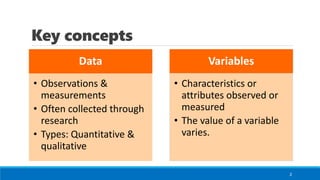
Key concepts
Data
• Observations&
measurements
• Often collected through
research
• Types: Quantitative &
qualitative
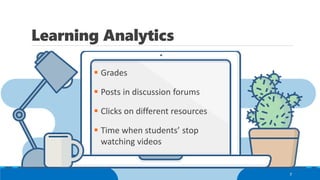
Variables
• Characteristics or
attributes observed or
measured
• The value of a variable
varies.
2
Activity: Likert Scale
▪Check the following Likert scale.
▪ How many errors can you find?
▪ Discuss them in your small group.
10
https://tinyurl.com/likert-oops
Identify and getrid of mistakes
People who did not agree to answer the survey (?!)
Duplications
Severely incomplete answers
Strange or inconsistent answers
16
17.
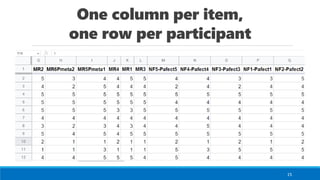
Activity: Data analysis
▪Check the following answers to a Likert scale.
▪ How would you analyse it?
▪ Discuss the interpretation of your findings in your group.
17
https://tinyurl.com/likert-analysis
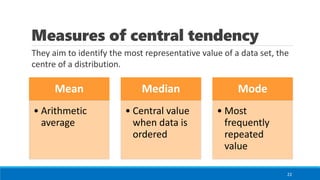
Measures of centraltendency
Mean
• Arithmetic
average
Median
• Central value
when data is
ordered
Mode
• Most
frequently
repeated
value
22
They aim to identify the most representative value of a data set, the
centre of a distribution.
23.
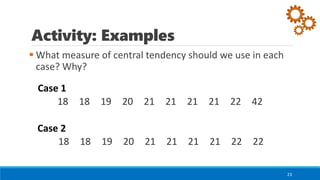
Activity: Examples
▪ Whatmeasure of central tendency should we use in each
case? Why?
23
18 18 19 20 21 21 21 21 22 42
18 18 19 20 21 21 21 21 22 22
Case 1
Case 2
24.
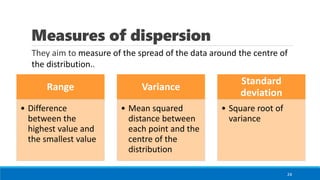
Measures of dispersion
Range
•Difference
between the
highest value and
the smallest value
Variance
• Mean squared
distance between
each point and the
centre of the
distribution
Standard
deviation
• Square root of
variance
24
They aim to measure of the spread of the data around the centre of
the distribution..