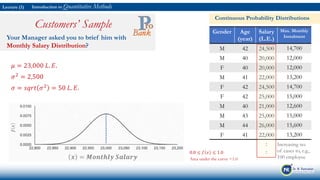
Quantitative Methods
Dr. Mohamed Ramadan
Moh_Ramadan@icloud.com
Quantitative Methods
Introduction to
Quantitative Methods
Lecture (1)
Lecture (1)
References
Introduction to Quantitative Methods
Key Reference:
Keller, Gerald (2012). Managerial Statistics (9th ed.). South Western, CENGAGE Learning.
Important Readings:
Brett Davies, M. (2007). Doing a Successful Research Project; Using Qualitative or Quantitative Methods.
Palgrave MacMillan.
Cresswell, J (2008). Research Design: Qualitative, Quantitative and Mixed Methods Approaches. Sage
Publications.
Silverman, D (2009). Doing Qualitative Research. Sage Publications.
Keller G. (2010). Managerial Statistics Abbreviated (8th ed.). International Edition, South Western College
Ghauri, P. and Gronhaugh, K. (2005). Research Methods in Business Studies: A Practical Guide. Pearson
Education Ltd.
Muhammad Ali
❝I hated every
minute of training,
but I said, Don’t
quit.
Suffer now and
live the rest of
your life as a
champion❞
Lecture (1)
Random Variables and Probability Distributions
Introduction to Quantitative Methods
Customers’ Sample
Suppose that you are working in the insurance
department at Pro-Bank ... Your manager asked you
to select a random sample from the VIP
customers, in the age group 40-45 years, whom are
working in company X, which is an about 10
customers. Moreover, he asked you to collect their
Age, Gender and Monthly Salary.
M
42 year
24,500
L.E.
M
40 year
20,000
L.E.
F
40 year
20,000
L.E.
M
41 year
22,000
L.E.
F
42 year
24,500
L.E.
F
42 year
25,000
L.E.
M
40 year
21,000
L.E.
M
43 year
25,000
L.E.
M
44 year
26,000
L.E.
F
41 year
22,000
L.E.
Gender Age (year) Salary (L.E.)
M 42 24,500
M 40 20,000
F 40 20,000
M 41 22,000
F 42 24,500
F 42 25,000
M 40 21,000
M 43 25,000
M 44 26,000
F 41 22,000
Variables
Lecture (1)
Random Variables and Probability Distributions
Customers’ Sample
Suppose that you are working in the insurance
department at Pro-Bank ... Your manager asked you
to select a random sample from the VIP
customers, in the age group 40-45 years, whom are
working in company X, which is an about 10
customers. Moreover, he asked you to collect their
Age, Gender and Monthly Salary.
M
42 year
24,500
L.E.
M
40 year
20,000
L.E.
F
40 year
20,000
L.E.
M
41 year
22,000
L.E.
F
42 year
24,500
L.E.
F
42 year
25,000
L.E.
M
40 year
21,000
L.E.
M
43 year
25,000
L.E.
M
44 year
26,000
L.E.
F
41 year
22,000
L.E.
What is a Random Variable?
❝is a function or rule
that assigns a value to
each outcome of an
experiment.❞
Introduction to Quantitative Methods
Lecture (1)
Random Variables and Probability Distributions
Customers’ Sample
Suppose that you are working in the insurance
department at Pro-Bank ... Your manager asked you
to select a random sample from the VIP
customers, in the age group 40-45 years, whom are
working in company X, which is an about 10
customers. Moreover, he asked you to collect their
Age, Gender and Monthly Salary.
M
42 year
24,500
L.E.
M
40 year
20,000
L.E.
F
40 year
20,000
L.E.
M
41 year
22,000
L.E.
F
42 year
24,500
L.E.
F
42 year
25,000
L.E.
M
40 year
21,000
L.E.
M
43 year
25,000
L.E.
M
44 year
26,000
L.E.
F
41 year
22,000
L.E.
Gender Age (year) Salary (L.E.) Max. Monthly
Instalment
M 42 24,500 14,700
M 40 20,000 12,000
F 40 20,000 12,000
M 41 22,000 13,200
F 42 24,500 14,700
F 42 25,000 15,000
M 40 21,000 12,600
M 43 25,000 15,000
M 44 26,000 15,600
F 41 22,000 13,200
Variables Max. Monthly Instalment
= 60% × Salary
Introduction to Quantitative Methods
Lecture (1)
Random Variables and Probability Distributions
Gender Age (year) Salary (L.E.) Max. Monthly
Instalment
M 42 24,500 14,700
M 40 20,000 12,000
F 40 20,000 12,000
M 41 22,000 13,200
F 42 24,500 14,700
F 42 25,000 15,000
M 40 21,000 12,600
M 43 25,000 15,000
M 44 26,000 15,600
F 41 22,000 13,200
Customers’ Sample
Your Manager asked you to brief him with age
distribution?
❝Discrete Random Variable is one that
can take on a countable number of
values.❞
❝Continuous Random Variable is one
which takes an infinite number of
possible values.❞
Introduction to Quantitative Methods
Lecture (1)
Random Variables and Probability Distributions
Gender Age (year) Salary (L.E.) Max. Monthly
Instalment
M 42 24,500 14,700
M 40 20,000 12,000
F 40 20,000 12,000
M 41 22,000 13,200
F 42 24,500 14,700
F 42 25,000 15,000
M 40 21,000 12,600
M 43 25,000 15,000
M 44 26,000 15,600
F 41 22,000 13,200
Customers’ Sample
Your Manager asked you to brief him with age
distribution?
Age
(year)
Frequency Distribution
40 3 3 ÷ 10= 0.3
41 2 2 ÷ 10= 0.2
42 3 3 ÷ 10= 0.3
43 1 1 ÷ 10= 0.1
44 1 1 ÷ 10= 0.1
Sum 10 1.0
0.0 ≤ 𝑃 𝑥 ≤ 1.0
'
!"" #
𝑃 𝑥 = 1.0
𝑥 𝑃 𝑥
Introduction to Quantitative Methods
Lecture (1)
Random Variables and Probability Distributions
Gender Age (year) Salary (L.E.) Max. Monthly
Instalment
M 42 24,500 14,700
M 40 20,000 12,000
F 40 20,000 12,000
M 41 22,000 13,200
F 42 24,500 14,700
F 42 25,000 15,000
M 40 21,000 12,600
M 43 25,000 15,000
M 44 26,000 15,600
F 41 22,000 13,200
Customers’ Sample
Your Manager asked you to brief him with age
distribution?
Age
𝒙
Frequency 𝑃 𝑥
40 3 0.3
41 2 0.2
42 3 0.3
43 1 0.1
44 1 0.1
Sum 10 1.0
Prob. of having customers less than 42
years old? 0.3 + 0.2 = 0.5
50%
Introduction to Quantitative Methods
Lecture (1)
Random Variables and Probability Distributions
Gender Age (year) Salary (L.E.) Max. Monthly
Instalment
M 42 24,500 14,700
M 40 20,000 12,000
F 40 20,000 12,000
M 41 22,000 13,200
F 42 24,500 14,700
F 42 25,000 15,000
M 40 21,000 12,600
M 43 25,000 15,000
M 44 26,000 15,600
F 41 22,000 13,200
Customers’ Sample
Your Manager asked you to brief him with age
distribution?
Age
𝒙
Frequency 𝑃 𝑥
40 3 0.3
41 2 0.2
42 3 0.3
43 1 0.1
44 1 0.1
Sum 10 1.0
Prob. of having customers by max. age of
42 years old? 0.3 + 0.2 + 0.3 = 0.8
80%
Introduction to Quantitative Methods
Lecture (1)
Random Variables and Probability Distributions
Gender Age (year) Salary (L.E.) Max. Monthly
Instalment
M 42 24,500 14,700
M 40 20,000 12,000
F 40 20,000 12,000
M 41 22,000 13,200
F 42 24,500 14,700
F 42 25,000 15,000
M 40 21,000 12,600
M 43 25,000 15,000
M 44 26,000 15,600
F 41 22,000 13,200
Customers’ Sample
Your Manager asked you to brief him with age
distribution?
Age
𝒙
Frequency 𝑃 𝑥
40 3 0.3
41 2 0.2
42 3 0.3
43 1 0.1
44 1 0.1
Sum 10 1.0
Prob. of having customers not less than 43
years old? 0.1 + 0.1 = 0.2
20%
Introduction to Quantitative Methods
Lecture (1)
Discrete Probability Distributions
Customers’ Sample
Your Manager asked you to brief him with Mean
and Variance of Age Distribution?
Age
𝒙
Frequency 𝑃 𝑥
40 3 0.3
41 2 0.2
42 3 0.3
43 1 0.1
44 1 0.1
Sum 10 1.0
𝜇 =
∑$%&
'
𝑥$
𝑁
= '
!"" #
𝑥𝑃 𝑥
𝜎( = '
!"" #
𝑥( 𝑃 𝑥 − 𝜇(
Population Mean:
Population Variance:
Introduction to Quantitative Methods
Lecture (1)
Customers’ Sample
Your Manager asked you to brief him with Mean
and Variance of Age Distribution?
Age
𝒙
Frequency 𝑃 𝑥 𝒙𝑃 𝑥 𝒙 𝟐 𝒙 𝟐 𝑃 𝑥
40 3 0.3 12 1600 480
41 2 0.2 8.2 1681 336.2
42 3 0.3 12.6 1764 529.2
43 1 0.1 4.3 1849 184.9
44 1 0.1 4.4 1936 193.6
Sum 10 1.0 41.5 8830 1723.9
𝜇 =
∑$%&
'
𝑥$
𝑁
= '
!"" #
𝑥𝑃 𝑥 = 41.5 𝑦𝑒𝑎𝑟𝑠
𝜎( = '
!"" #
𝑥( 𝑃 𝑥 − 𝜇( = 1723.9 − 41.5( = 1.7
Population Mean:
Population Variance:
1 2 3
4
5
Discrete Probability Distributions
Introduction to Quantitative Methods
𝜎 = 𝑠𝑞𝑟𝑡 𝜎( = 𝑠𝑞𝑟𝑡 1.7 = 1.3 𝑦𝑒𝑎𝑟𝑠
Lecture (1)
0.0 ≤ 𝑓 𝑥 ≤ 1.0
Increasing no.
of cases to, e.g.,
100 employee
Gender Age
(year)
Salary
(L.E.)
Max. Monthly
Instalment
M 42 24,500 14,700
M 40 20,000 12,000
F 40 20,000 12,000
M 41 22,000 13,200
F 42 24,500 14,700
F 42 25,000 15,000
M 40 21,000 12,600
M 43 25,000 15,000
M 44 26,000 15,600
F 41 22,000 13,200
:
:
Area under the curve =1.0
Continuous Probability Distributions
Customers’ Sample
Your Manager asked you to brief him with
Monthly Salary Distribution?
𝜇 = 23,000 𝐿. 𝐸.
𝜎( = 2,500
𝜎 = 𝑠𝑞𝑟𝑡 𝜎( = 50 𝐿. 𝐸.
𝒙 = 𝑴𝒐𝒏𝒕𝒉𝒍𝒚 𝑺𝒂𝒍𝒂𝒓𝒚
𝒇𝒙
Introduction to Quantitative Methods
Lecture (1)
Continuous Probability Distributions
Customers’ Sample
Your Manager asked you to brief him with the
following probabilities?
𝜇 = 23,000
𝜎( = 2,500
𝜎 = 𝑠𝑞𝑟𝑡 𝜎( = 50
Prob. of attracting employees with maximum
salaries of 23,100 L.E.?
𝑥~𝑁 𝜇, 𝜎 ⟹ 𝑧~𝑍(0,1)
𝒙 = 𝑴𝒐𝒏𝒕𝒉𝒍𝒚 𝑺𝒂𝒍𝒂𝒓𝒚
𝒇𝒙
𝑃 𝑥 < 23,100 = 𝑃
𝑥 − 𝜇
𝜎
<
23,100 − 23,000
50
= 𝑃 𝑧 < 2
𝑧 =
𝑥 − 𝜇
𝜎
1
Introduction to Quantitative Methods
Lecture (1)
𝒙 = 𝑴𝒐𝒏𝒕𝒉𝒍𝒚 𝑺𝒂𝒍𝒂𝒓𝒚
𝒇𝒙
𝒛
3
𝒇𝒛
2
𝑃 𝑥 < 23,100 = 𝑃 𝑧 < 2 = 0.5 + 0.4772
= 0.98
4
0.5 0.4772
Introduction to Quantitative Methods
Lecture (1)
Continuous Probability Distributions
Customers’ Sample
Your Manager asked you to brief him with the
following probabilities?
𝜇 = 23,000
𝜎( = 2,500
𝜎 = 𝑠𝑞𝑟𝑡 𝜎( = 50
Prob. of attracting employees with maximum
salaries of 22,950 L.E.?
𝑥~𝑁 𝜇, 𝜎 ⟹ 𝑧~𝑍(0,1)
𝒙 = 𝑴𝒐𝒏𝒕𝒉𝒍𝒚 𝑺𝒂𝒍𝒂𝒓𝒚
𝒇𝒙
𝑃 𝑥 < 22,950 = 𝑃
𝑥 − 𝜇
𝜎
<
22,950 − 23,000
50
= 𝑃 𝑧 < −1
𝑧 =
𝑥 − 𝜇
𝜎
1
Introduction to Quantitative Methods
𝒙 = 𝑴𝒐𝒏𝒕𝒉𝒍𝒚 𝑺𝒂𝒍𝒂𝒓𝒚
Lecture (1)
𝒇𝒙
𝒛
𝒇𝒛
2
3
0.5
0.3413
0.5 - 0.3413= 0.1587
4
Introduction to Quantitative Methods
Lecture (1)
𝒛
𝒇𝒛
2
3
0.5 - 0.3413= 0.1587
4
𝑃 𝑥 < 22,950 = 𝑃 𝑧 < −1 = 0.5 − 0.3413
= 0.1587 ≅ 0.16
5
0.5
0.3413
Introduction to Quantitative Methods
Frank Sinatra
❝Wake up
to reality❞

Quantitative Methods in Business - Lecture (1)

  • 1.
    Quantitative Methods Dr. MohamedRamadan Moh_Ramadan@icloud.com
  • 2.
  • 3.
    Lecture (1) References Introduction toQuantitative Methods Key Reference: Keller, Gerald (2012). Managerial Statistics (9th ed.). South Western, CENGAGE Learning. Important Readings: Brett Davies, M. (2007). Doing a Successful Research Project; Using Qualitative or Quantitative Methods. Palgrave MacMillan. Cresswell, J (2008). Research Design: Qualitative, Quantitative and Mixed Methods Approaches. Sage Publications. Silverman, D (2009). Doing Qualitative Research. Sage Publications. Keller G. (2010). Managerial Statistics Abbreviated (8th ed.). International Edition, South Western College Ghauri, P. and Gronhaugh, K. (2005). Research Methods in Business Studies: A Practical Guide. Pearson Education Ltd.
  • 4.
    Muhammad Ali ❝I hatedevery minute of training, but I said, Don’t quit. Suffer now and live the rest of your life as a champion❞
  • 5.
    Lecture (1) Random Variablesand Probability Distributions Introduction to Quantitative Methods Customers’ Sample Suppose that you are working in the insurance department at Pro-Bank ... Your manager asked you to select a random sample from the VIP customers, in the age group 40-45 years, whom are working in company X, which is an about 10 customers. Moreover, he asked you to collect their Age, Gender and Monthly Salary. M 42 year 24,500 L.E. M 40 year 20,000 L.E. F 40 year 20,000 L.E. M 41 year 22,000 L.E. F 42 year 24,500 L.E. F 42 year 25,000 L.E. M 40 year 21,000 L.E. M 43 year 25,000 L.E. M 44 year 26,000 L.E. F 41 year 22,000 L.E. Gender Age (year) Salary (L.E.) M 42 24,500 M 40 20,000 F 40 20,000 M 41 22,000 F 42 24,500 F 42 25,000 M 40 21,000 M 43 25,000 M 44 26,000 F 41 22,000 Variables
  • 6.
    Lecture (1) Random Variablesand Probability Distributions Customers’ Sample Suppose that you are working in the insurance department at Pro-Bank ... Your manager asked you to select a random sample from the VIP customers, in the age group 40-45 years, whom are working in company X, which is an about 10 customers. Moreover, he asked you to collect their Age, Gender and Monthly Salary. M 42 year 24,500 L.E. M 40 year 20,000 L.E. F 40 year 20,000 L.E. M 41 year 22,000 L.E. F 42 year 24,500 L.E. F 42 year 25,000 L.E. M 40 year 21,000 L.E. M 43 year 25,000 L.E. M 44 year 26,000 L.E. F 41 year 22,000 L.E. What is a Random Variable? ❝is a function or rule that assigns a value to each outcome of an experiment.❞ Introduction to Quantitative Methods
  • 7.
    Lecture (1) Random Variablesand Probability Distributions Customers’ Sample Suppose that you are working in the insurance department at Pro-Bank ... Your manager asked you to select a random sample from the VIP customers, in the age group 40-45 years, whom are working in company X, which is an about 10 customers. Moreover, he asked you to collect their Age, Gender and Monthly Salary. M 42 year 24,500 L.E. M 40 year 20,000 L.E. F 40 year 20,000 L.E. M 41 year 22,000 L.E. F 42 year 24,500 L.E. F 42 year 25,000 L.E. M 40 year 21,000 L.E. M 43 year 25,000 L.E. M 44 year 26,000 L.E. F 41 year 22,000 L.E. Gender Age (year) Salary (L.E.) Max. Monthly Instalment M 42 24,500 14,700 M 40 20,000 12,000 F 40 20,000 12,000 M 41 22,000 13,200 F 42 24,500 14,700 F 42 25,000 15,000 M 40 21,000 12,600 M 43 25,000 15,000 M 44 26,000 15,600 F 41 22,000 13,200 Variables Max. Monthly Instalment = 60% × Salary Introduction to Quantitative Methods
  • 8.
    Lecture (1) Random Variablesand Probability Distributions Gender Age (year) Salary (L.E.) Max. Monthly Instalment M 42 24,500 14,700 M 40 20,000 12,000 F 40 20,000 12,000 M 41 22,000 13,200 F 42 24,500 14,700 F 42 25,000 15,000 M 40 21,000 12,600 M 43 25,000 15,000 M 44 26,000 15,600 F 41 22,000 13,200 Customers’ Sample Your Manager asked you to brief him with age distribution? ❝Discrete Random Variable is one that can take on a countable number of values.❞ ❝Continuous Random Variable is one which takes an infinite number of possible values.❞ Introduction to Quantitative Methods
  • 9.
    Lecture (1) Random Variablesand Probability Distributions Gender Age (year) Salary (L.E.) Max. Monthly Instalment M 42 24,500 14,700 M 40 20,000 12,000 F 40 20,000 12,000 M 41 22,000 13,200 F 42 24,500 14,700 F 42 25,000 15,000 M 40 21,000 12,600 M 43 25,000 15,000 M 44 26,000 15,600 F 41 22,000 13,200 Customers’ Sample Your Manager asked you to brief him with age distribution? Age (year) Frequency Distribution 40 3 3 ÷ 10= 0.3 41 2 2 ÷ 10= 0.2 42 3 3 ÷ 10= 0.3 43 1 1 ÷ 10= 0.1 44 1 1 ÷ 10= 0.1 Sum 10 1.0 0.0 ≤ 𝑃 𝑥 ≤ 1.0 ' !"" # 𝑃 𝑥 = 1.0 𝑥 𝑃 𝑥 Introduction to Quantitative Methods
  • 10.
    Lecture (1) Random Variablesand Probability Distributions Gender Age (year) Salary (L.E.) Max. Monthly Instalment M 42 24,500 14,700 M 40 20,000 12,000 F 40 20,000 12,000 M 41 22,000 13,200 F 42 24,500 14,700 F 42 25,000 15,000 M 40 21,000 12,600 M 43 25,000 15,000 M 44 26,000 15,600 F 41 22,000 13,200 Customers’ Sample Your Manager asked you to brief him with age distribution? Age 𝒙 Frequency 𝑃 𝑥 40 3 0.3 41 2 0.2 42 3 0.3 43 1 0.1 44 1 0.1 Sum 10 1.0 Prob. of having customers less than 42 years old? 0.3 + 0.2 = 0.5 50% Introduction to Quantitative Methods
  • 11.
    Lecture (1) Random Variablesand Probability Distributions Gender Age (year) Salary (L.E.) Max. Monthly Instalment M 42 24,500 14,700 M 40 20,000 12,000 F 40 20,000 12,000 M 41 22,000 13,200 F 42 24,500 14,700 F 42 25,000 15,000 M 40 21,000 12,600 M 43 25,000 15,000 M 44 26,000 15,600 F 41 22,000 13,200 Customers’ Sample Your Manager asked you to brief him with age distribution? Age 𝒙 Frequency 𝑃 𝑥 40 3 0.3 41 2 0.2 42 3 0.3 43 1 0.1 44 1 0.1 Sum 10 1.0 Prob. of having customers by max. age of 42 years old? 0.3 + 0.2 + 0.3 = 0.8 80% Introduction to Quantitative Methods
  • 12.
    Lecture (1) Random Variablesand Probability Distributions Gender Age (year) Salary (L.E.) Max. Monthly Instalment M 42 24,500 14,700 M 40 20,000 12,000 F 40 20,000 12,000 M 41 22,000 13,200 F 42 24,500 14,700 F 42 25,000 15,000 M 40 21,000 12,600 M 43 25,000 15,000 M 44 26,000 15,600 F 41 22,000 13,200 Customers’ Sample Your Manager asked you to brief him with age distribution? Age 𝒙 Frequency 𝑃 𝑥 40 3 0.3 41 2 0.2 42 3 0.3 43 1 0.1 44 1 0.1 Sum 10 1.0 Prob. of having customers not less than 43 years old? 0.1 + 0.1 = 0.2 20% Introduction to Quantitative Methods
  • 13.
    Lecture (1) Discrete ProbabilityDistributions Customers’ Sample Your Manager asked you to brief him with Mean and Variance of Age Distribution? Age 𝒙 Frequency 𝑃 𝑥 40 3 0.3 41 2 0.2 42 3 0.3 43 1 0.1 44 1 0.1 Sum 10 1.0 𝜇 = ∑$%& ' 𝑥$ 𝑁 = ' !"" # 𝑥𝑃 𝑥 𝜎( = ' !"" # 𝑥( 𝑃 𝑥 − 𝜇( Population Mean: Population Variance: Introduction to Quantitative Methods
  • 14.
    Lecture (1) Customers’ Sample YourManager asked you to brief him with Mean and Variance of Age Distribution? Age 𝒙 Frequency 𝑃 𝑥 𝒙𝑃 𝑥 𝒙 𝟐 𝒙 𝟐 𝑃 𝑥 40 3 0.3 12 1600 480 41 2 0.2 8.2 1681 336.2 42 3 0.3 12.6 1764 529.2 43 1 0.1 4.3 1849 184.9 44 1 0.1 4.4 1936 193.6 Sum 10 1.0 41.5 8830 1723.9 𝜇 = ∑$%& ' 𝑥$ 𝑁 = ' !"" # 𝑥𝑃 𝑥 = 41.5 𝑦𝑒𝑎𝑟𝑠 𝜎( = ' !"" # 𝑥( 𝑃 𝑥 − 𝜇( = 1723.9 − 41.5( = 1.7 Population Mean: Population Variance: 1 2 3 4 5 Discrete Probability Distributions Introduction to Quantitative Methods 𝜎 = 𝑠𝑞𝑟𝑡 𝜎( = 𝑠𝑞𝑟𝑡 1.7 = 1.3 𝑦𝑒𝑎𝑟𝑠
  • 15.
    Lecture (1) 0.0 ≤𝑓 𝑥 ≤ 1.0 Increasing no. of cases to, e.g., 100 employee Gender Age (year) Salary (L.E.) Max. Monthly Instalment M 42 24,500 14,700 M 40 20,000 12,000 F 40 20,000 12,000 M 41 22,000 13,200 F 42 24,500 14,700 F 42 25,000 15,000 M 40 21,000 12,600 M 43 25,000 15,000 M 44 26,000 15,600 F 41 22,000 13,200 : : Area under the curve =1.0 Continuous Probability Distributions Customers’ Sample Your Manager asked you to brief him with Monthly Salary Distribution? 𝜇 = 23,000 𝐿. 𝐸. 𝜎( = 2,500 𝜎 = 𝑠𝑞𝑟𝑡 𝜎( = 50 𝐿. 𝐸. 𝒙 = 𝑴𝒐𝒏𝒕𝒉𝒍𝒚 𝑺𝒂𝒍𝒂𝒓𝒚 𝒇𝒙 Introduction to Quantitative Methods
  • 16.
    Lecture (1) Continuous ProbabilityDistributions Customers’ Sample Your Manager asked you to brief him with the following probabilities? 𝜇 = 23,000 𝜎( = 2,500 𝜎 = 𝑠𝑞𝑟𝑡 𝜎( = 50 Prob. of attracting employees with maximum salaries of 23,100 L.E.? 𝑥~𝑁 𝜇, 𝜎 ⟹ 𝑧~𝑍(0,1) 𝒙 = 𝑴𝒐𝒏𝒕𝒉𝒍𝒚 𝑺𝒂𝒍𝒂𝒓𝒚 𝒇𝒙 𝑃 𝑥 < 23,100 = 𝑃 𝑥 − 𝜇 𝜎 < 23,100 − 23,000 50 = 𝑃 𝑧 < 2 𝑧 = 𝑥 − 𝜇 𝜎 1 Introduction to Quantitative Methods
  • 17.
    Lecture (1) 𝒙 =𝑴𝒐𝒏𝒕𝒉𝒍𝒚 𝑺𝒂𝒍𝒂𝒓𝒚 𝒇𝒙 𝒛 3 𝒇𝒛 2 𝑃 𝑥 < 23,100 = 𝑃 𝑧 < 2 = 0.5 + 0.4772 = 0.98 4 0.5 0.4772 Introduction to Quantitative Methods
  • 18.
    Lecture (1) Continuous ProbabilityDistributions Customers’ Sample Your Manager asked you to brief him with the following probabilities? 𝜇 = 23,000 𝜎( = 2,500 𝜎 = 𝑠𝑞𝑟𝑡 𝜎( = 50 Prob. of attracting employees with maximum salaries of 22,950 L.E.? 𝑥~𝑁 𝜇, 𝜎 ⟹ 𝑧~𝑍(0,1) 𝒙 = 𝑴𝒐𝒏𝒕𝒉𝒍𝒚 𝑺𝒂𝒍𝒂𝒓𝒚 𝒇𝒙 𝑃 𝑥 < 22,950 = 𝑃 𝑥 − 𝜇 𝜎 < 22,950 − 23,000 50 = 𝑃 𝑧 < −1 𝑧 = 𝑥 − 𝜇 𝜎 1 Introduction to Quantitative Methods
  • 19.
    𝒙 = 𝑴𝒐𝒏𝒕𝒉𝒍𝒚𝑺𝒂𝒍𝒂𝒓𝒚 Lecture (1) 𝒇𝒙 𝒛 𝒇𝒛 2 3 0.5 0.3413 0.5 - 0.3413= 0.1587 4 Introduction to Quantitative Methods
  • 20.
    Lecture (1) 𝒛 𝒇𝒛 2 3 0.5 -0.3413= 0.1587 4 𝑃 𝑥 < 22,950 = 𝑃 𝑧 < −1 = 0.5 − 0.3413 = 0.1587 ≅ 0.16 5 0.5 0.3413 Introduction to Quantitative Methods
  • 21.