This document contains 10 problems related to analyzing data sets and calculating statistical measures such as measures of central tendency, measures of dispersion, percentiles, probabilities, and confidence intervals. It provides data for hearing test results, amusement park wait times, life expectancies, credit balances, grades, and computing resource usage. It asks the reader to calculate mean, median, mode, range, standard deviation, variance, percentiles, probabilities, and confidence intervals. It also provides information on sampling, normal distributions, and binomial distributions to solve probability problems.

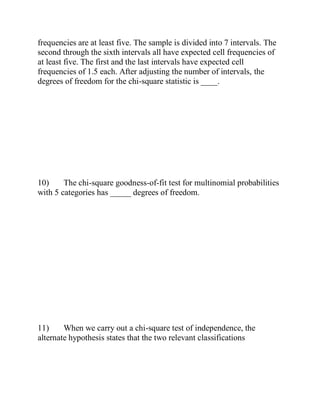
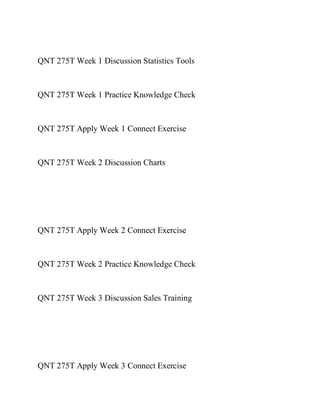
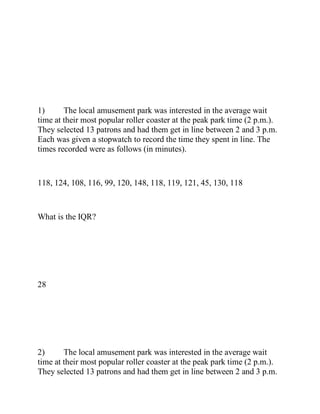
![3. The probability that an appliance is currently being repaired is .5.
If an apartment complex has 100 such appliances, what is the probability
that at least 60 are currently being repaired? Use the normal
approximation to the binomial.
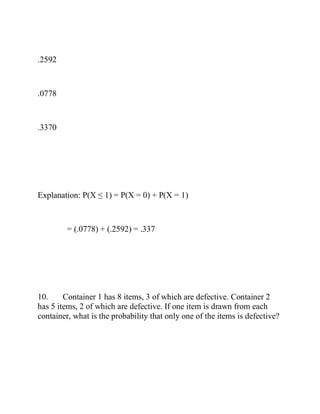
.5000
.0287
.6000
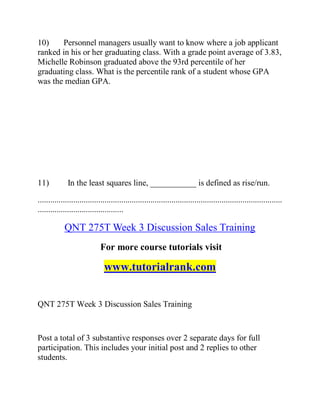
.9713
Explanation: z = (59.5 − (.5) (100)/√[(.5)(.5)(100)] = 1.9
P (z ≥ 1.9) = 1 − 0.9713 = 0.0287](https://image.slidesharecdn.com/qnt275textraordinarysuccess-210129103740/85/QNT-275T-Education-Specialist-tutorialrank-com-32-320.jpg)


![Prac excises 3[1].5](https://cdn.slidesharecdn.com/ss_thumbnails/pracexcises31-150331131154-conversion-gate01-thumbnail.jpg?width=640&height=640&fit=bounds)


