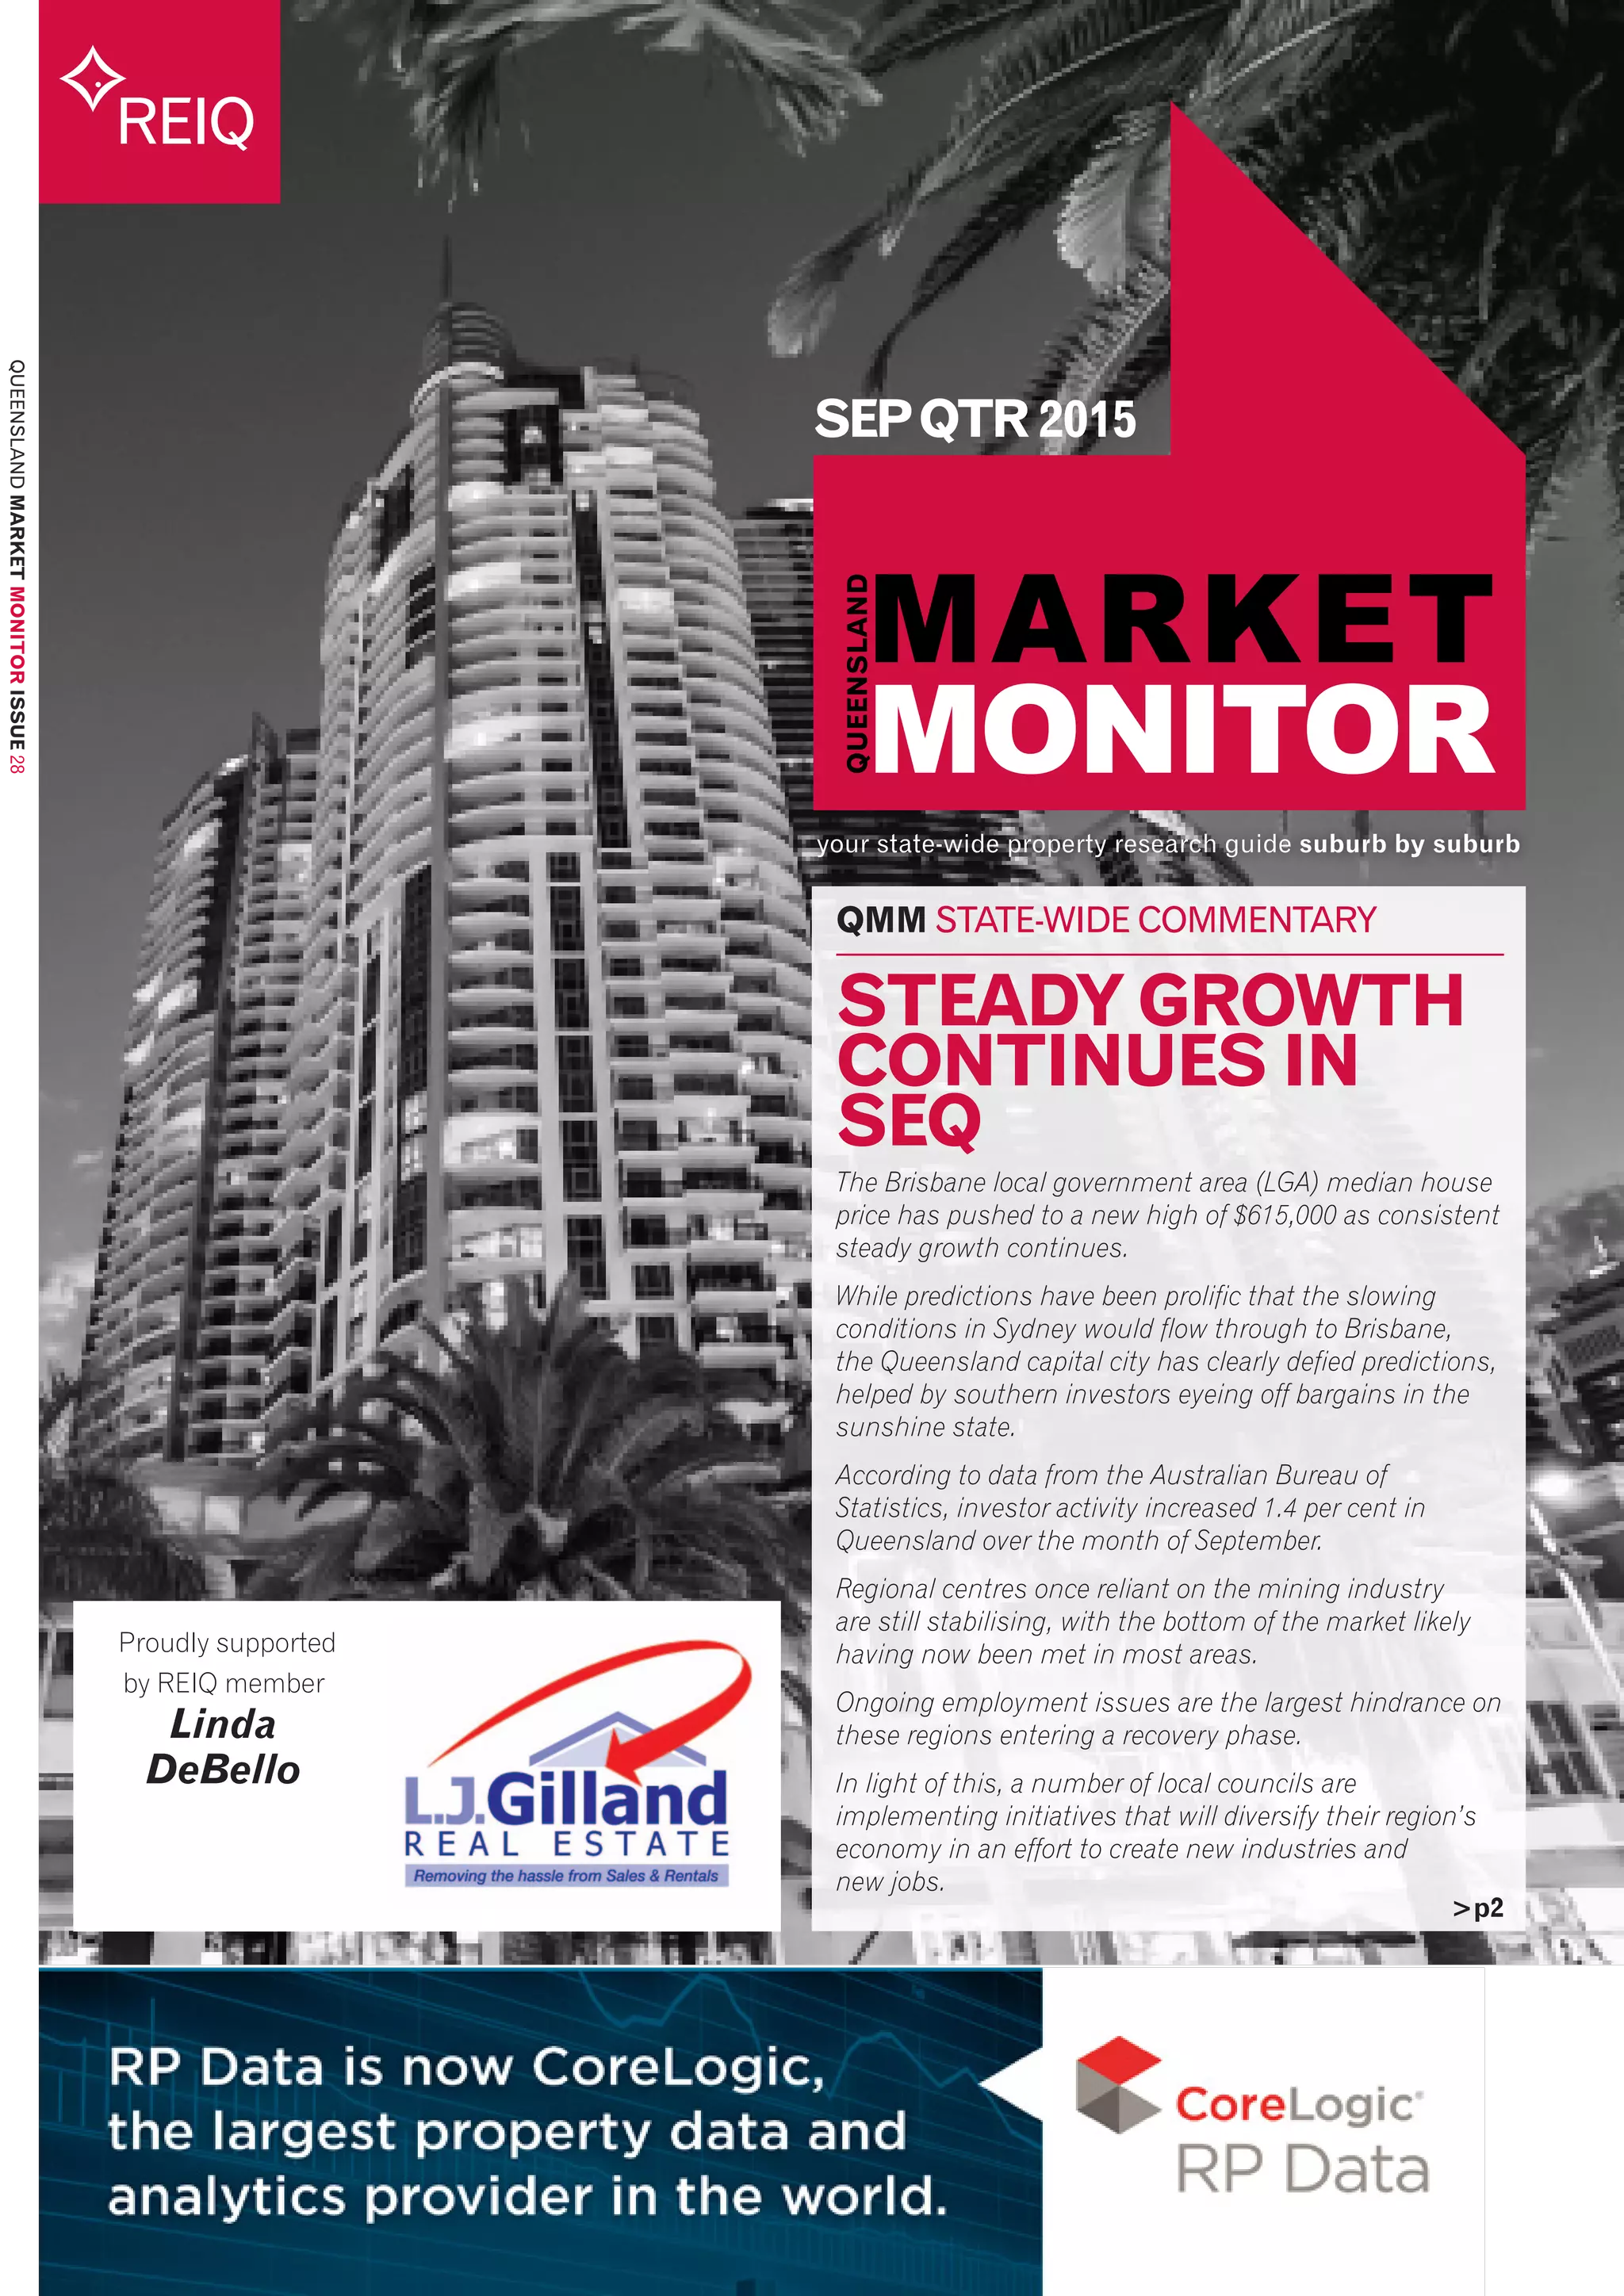
The document summarizes real estate market conditions across various regions in Queensland, Australia for the September 2015 quarter. Some key points:
- The Brisbane housing market continued steady growth, with the median house price reaching a new high of $615,000 and sales up 5%. Nearby regions like Ipswich and Moreton Bay also saw rising prices and increased sales.
- Tourism-focused markets like the Gold Coast and Cairns improved, with the Gold Coast seeing the highest quarterly price rise and Cairns reaching a new median of $400,000. Toowoomba sales rebounded after slowing earlier in the year.
- Regional centers like Mackay, Rockhampton and Townsville saw relatively stable

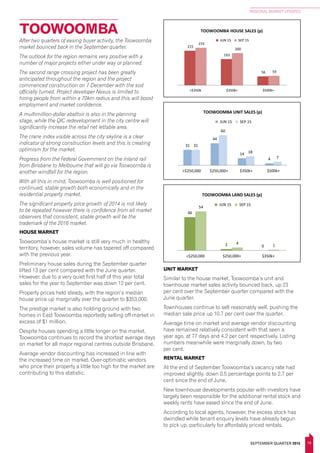
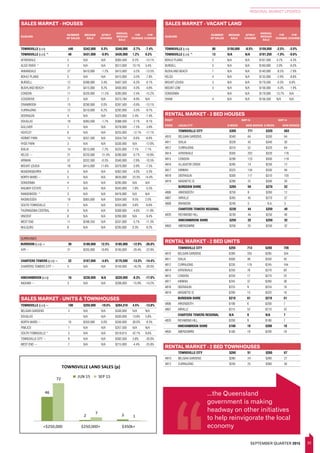
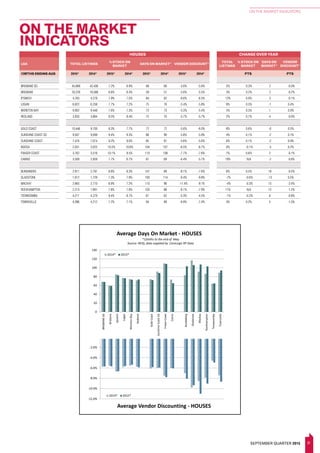
![39SEPTEMBER QUARTER 2015
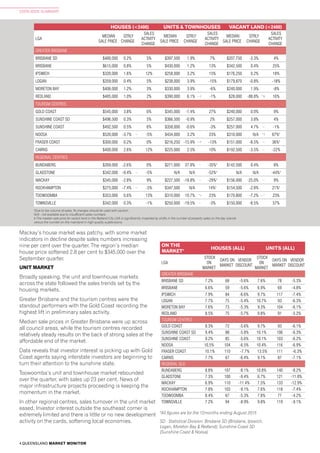
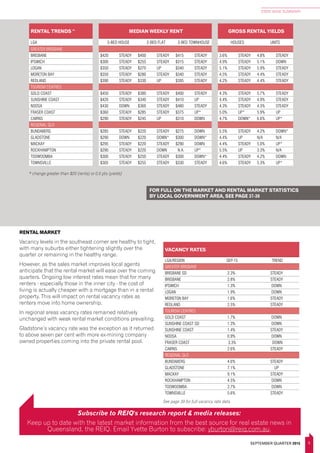
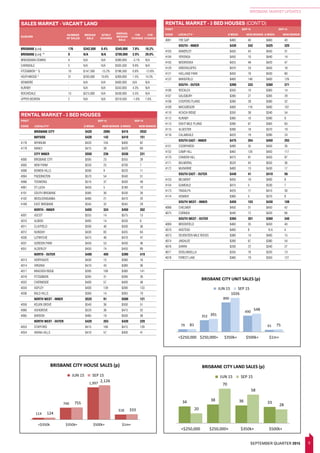
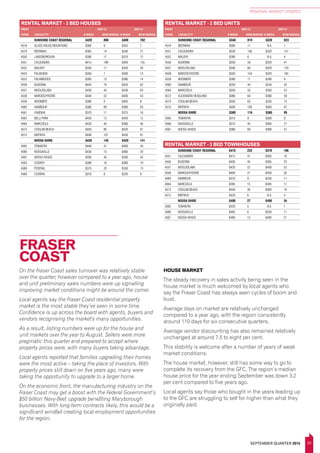
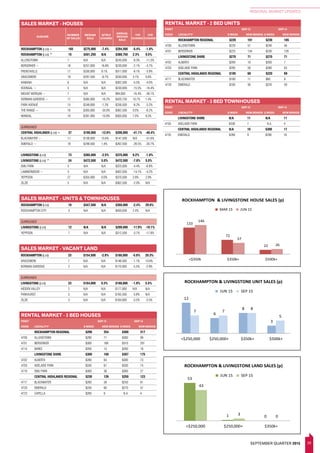
RENTAL MARKET INDICATORS
RENTAL MARKET INDICATORS
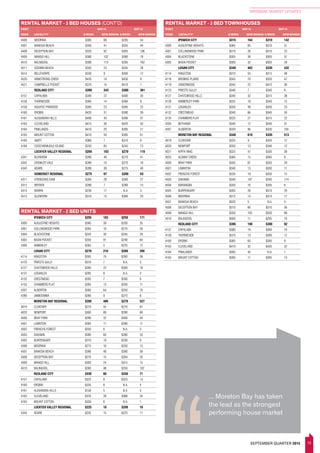
RESIDENTIAL VACANCY RATES
AS AT END OF: SEP-15 JUN-15 CHANGE TREND STATUS
GREATER BRISBANE % PTS
BRISBANE SD 2.3% 2.4% -0.1 sTEADY tIGHT
BRISBANE 2.8% 2.7% 0.1 sTEADY HEALTHY
BRISBANE INNER (0-5KM) 3.3% 3.0% 0.3 UP HEALTHY
BRISBANE BAL (5-20KM) 2.4% 2.4% 0.0 sTEADY tIGHT
BRISBANE SURROUNDS 1.7% 2.1% -0.4 DOWN tIGHT
IPSWICH 1.3% 2.8% -1.5 DOWN tIGHT
LOGAN 1.9% 2.8% -0.9 DOWN tIGHT
MORETON BAY 1.6% 1.4% 0.3 sTEADY tIGHT
CABOOLTURE 1.6% 1.0% 0.6 UP tIGHT
PINE RIVERS 1.3% 1.6% -0.3 DOWN tIGHT
REDCLIFFE 2.0% 1.8% 0.2 sTEADY tIGHT
REDLAND 2.5% 2.3% 0.2 sTEADY HEALTHY
MAINLAND 2.6% 2.2% 0.4 UP HEALTHY
BAY ISLANDS 2.3% 3.8% -1.6 DOWN tIGHT
TOURISM CENTRES
GOLD COAST 1.7% 2.3% -0.6 DOWN tIGHT
SUNSHINE COAST SD 1.3% 1.6% -0.4 DOWN tIGHT
SUNSHINE COAST 1.4% 1.5% -0.2 sTEADY tIGHT
CALOUNDRA COAST 0.9% 1.2% -0.2 sTEADY tIGHT
MAROOCHY COAST 1.6% 1.2% 0.3 UP tIGHT
HINTERLAND* 1.5% 2.3% -0.9 DOWN tIGHT
NOOSA 0.9% 2.2% -1.2 DOWN tIGHT
FRASER COAST 3.3% 3.8% -0.4 DOWN HEALTHY
HERVEY BAY 3.3% 2.8% 0.5 UP HEALTHY
MARYBOROUGH 3.4% 4.6% -1.2 DOWN HEALTHY
CAIRNS 2.6% 2.7% -0.1 sTEADY HEALTHY
MAJOR REGIONAL CENTRES
BUNDABERG 4.6% 4.6% -0.1 sTEADY WEAK
GLADSTONE 7.1% 5.2% 1.9 UP WEAK
MACKAY 9.1% 9.1% 0.0 sTEADY WEAK
ROCKHAMPTON 4.5% 6.0% -1.4 DOWN WEAK
TOOWOOMBA 2.7% 3.1% -0.5 DOWN HEALTHY
TOWNSVILLE 5.6% 5.3% 0.2 sTEADY WEAK
OTHER REGIONAL AREAS
BURDEKIN 6.0% 5.6% 0.4 UP WEAK
CASSOWARY COAST 8.2% N/A N/A N/A WEAK
GYMPIE 1.2% 2.1% -0.8 DOWN tIGHT
ISAAC 12.5% 12.5% 0.1 sTEADY WEAK
LIVINGSTONE 7.4% N/A N/A N/A WEAK
LOCKYER VALLEY 2.8% 2.7% 0.2 sTEADY HEALTHY
MARANOA 14.5% N/A N/A N/A WEAK
MOUNT ISA 6.3% 7.4% -1.1 DOWN WEAK
MURWEH 14.5% 11.1% 3.4 UP WEAK
SOMERSET 3.7% N/A N/A N/A WEAK
SOUTH BURNETT 3.4% N/A N/A N/A HEALTHY
SOUTHERN DOWNS 3.5% 5.6% -2.0 DOWN WEAK
TABLELANDS 4.7% 4.2% 0.6 UP WEAK
WHITSUNDAY 10.7% 10.5% 0.2 sTEADY WEAK
GROSS YIELDS HOUSES UNITS
QUARTER: SEP-15 JUN-15 SEP-15 JUN-15
GREATER BRISBANE
BRISBANE 3.6% 3.6% 4.8% 4.9%
IPSWICH 4.9% 5.0% 5.1% 5.4%
LOGAN 5.1% 5.0% 5.9% 5.9%
MORETON BAY 4.5% 4.5% 4.4% 4.6%
REDLAND 4.2% 4.3% 4.4% 4.5%
TOURISM CENTRES
GOLD COAST 4.3% 4.5% 5.7% 5.6%
SUNSHINE COAST 4.4% 4.5% 4.9% 4.9%
NOOSA 4.3% 4.2% 4.3% 4.5%
FRASER COAST 5.0% 3.8% 5.9% 5.6%
CAIRNS 4.7% 6.2% 6.6% 5.8%
MAJOR REGIONAL CENTRES
BUNDABERG 5.5% 5.4% 4.2% 5.5%
GLADSTONE 4.4% 4.1% N/A 5.0%
MACKAY 4.4% 4.4% 5.0% 4.2%
ROCKHAMPTON 5.5% 5.1% 3.3% N/A
TOOWOOMBA 4.4% 4.4% 4.2% 4.6%
TOWNSVILLE 4.6% 4.7% 5.3% 4.2%
OTHER REGIONAL AREAS
BURDEKIN 7.7% 8.1% N/A N/A
CASSOWARY COAST 6.6% 6.4% N/A N/A
CENTRAL HIGHLANDS 6.3% 5.3% N/A N/A
CHARTERS TOWERS 7.2% 8.3% N/A N/A
DOUGLAS 4.1% 4.4% 8.0% 6.8%
GOONDIWINDI 7.5% 6.6% N/A N/A
GYMPIE 5.0% 5.0% N/A N/A
HINCHINBROOK 5.7% N/A N/A N/A
ISAAC 6.0% 6.3% N/A N/A
LIVINGSTONE 4.3% 4.3% N/A 5.3%
LOCKYER VALLEY 5.8% 6.4% N/A N/A
MAREEBA 7.0% 6.5% N/A N/A
MOUNT ISA 6.2% 6.8% N/A N/A
SCENIC RIM 4.3% 5.0% N/A 4.2%
SOMERSET 6.0% 5.6% N/A N/A
SOUTH BURNETT 6.9% 6.5% N/A N/A
SOUTHERN DOWNS 5.3% 5.8% N/A N/A
TABLELANDS 4.7% 4.9% N/A N/A
WESTERN DOWNS 4.8% 5.3% N/A N/A
WHITSUNDAY 4.4% 3.8% 4.7% 5.5%
WESTERN DOWNS 5.3% 4.7% N/A N/A
WHITSUNDAY 3.8% 3.9% 5.5% 4.6%
Queensland Market Monitor is published by
The Real Estate Institute of Queensland (REIQ).
ABN 49 009 661 287
Sales data obtained from Core Logic RP Data (www.corelogic.com.au) and median weekly rental data from the Residential Tenancies Authority (www.rta.qld.gov.au). Enquiries
about the reproduction of part or all of the information should be directed to the Corporate Affairs Division, REIQ.
© The State of Queensland (Department of Environment and Resource Management) 2015. Based on data provided with the permission of the Department of Natural Resources
and Mines: [QVAS 2015]. The Department of Environment and Resource Management makes no representations or warranties about accuracy, reliability, completeness or
suitability of the data for any particular purpose and disclaims all responsibility and all liability (including without limitation, liability in negligence) for all expenses, losses and
damages (including indirect or consequential damage) and costs which might be incurred as a result of the data being inaccurate or incomplete in any way and for any reason.
Disclaimer: The information contained in this publication, while based on information believed reliable, is not guaranteed. Nor is any of it tendered by way of investment advice; instead, it is intended
only to inform and illustrate. No reader should act on the basis of any matter contained in this publication without considering and if necessary taking appropriate professional advice with regards to
their own particular circumstances. The publisher and editor give no representations and make no warranties, express or implied, with respect to the accuracy or completeness of any of the material
(including statistics, advertisements and advertising features) contained in this publication. The publisher and editor expressly disclaim any and all liability to the reader, whether a purchaser of this
publication or not, in respect of anything and the consequences of anything done or omitted to be done by any such person in reliance, whether whole or partial, upon the whole or any part of the
contents of this publication. The publisher, editor or contributors will enter into no correspondence in relation to this publication. The mention of the company, organisation, person, investment strategy
or technique does not imply endorsement by the publisher. The publisher has not vetted advertisers and their products/services. The inclusion of advertisements or special advertising features in this
publication does not imply endorsement of the advertiser/s or their products/services by the publisher. Articles are published in reliance upon the representations and warranties of the authors of the
articles and without knowledge of any infringement of any third party’s copyright. Copyright: This publication is protected under the Commonwealth Copyrights Act 1968 and may not, in whole or part,
be lent, copied, photocopied, reproduced, translated or reduced to any electronic medium or machine-readable format without the express permission of the publisher. For permissions or reprints,
contact the Corporate Affairs Division on phone 07 3249 7347
Vacancy Trend:
Steady = +/- 0 to 0.2%pts
Up = +0.3% pts or more
Down = -0.3% pts or more
* change greater than 0.5 pts
Market Status:
TIght <2.5%
Healthy 2.5-3.5%
Weak >3.5%
Source: REIQ Residential Rental Survey
* change greater than 0.5 pts](https://image.slidesharecdn.com/qmmissue28lindadebello-151216065237/85/Qmm-issue28-linda_debello-39-320.jpg)
![QUEENSLAND MARKET MONITOR is a quarterly, electronic
publication entirely focused on residential sales and rental
research data for regions throughout the State, on a suburb-by-
suburb basis. It meets the high standards for accurate data and
reliable analysis that you have come to expect from the REIQ.
This detailed level of information will enable you to conduct
valuable comparisons between various regions and market
segments, and to ensure you are completely informed of all the
latest market trends and fluctuations.
Each edition includes:
• Median sale prices for houses, units/townhouses and land;
• Median weekly rents for houses and units/townhouses;
• On the market indicators;
• Rental market indicators;
• Useful charts and graphs; and
• Analytical market commentary.
I WOULD LIKE TO
SUBSCRIBE TO
your state-wide property research guide suburb by suburb
REIQ
Return completed
form to the REIQ
FAX
07 3249 6201
PHONE
07 3249 7301
EMAIL
research@reiq.com.au
POST
PO Box 1555
Coorparoo DC
QLD 4151
I would like single issue(s) for $22.95* each
I would like a two-year subscription (8 issues) for $150*
I would like a one-year subscription (4 issues) for $80*
Please start with or please include the following back issues
Title
Full Legal name
Company name
Occupation
Street address Post code
Postal address Post code
Email
Website Mobile
Phone
This is a renewal subscription This purchase is on behalf of a company
Cheque [please make cheques payable to the REIQ]
Visa MasterCard Amex (N.B. we cannot accept Diners)
Expiry Amount
Credit card number
Cardholder’s name Cardholder’s signature
How did you hear about us?
*all prices include GST
OFFICAL USE ONLY ID INV AUTH DATE
PRIVACY NOTICE:
THE REIQ MAY USE YOUR PERSONAL INFORMATION IN ACCORDANCE WITH ITS PRIVACY POLICY WHICH CAN BE VIEWED AT WWW.REIQ.COM/PRIVACY
ALTERNATIVELY, YOU MAY REQUEST A COPY BY:
MAIL: PO BOX 1555, COORPAROO DC QLD 4151
EMAIL:PRIVACY@REIQ.COM.AU
PHONE: (07) 3249 7347
I ACKNOWLEDGE THAT I HAVE READ AND UNDERSTOOD THE REIQ’S PRIVACY POLICY](https://image.slidesharecdn.com/qmmissue28lindadebello-151216065237/85/Qmm-issue28-linda_debello-40-320.jpg)