
![your state-wide property research guide | suburb by suburb
MARKET
QUEENSLAND
REIQ
REAL ESTATE INSTITUTE
QUEENSLAND
MONITOR
Queensland Market Monitor is a quarterly, electronic
publication entirely focused on residential sales and Each edition includes:
rental research data for regions throughout the State, on • Median sale prices for houses, units/townhouses
a suburb-by-suburb basis. It meets the high standards for and land;
accurate data and reliable analysis that you have come to • Median weekly rents for houses and units/
expect from the REIQ.
townhouses;
This detailed level of information will enable you to conduct
• Gross rental yields;
valuable comparisons between various regions and market • Rental vacancy rates;
segments, and to ensure you are completely informed of all • Useful charts and graphs; and
the latest market trends and fluctuations. • Analytical market commentary.
Yes! I would like to subscribe to the Queensland Market Monitor
I would like a two-year subscription (8 issues) for $120*
I would like a one-year subscription (4 issues) for $70* * All prices include GST
Please start with or please include the following back issues:
Name: (title) (first) (middle initial/s) (last)
Company name: Occupation:
Address: Post code:
Phone: Fax: Mobile:
Email: DOB: (day) (month) (year-optional)
This is an individual purchase This purchase is on behalf of a company
I wish to pay by: [ ] Cheque or [ ] Money order payable to the REIQ
Did you know
Please debit my: [ ] MasterCard [ ] Visa [ ] AMEX *4 digit CCV number
Name on card: reiq.com has over 90,000
Card number: Queensland properties
Amount: $ Expiry date: / CCV# for sale and rent?
Signature:
You can
How did you hear about us? find out more at
Fax: 07 3249 6201 | Phone: 07 3249 7301
Email: research@reiq.com.au
Postal Address: PO Box 1555, Coorparoo DC QLD 4151
Q OFFICE USE ONLY. ID_______________ INV_______________ AUTH ______________ DATE_______________ SENT_______________](https://image.slidesharecdn.com/qmmissue14lindajanedebello-13397459509514-phpapp02-120615024022-phpapp02/85/Qmm-Issue14-Linda-Jane-Debello-42-320.jpg)

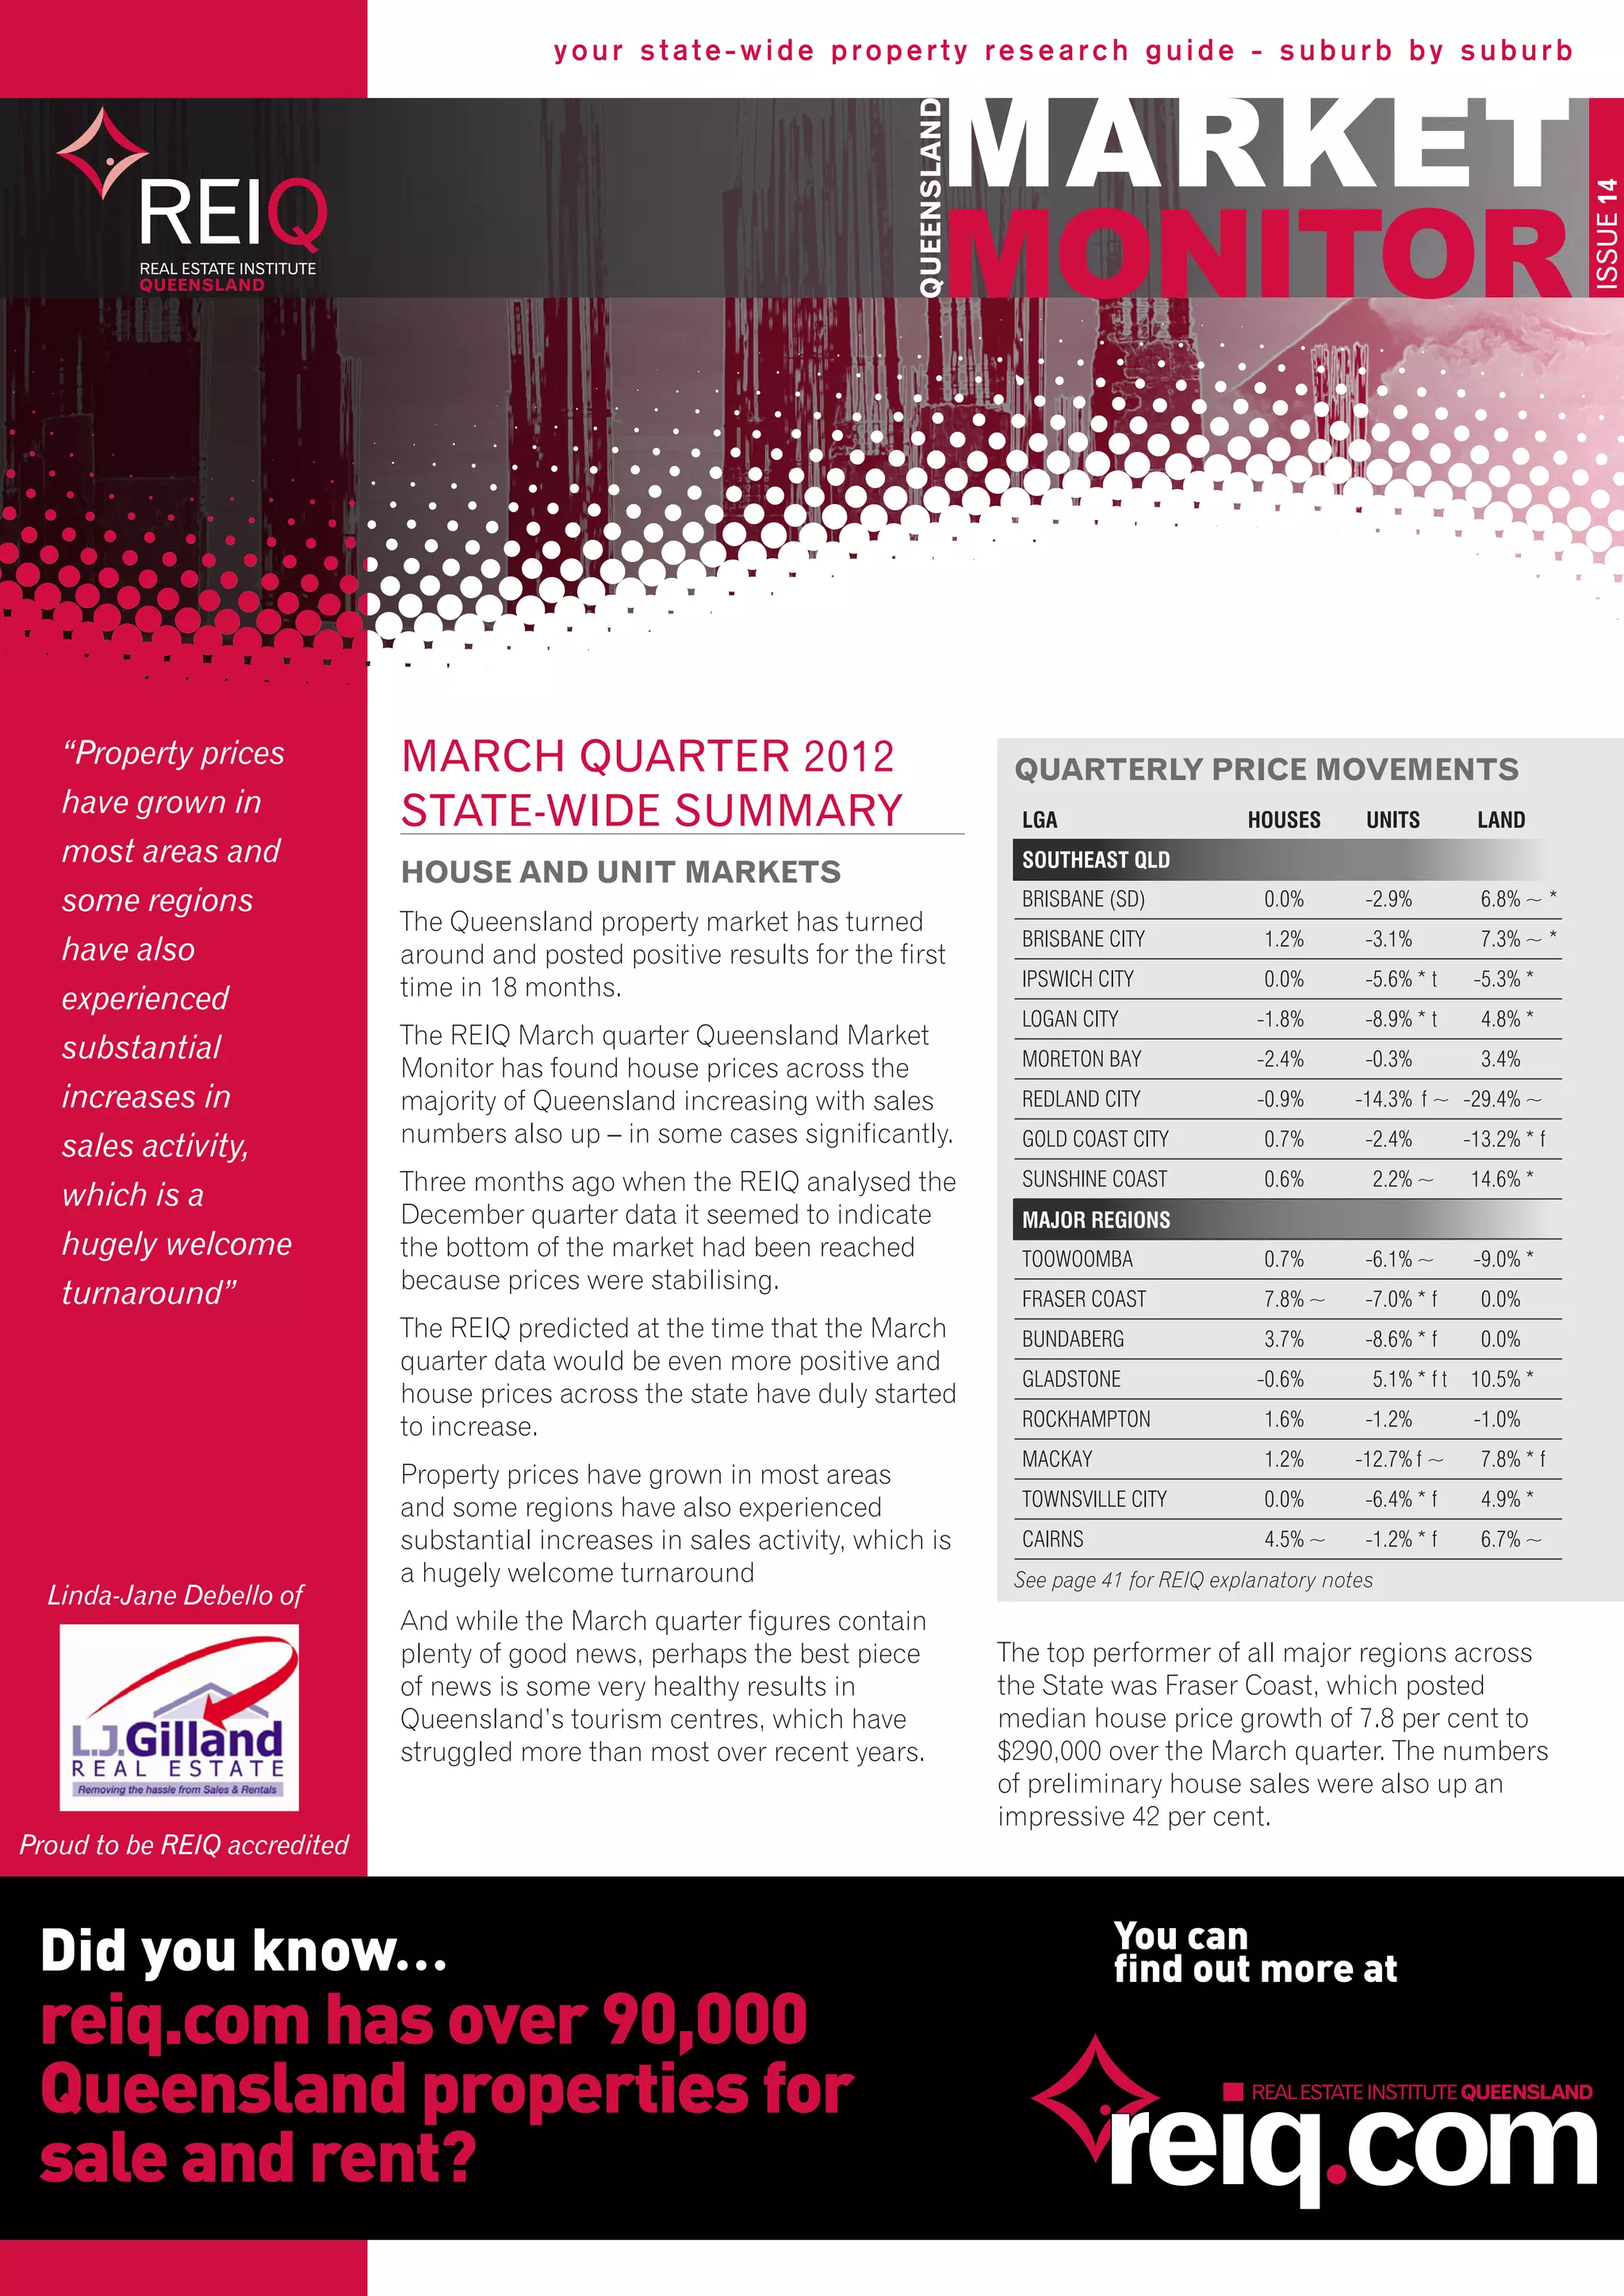
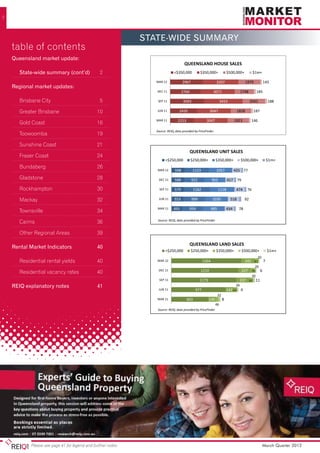
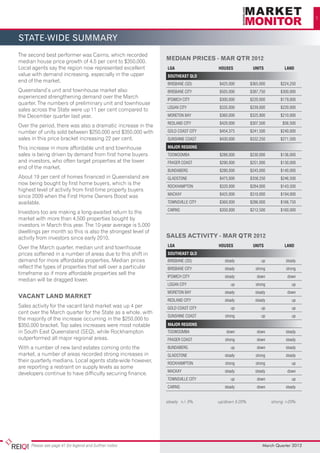
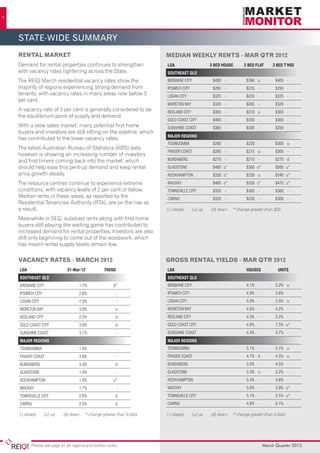
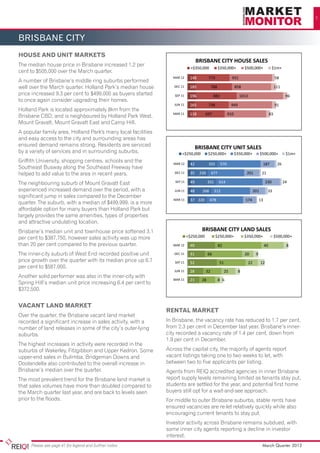
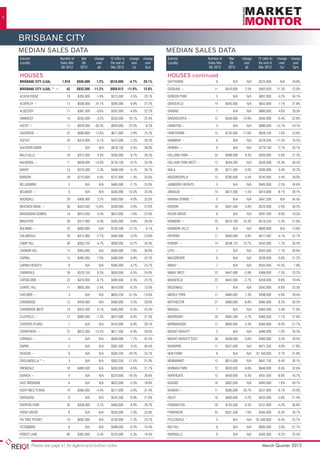
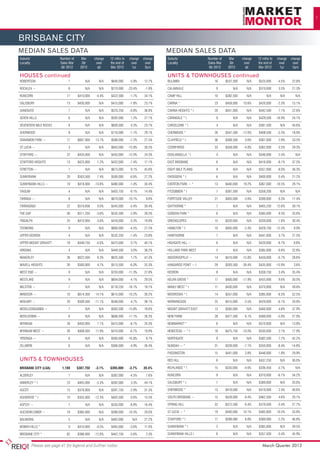
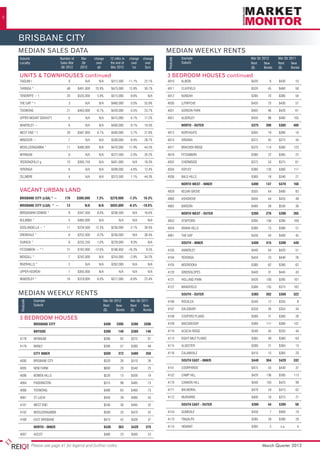
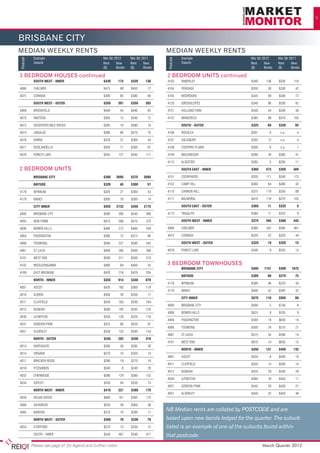
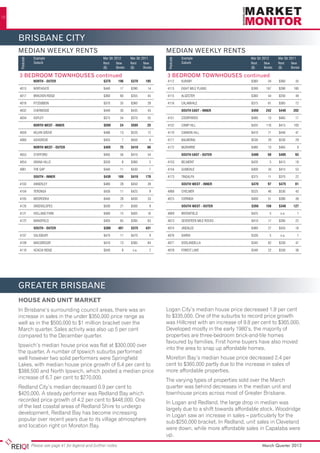
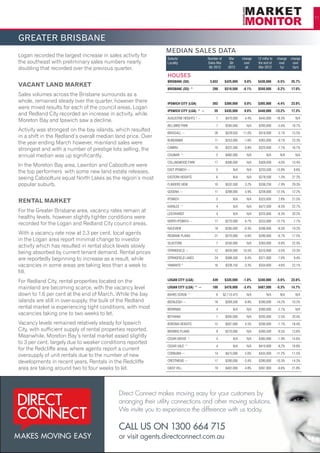
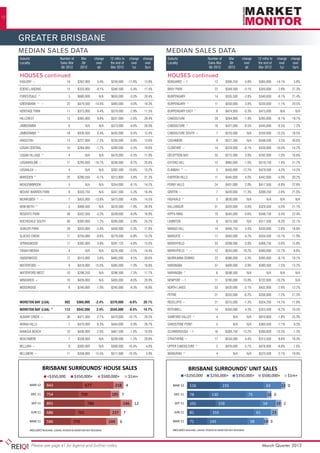
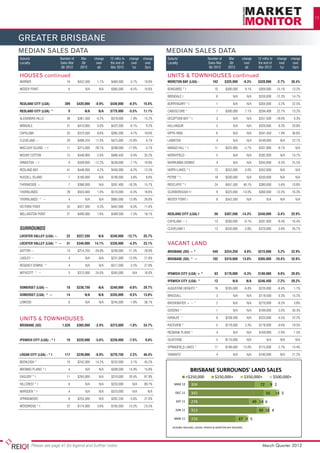
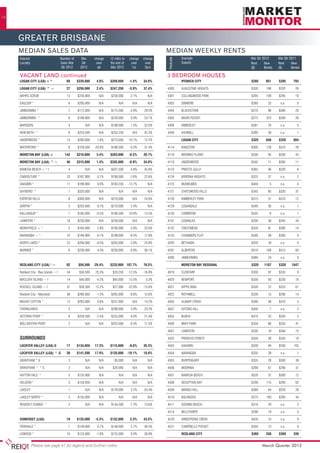
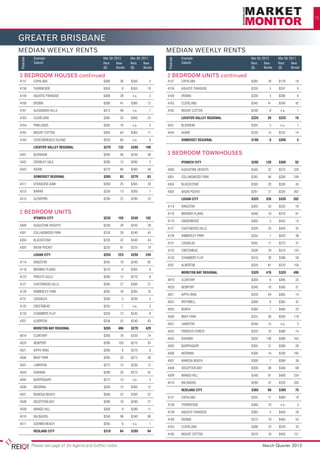
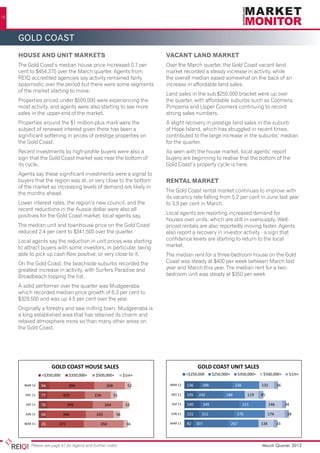
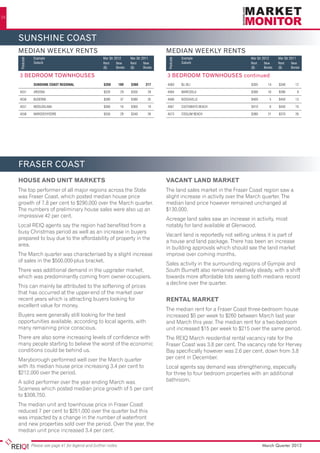
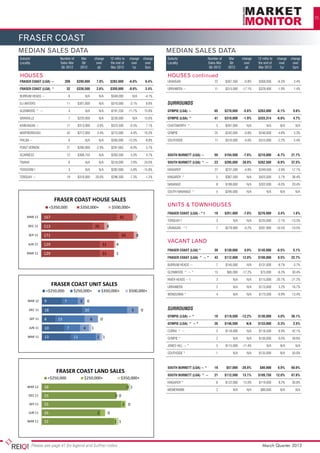
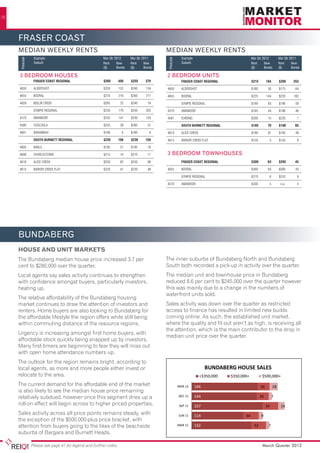
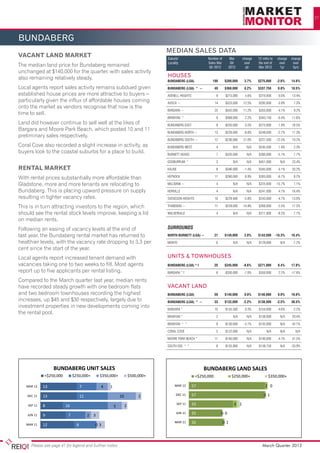
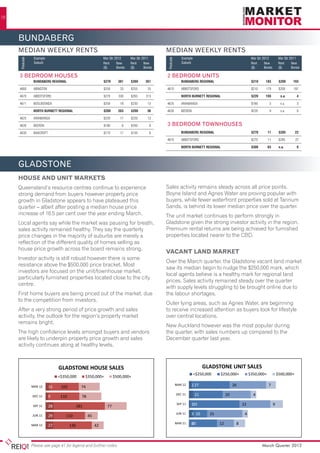
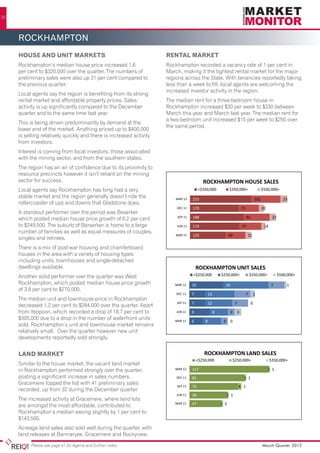
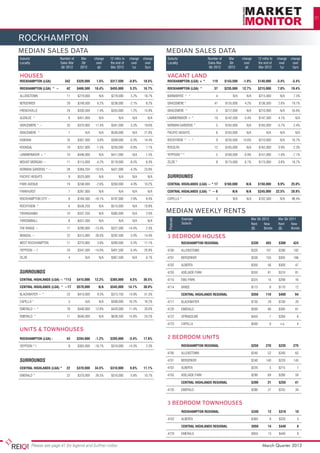
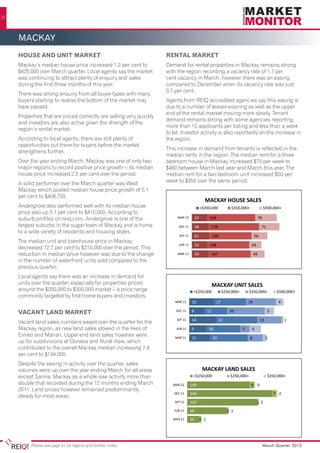
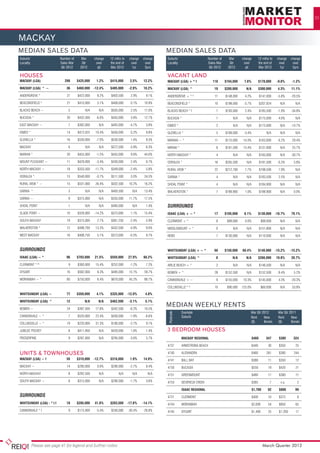
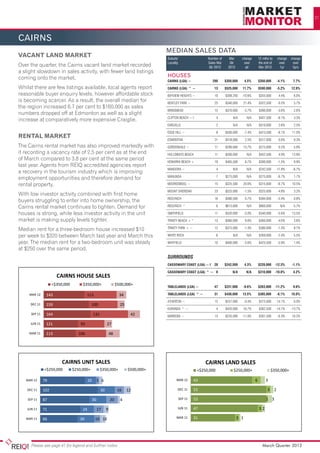
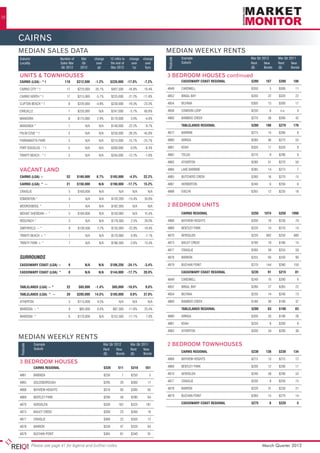
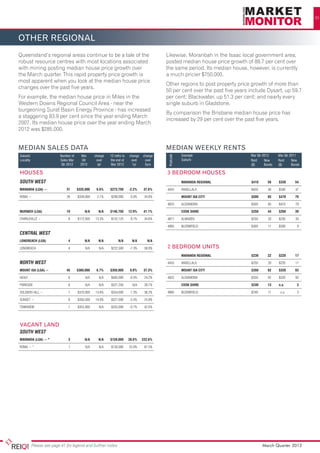
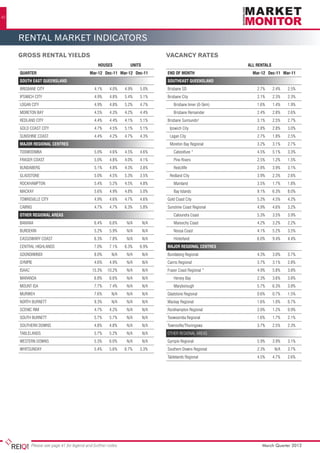
The document provides a quarterly summary of property price movements and sales activity across Queensland from March 2012. Some key points: - House prices increased in most areas of Queensland over the quarter, with strong growth in regions like Fraser Coast (7.8% increase) and Cairns (4.5% increase). - Unit sales increased 11% statewide compared to the previous quarter, with a large rise in sales of units between $250,000-$350,000. - Vacant land sales rose 4% statewide overall, with increases primarily in southeast Queensland. - Rental vacancy rates tightened across most regions as demand from tenants strengthened.


