SlideShare a Scribd company logo
1 of 32
Download to read offline
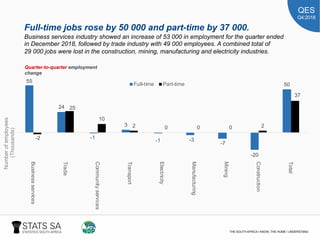
QES
Q4:2018
Quarterly Employment
Statistics
Q4:2018
#StatsSA
QES
Q4:2018
QES Background
02
01
04
03
QES is an enterprise-based sample survey
QES collects information on employing
businesses registered for VAT with annual
turnover greater than R300 000
R300 000
Samples are drawn from private non-agricultural
businesses e.g. Factories, offices, stores as well
as national, provincial and local government
entities
Sample size of approximately 20 000 was selected
QES
Q4:2018
QES Coverage
INCLUDES EXCLUDES
2
*Mining &
quarrying 3
4
5
6
7
8
9
Manufacturing
Electricity,
gas and water
supply
Construction
Wholesale
trade, retail
trade, motor
trade and hotels
and restaurants
Transport, Storage
&
Communication
Business
services
Community
& personal
services
Agriculture, hunting,
forestry and fishing
The informal business
sector
Domestic services
* Administrative data from DMR
QES
Q4:2018
4
Number of employees
as at the last month of the
reference quarter
Average monthly
earnings
for the middle month of the
reference quarter
Gross earnings
for the three months of the
reference quarter
Estimates are published on a quarter lag (SDDS)
QES Variables
QES
Q4:2018
Introduction of the 2018
sample
QES
Q4:2018
75 000
69 000
53 000
38 000
32 000
16 000
0
-1000-10 000
0
10 000
20 000
30 000
40 000
50 000
60 000
70 000
80 000
Business services Trade Community
services
Construction Manufacturing Transport Mining Electricity
The employment estimates produced by the 2018 sample for June
quarter were greater than the 2017 employment estimates in all
sectors except Mining and Electricity. The estimate was 282 000 higher compared
to 2017 sample estimates which was 9 749 000 in the same period.
Difference in QES 2017 and 2018
estimates as at June 2018 quarter
QES
Q4:2018
The employment estimates produced by the 2018 sample for Sept
quarter were greater than the 2017 employment estimates in all
sectors except Mining and Electricity. The estimate was 293 000 higher compared
to 2017 sample estimates which was 9 771 000 in the same period.
Difference in QES 2017 and 2018
estimates as at September 2018 quarter
80 000
72 000
55 000
34 000
31 000
21 000
0 0
0
10 000
20 000
30 000
40 000
50 000
60 000
70 000
80 000
90 000
Business
services
Trade Community
services
Manufacturing Construction Transport Mining Electricity
QES
Q4:2018
Linked 2018 sample
QES
Q4:2018
Numberofemployees
(Thousands)
The estimates for the June 2018 quarter were linked to
the 2017 sample estimate. The difference between the two estimates
was 282 000 in June 2018 quarter and 293 000 in September 2018 quarter.
9 734 9 749 9 772
9 799
10 032 10 065
7 500
8 000
8 500
9 000
9 500
10 000
10 500
2017Q2 2017Q3 2017Q4 2018Q1 2018Q2 2018Q3
Revised estimates
2018 sample
2017 sample
2018 sample: Linked series
(revised estimates)
QES
Q4:2018
Why is there a difference in employment and gross
earnings levels 2018 and 2017 samples?
Small businesses growing to the extent that they are now captured in
the registration process;
o greater compliance with administrative requirements to register
as an employer (Business Sampling Frame rose by 1.5% in
February 2017 compared with February 2018)
The higher employment and earnings estimates
from the 2018 sample may be attributed, though
not limited to, the following:
QES
Q4:2018
The series was linked from sub-sector
reporting level, and aggregated to industry
level
Only 4 quarters were linked to the series
(i.e. Q2:2017, Q3:2017, Q4:2017, and
Q1:2018)
Methodology
QES
Q4:2018
Results for Q4:2018
QES
Q4:2018
Q4:2018 EMPLOYMENT RESULTS
10,151M
1,6%
Y/Y
158 000
0,9%
Q/Q
87 000
The total number of persons employed
increased from 10,064M in Q3:2018
Jobs increased by 158 000 (or 1,6%) in the reference quarter compared with the same quarter of 2017
(Q4:2017).
There was a quarterly increase of 87 000 jobs (or 0,9%) in the Q4:2018 compared with Q3:2018.
QES
Q4:2018
Q4:2018 EMPLOYMENT COMPOSITION
FULL TIME
9,086M
PART TIME
1,065M
Part-time employees are those
permanent, temporary or casual
employees who work less than
40 hours per week.
Full-time employees are those
permanent, temporary and casual
employees who normally work 40 hours
or more per week.
90%
10%
QES
Q4:2018
55
24
-1
3
-1 -3
-7
-20
50
-2
25
10
2 0 0 0 2
37
Businessservices
Trade
Communityservices
Transport
Electricity
Manufacturing
Mining
Construction
Total
Full-time Part-time
Quarter-to-quarter employment
change
Full-time jobs rose by 50 000 and part-time by 37 000.
Business services industry showed an increase of 53 000 in employment for the quarter ended
in December 2018, followed by trade industry with 49 000 employees. A combined total of
29 000 jobs were lost in the construction, mining, manufacturing and electricity industries.
Numberofemployees
(Thousands)
QES
Q4:2018
88
45
17
5 5
-1
-8
-17
134
-11
10 15
2 0 0 0
8
24
Businessservices
Trade
Communityservices
Transport
Manufacturing
Electricity
Mining
Construction
Total
Full Time Part Time
Year-on-year employment
change
There was an annual increase of 158 000 jobs in Q4:2018
compared with Q4:2017. Business services industry recorded the highest
increase in employment in the fourth quarter compared with the same quarter in 2017.
Construction, mining and electricity industries lost a combined total of 18 000 jobs in Q4:2018
compared with Q4:2017. Full-time employees contributed the most jobs.
Numberofemployees
(Thousands)
QES
Q4:2018
PERCENTAGE CHANGE IN EMPLOYMENT
Quarterly and annual changes in employment in the fourth quarter of 2018.
2,3%
2,2%
1,0%
0,3%
-0,2%
-1,5%
-1,6%
-2,8%
0,9%
-4,0 -3,0 -2,0 -1,0 0,0 1,0 2,0 3,0
Business services
Trade
Transport
Community services
Manufacturing
Mining
Electricity
Construction
Total
Quarter-on-quarter
3,4%
2,5%
1,5%
1,2%
0,4%
-1,4%
-1,6%
-1,8%
1,6%
- 3,0 - 2,0 - 1,0 0,0 1,0 2,0 3,0 4,0
Business services
Trade
Transport
Community services
Manufacturing
Construction
Electricity
Mining
Total
Year-on-year
QES
Q4:2018
* Revised estimates
489
459
456
471
456
449
420
430
440
450
460
470
480
490
500
JUN SEP DEC MAR JUN SEP DEC MAR JUN SEP DEC MAR JUN SEP* DEC
2015 2016 2017 2018
THOUSANDS
Number of employees in the
Mining and Quarrying Industry
The mining industry continues to shed jobs, reaching its lowest
level at 449 000 in Q4:2018. There was a quarterly decrease of 7 000 jobs compared with
Q3:2018 from 456 000. The industry lost 8 000 jobs compared in the fourth quarter of 2017.
Numberofemployees
QES
Q4:2018
* Revised estimates
There’s an upward trend shown in the trade industry with 49 000
additional jobs in the fourth quarter following a moderate gain in the
third quarter of 2018. Year-on-year the industry gained 55 000 jobs compared with same quarter
of 2017.
Number of employees in the
Trade Industry
1 926
2 062
2 131
2 206
2 212
2 261
JUN SEP DEC MAR JUN SEP DEC MAR JUN* SEP* DEC* MAR* JUN* SEP* DEC
2015 2016 2017 2018
Numberofemployees
Thousands
QES
Q4:2018
2 545
2 659
2 698
2 751
2 681
2 684 2 693
JUN SEP DEC MAR JUN SEP DEC MAR JUN* SEP* DEC* MAR* JUN* SEP* DEC
2015 2016 2017 2018
Numberofemployees
Thousands
Number of employees in the
Community Services Industry
The Community service industry reported an increase of 9 000 jobs
in the fourth quarter. Year-on-year the industry gained 32 000 jobs in Q4:2018 compared with
same quarter of previous year.
Increase was due to
appointment of casual workers
for the election registration drive
in Q1:2016
Increase was due to appointment
of casual workers for local
government election in Q3:2016
Increase due to appointment of
casual workers for the
upcoming 2019 national
election registration drive.
* Revised estimates
QES
Q4:2018
* Revised estimates
9 293
9 702
10 098
10 064
10 151
8 800
9 000
9 200
9 400
9 600
9 800
10 000
10 200
10 400
Jun Sep Dec Mar Jun Sep Dec Mar Jun* Sep* Dec* Mar* Jun* Sep Dec
2015 2016 2017 2018
THOUSANDS
Employment growth over time
from June 2015 to December
2018
Employment time-series from 2015.
The number of jobs increased by nearly 900 thousand from 9,3 million in
second quarter of 2015 to 10,2 million in the last quarter of 2018.
QES
Q4:2018
Q4:2018 GROSS EARNINGS RESULTS
R725bn Total gross earnings paid in the quarter
(from R685 billion in 2018:Q3).
6,9%
Y/Y
R47 billion
Increases in gross
earnings may be due
to salary increases,
bonus and overtime
payments paid in the
current quarter.
5,8%
Q/Q
R40 billion
QES
Q4:2018
Q4:2018 GROSS EARNINGS COMPOSITION
R725bn
13%
87%
Bonus and
overtime payments
R95bn
Basic salary/wages
R630bn
QES
Q4:2018
Quarter-on-quarter Gross earnings (R' 000)
Industry Basic Salary/Wages Bonus & Overtime Payments Total Gross Earnings
Trade 2 233 000 8 749 000 10 982 000
Business services 3 692 000 3 365 000 7 057 000
Manufacturing 997 000 7 247 000 8 244 000
Community services -2 892 000 8 409 000 5 517 000
Construction -182 000 3 687 000 3 505 000
Transport 490 000 2 077 000 2 567 000
Electricity 136 000 1 381 000 1 517 000
Mining 544 000 544 000
Total 5 018 000 34 915 000 39 933 000
Quarter-on-quarter gains
Increases in gross earnings was due to salary increases (R5 billion),
bonuses and overtime payments (R35 billion) paid in the fourth
quarter of 2018.
QES
Q4:2018
Year-on-year Gross earnings (R' 000)
Industry Basic Salary/Wages Bonus & Overtime Payments Total Gross Earnings
Community services 15 674 000 3 983 000 19 657 000
Business services 7 479 000 4 916 000 12 395 000
Trade 5 710 000 1 264 000 6 974 000
Manufacturing 3 054 000 738 000 3 792 000
Mining 1 861 000 1 861 000
Transport 1 955 000 -260 000 1 695 000
Electricity 432 000 405 000 837 000
Construction 261 000 -869 000 -608 000
Total 36 426 000 10 177 000 46 603 000
Increases in gross earnings was due to salary increases (R36
billion), bonuses and overtime payments (R10 billion) paid in the
fourth quarter of 2018.
Year-on-year gains
QES
Q4:2018
PERCENTAGE CHANGE IN GROSS EARNINGS
Changes in quarterly and annual changes in gross earnings paid in the
fourth quarter of 2018.
18,7%
12,0%
11,3%
10,9%
6,7%
3,9%
2,4%
1,6%
5,8%
0,0 5,0 10,0 15,0 20,0
Electricity
Manufacturing
Trade
Construction
Transport
Business services
Community services
Mining
Total
Quarter-on-quarter
9,5%
9,3%
7,0%
6,9%
5,7%
5,2%
4,3%
-1,7%
6,9%
- 5,0 0,0 5,0 10,0
Electricity
Community services
Business services
Trade
Mining
Manufacturing
Transport
Construction
Total
Year-on-year
QES
Q4:2018
PERCENTAGE CHANGE IN GROSS EARNINGS
Changes in quarterly and annual changes in gross earnings paid in the
fourth quarter of 2018.
18,7%
12,0%
11,3%
10,9%
6,7%
3,9%
2,4%
1,6%
5,8%
0,0 5,0 10,0 15,0 20,0
Electricity
Manufacturing
Trade
Construction
Transport
Business services
Community services
Mining
Total
Quarter-on-quarter
9,5%
5,2%
6,9%
-1,7%
4,3%
7,0%
9,3%
5,7%
6,9%
-4,0% -2,0% 0,0% 2,0% 4,0% 6,0% 8,0% 10,0% 12,0%
Electricity
Manufacturing
Trade
Construction
Transport
Business Services
Community Services
Mining
Total
Year-on-year
QES
Q4:2018
Grossearnings
R’billion
* Revised estimates
500
685
725
0
100
200
300
400
500
600
700
800
JUN SEP DEC MAR JUN SEP DEC MAR JUN* SEP* DEC* MAR* JUN* SEP* DEC
2015 2016 2017 2018
Gross earnings have steadily trended upwards since 2015.
Changes in gross earnings
observed from June 2015 to
December 2018
The gross earnings increased by R225 billion (or 45.0%) from R500 billion in
second quarter of 2015 to R725 billion at the end of 2018.
QES
Q4:2018
Average Monthly Earnings
(AME)
November 2018
QES
Q4:2018
NOVEMBER 2018: AVERAGE MONTHLY EARNINGS (AME)
R21 190
AME including bonuses and overtime
payments paid in November 2018 remained
unchanged (R21 192 August 2018)
Quarter-on-quarter AME remained unchanged and year-on-year there was an
increase of 4,9%
0%
Y/Y
4,9%
QES
Q4:2018
5,4%
2,0%
0,6%
0,5%
0,0%
-0,5%
-0,3%
-1,1%
-1,6%
- 2,0 0,0 2,0 4,0 6,0
Electricity
Mining
Community services
Manufacturing
Total
Transport
Business services
Trade
Construction
Q/Q Y/Y
There was an increase in average monthly earnings for 4 of 8
industries in the fourth quarter compared with quarter three.
Year-on-year there was an increase in November 2018 compared with November 2017.
November 2018: average
monthly earnings
10,4%
8,2%
8,0%
4,8%
4,9%
5,0%
3,6%
3,4%
0,4%
0,0% 5,0% 10,0% 15,0%
Electricity
Mining
Community
Services
Manufacturing
Total
Transport
Business
Services
Trade
Construction
QES
Q4:2018
Thank You
StatsSA @StatsSA

More Related Content

What's hot

Enea 2016 Q3 - financial results (english)
Enea 2016 Q3 - financial results (english) Enea 2016 Q3 - financial results (english)
Enea 2016 Q3 - financial results (english) Enea
 
Business... at a glance January 2020 Círculo de Empresarios
Business... at a glance January 2020 Círculo de EmpresariosBusiness... at a glance January 2020 Círculo de Empresarios
Business... at a glance January 2020 Círculo de EmpresariosCírculo de Empresarios
 
Steel Industry in Turkey by 2018
Steel Industry in Turkey by 2018Steel Industry in Turkey by 2018
Steel Industry in Turkey by 2018FMC Group
 
JLL Detroit Industrial Insight & Statistics - Q4 2018
JLL Detroit Industrial Insight & Statistics - Q4 2018JLL Detroit Industrial Insight & Statistics - Q4 2018
JLL Detroit Industrial Insight & Statistics - Q4 2018Harrison West
 
Detroit Q3 2018 Industrial Market Report
Detroit Q3 2018 Industrial Market ReportDetroit Q3 2018 Industrial Market Report
Detroit Q3 2018 Industrial Market ReportDavid Abraham, MAI, SRA
 
Automation Business Sees Beginnings of a Recovery in Third Quarter
Automation Business Sees Beginnings of a Recovery in Third QuarterAutomation Business Sees Beginnings of a Recovery in Third Quarter
Automation Business Sees Beginnings of a Recovery in Third QuarterARC Advisory Group
 
Agriculture, construction, and mining machinery manufacturing market global b...
Agriculture, construction, and mining machinery manufacturing market global b...Agriculture, construction, and mining machinery manufacturing market global b...
Agriculture, construction, and mining machinery manufacturing market global b...lakshmipraneethganti
 
JLL Detroit Industrial Insight & Statistics - Q4 2018
JLL Detroit Industrial Insight & Statistics - Q4 2018JLL Detroit Industrial Insight & Statistics - Q4 2018
JLL Detroit Industrial Insight & Statistics - Q4 2018Harrison West
 
MBFS Budget Report 2015 March and July 2015
MBFS Budget Report 2015 March and July 2015MBFS Budget Report 2015 March and July 2015
MBFS Budget Report 2015 March and July 2015David Johnson
 
SIMIDoneDeal Quarter 4 Motor Industry Review 2015 & January Car Sales 2016
SIMIDoneDeal Quarter 4 Motor Industry Review 2015 & January Car Sales 2016 SIMIDoneDeal Quarter 4 Motor Industry Review 2015 & January Car Sales 2016
SIMIDoneDeal Quarter 4 Motor Industry Review 2015 & January Car Sales 2016 Teresa Noone
 
JLL Detroit Industrial Insight & Statistics - Q2 2016
JLL Detroit Industrial Insight & Statistics - Q2 2016JLL Detroit Industrial Insight & Statistics - Q2 2016
JLL Detroit Industrial Insight & Statistics - Q2 2016Aaron Moore
 

What's hot (19)

2020.05.28 UGA S&D balances
2020.05.28 UGA S&D balances2020.05.28 UGA S&D balances
2020.05.28 UGA S&D balances
 
Enea 2016 Q3 - financial results (english)
Enea 2016 Q3 - financial results (english) Enea 2016 Q3 - financial results (english)
Enea 2016 Q3 - financial results (english)
 
UGA S&D balances Grain&OilSeeds March 2020
UGA S&D balances Grain&OilSeeds March 2020UGA S&D balances Grain&OilSeeds March 2020
UGA S&D balances Grain&OilSeeds March 2020
 
Business... at a glance January 2020 Círculo de Empresarios
Business... at a glance January 2020 Círculo de EmpresariosBusiness... at a glance January 2020 Círculo de Empresarios
Business... at a glance January 2020 Círculo de Empresarios
 
Steel Industry in Turkey by 2018
Steel Industry in Turkey by 2018Steel Industry in Turkey by 2018
Steel Industry in Turkey by 2018
 
Result presentation 2020
Result presentation 2020Result presentation 2020
Result presentation 2020
 
JLL Detroit Industrial Insight & Statistics - Q4 2018
JLL Detroit Industrial Insight & Statistics - Q4 2018JLL Detroit Industrial Insight & Statistics - Q4 2018
JLL Detroit Industrial Insight & Statistics - Q4 2018
 
Detroit Q3 2018 Industrial Market Report
Detroit Q3 2018 Industrial Market ReportDetroit Q3 2018 Industrial Market Report
Detroit Q3 2018 Industrial Market Report
 
Automation Business Sees Beginnings of a Recovery in Third Quarter
Automation Business Sees Beginnings of a Recovery in Third QuarterAutomation Business Sees Beginnings of a Recovery in Third Quarter
Automation Business Sees Beginnings of a Recovery in Third Quarter
 
Agriculture, construction, and mining machinery manufacturing market global b...
Agriculture, construction, and mining machinery manufacturing market global b...Agriculture, construction, and mining machinery manufacturing market global b...
Agriculture, construction, and mining machinery manufacturing market global b...
 
Indianapolis JLL Employment Update September 2015
Indianapolis JLL Employment Update September 2015Indianapolis JLL Employment Update September 2015
Indianapolis JLL Employment Update September 2015
 
JLL Detroit Industrial Insight & Statistics - Q4 2018
JLL Detroit Industrial Insight & Statistics - Q4 2018JLL Detroit Industrial Insight & Statistics - Q4 2018
JLL Detroit Industrial Insight & Statistics - Q4 2018
 
MBFS Budget Report 2015 March and July 2015
MBFS Budget Report 2015 March and July 2015MBFS Budget Report 2015 March and July 2015
MBFS Budget Report 2015 March and July 2015
 
Productivity Research Network, March 2018
Productivity Research Network, March 2018Productivity Research Network, March 2018
Productivity Research Network, March 2018
 
April 2018 Jobs Report
April 2018 Jobs ReportApril 2018 Jobs Report
April 2018 Jobs Report
 
March 2018 Jobs Report
March 2018 Jobs ReportMarch 2018 Jobs Report
March 2018 Jobs Report
 
2020.07.31 S&D balances UGA
2020.07.31 S&D balances UGA 2020.07.31 S&D balances UGA
2020.07.31 S&D balances UGA
 
SIMIDoneDeal Quarter 4 Motor Industry Review 2015 & January Car Sales 2016
SIMIDoneDeal Quarter 4 Motor Industry Review 2015 & January Car Sales 2016 SIMIDoneDeal Quarter 4 Motor Industry Review 2015 & January Car Sales 2016
SIMIDoneDeal Quarter 4 Motor Industry Review 2015 & January Car Sales 2016
 
JLL Detroit Industrial Insight & Statistics - Q2 2016
JLL Detroit Industrial Insight & Statistics - Q2 2016JLL Detroit Industrial Insight & Statistics - Q2 2016
JLL Detroit Industrial Insight & Statistics - Q2 2016
 

Similar to Quarterly Employment Statistics (QES), December 2018

South African Gross Domestic Product for Q3:2018
South African Gross Domestic Product for Q3:2018South African Gross Domestic Product for Q3:2018
South African Gross Domestic Product for Q3:2018Statistics South Africa
 
Metso Interim Review Q3 2015
Metso Interim Review Q3 2015 Metso Interim Review Q3 2015
Metso Interim Review Q3 2015 Metso Group
 
Did Nigerian operators lose US$ 1 Billion in revenues to OTTs in 2019?
Did Nigerian operators lose US$ 1 Billion in revenues to OTTs in 2019?Did Nigerian operators lose US$ 1 Billion in revenues to OTTs in 2019?
Did Nigerian operators lose US$ 1 Billion in revenues to OTTs in 2019?Christoph Stork
 
Wärtsilä Corporation's Result presentation 2018
Wärtsilä Corporation's Result presentation 2018Wärtsilä Corporation's Result presentation 2018
Wärtsilä Corporation's Result presentation 2018Wärtsilä Corporation
 
Q1 investor deck final
Q1 investor deck finalQ1 investor deck final
Q1 investor deck finalADAESIR
 
May 2018 U.S. Jobs Report Infographic
May 2018 U.S. Jobs Report InfographicMay 2018 U.S. Jobs Report Infographic
May 2018 U.S. Jobs Report InfographicJohnson Service Group
 
3Q 2018 Results
3Q 2018 Results3Q 2018 Results
3Q 2018 ResultsGruppo TIM
 
Varmas Interim Report 1 January - 30 September 2018
Varmas Interim Report 1 January - 30 September 2018Varmas Interim Report 1 January - 30 September 2018
Varmas Interim Report 1 January - 30 September 2018Työeläkeyhtiö Varma
 
Transnet financial results
Transnet financial resultsTransnet financial results
Transnet financial resultsSABC News
 
Metso Q2 2015 Interim Review
Metso Q2 2015 Interim ReviewMetso Q2 2015 Interim Review
Metso Q2 2015 Interim ReviewMetso Group
 
Private Equity Times Report - United Kingdom 2019
Private Equity Times Report - United Kingdom 2019Private Equity Times Report - United Kingdom 2019
Private Equity Times Report - United Kingdom 2019Vidur Sachdeva
 
Quarterly Labour Force Survey Quarter 1:2018
Quarterly Labour Force Survey Quarter 1:2018Quarterly Labour Force Survey Quarter 1:2018
Quarterly Labour Force Survey Quarter 1:2018Statistics South Africa
 
Business at a glance may 2018 Circulo de Empresarios
Business at  a glance may 2018 Circulo de EmpresariosBusiness at  a glance may 2018 Circulo de Empresarios
Business at a glance may 2018 Circulo de EmpresariosCírculo de Empresarios
 
Q2 investor deck final
Q2 investor deck finalQ2 investor deck final
Q2 investor deck finalADAESIR
 
Economic profile with a focus on R&D-intensive industries - Alexandra Tsvetkova
Economic profile with a focus on R&D-intensive industries - Alexandra TsvetkovaEconomic profile with a focus on R&D-intensive industries - Alexandra Tsvetkova
Economic profile with a focus on R&D-intensive industries - Alexandra TsvetkovaOECD CFE
 

Similar to Quarterly Employment Statistics (QES), December 2018 (20)

Result presentation Q3 2018
Result presentation Q3 2018Result presentation Q3 2018
Result presentation Q3 2018
 
Result presentation Q2 2018
Result presentation Q2 2018Result presentation Q2 2018
Result presentation Q2 2018
 
South African Gross Domestic Product for Q3:2018
South African Gross Domestic Product for Q3:2018South African Gross Domestic Product for Q3:2018
South African Gross Domestic Product for Q3:2018
 
Metso Interim Review Q3 2015
Metso Interim Review Q3 2015 Metso Interim Review Q3 2015
Metso Interim Review Q3 2015
 
Did Nigerian operators lose US$ 1 Billion in revenues to OTTs in 2019?
Did Nigerian operators lose US$ 1 Billion in revenues to OTTs in 2019?Did Nigerian operators lose US$ 1 Billion in revenues to OTTs in 2019?
Did Nigerian operators lose US$ 1 Billion in revenues to OTTs in 2019?
 
Wärtsilä Corporation's Result presentation 2018
Wärtsilä Corporation's Result presentation 2018Wärtsilä Corporation's Result presentation 2018
Wärtsilä Corporation's Result presentation 2018
 
Result presentation Q3 2020
Result presentation Q3 2020Result presentation Q3 2020
Result presentation Q3 2020
 
Sensemaking update ytd 2019 (may)
Sensemaking update ytd 2019 (may)Sensemaking update ytd 2019 (may)
Sensemaking update ytd 2019 (may)
 
Q1 investor deck final
Q1 investor deck finalQ1 investor deck final
Q1 investor deck final
 
May 2018 U.S. Jobs Report Infographic
May 2018 U.S. Jobs Report InfographicMay 2018 U.S. Jobs Report Infographic
May 2018 U.S. Jobs Report Infographic
 
3Q 2018 Results
3Q 2018 Results3Q 2018 Results
3Q 2018 Results
 
Varmas Interim Report 1 January - 30 September 2018
Varmas Interim Report 1 January - 30 September 2018Varmas Interim Report 1 January - 30 September 2018
Varmas Interim Report 1 January - 30 September 2018
 
Transnet financial results
Transnet financial resultsTransnet financial results
Transnet financial results
 
Metso Q2 2015 Interim Review
Metso Q2 2015 Interim ReviewMetso Q2 2015 Interim Review
Metso Q2 2015 Interim Review
 
Private Equity Times Report - United Kingdom 2019
Private Equity Times Report - United Kingdom 2019Private Equity Times Report - United Kingdom 2019
Private Equity Times Report - United Kingdom 2019
 
Quarterly Labour Force Survey Quarter 1:2018
Quarterly Labour Force Survey Quarter 1:2018Quarterly Labour Force Survey Quarter 1:2018
Quarterly Labour Force Survey Quarter 1:2018
 
Calidda investor's presentation Q3 2014
Calidda investor's presentation Q3 2014Calidda investor's presentation Q3 2014
Calidda investor's presentation Q3 2014
 
Business at a glance may 2018 Circulo de Empresarios
Business at  a glance may 2018 Circulo de EmpresariosBusiness at  a glance may 2018 Circulo de Empresarios
Business at a glance may 2018 Circulo de Empresarios
 
Q2 investor deck final
Q2 investor deck finalQ2 investor deck final
Q2 investor deck final
 
Economic profile with a focus on R&D-intensive industries - Alexandra Tsvetkova
Economic profile with a focus on R&D-intensive industries - Alexandra TsvetkovaEconomic profile with a focus on R&D-intensive industries - Alexandra Tsvetkova
Economic profile with a focus on R&D-intensive industries - Alexandra Tsvetkova
 

More from Statistics South Africa

African Statistics Day_Department of Home Affairs
African Statistics Day_Department of Home AffairsAfrican Statistics Day_Department of Home Affairs
African Statistics Day_Department of Home AffairsStatistics South Africa
 
Celebrating African Statistics Day 18 November 2019
Celebrating African Statistics Day 18 November 2019Celebrating African Statistics Day 18 November 2019
Celebrating African Statistics Day 18 November 2019Statistics South Africa
 
Non-financial census of municipalities 2017/18
Non-financial census of municipalities 2017/18Non-financial census of municipalities 2017/18
Non-financial census of municipalities 2017/18Statistics South Africa
 
Quarterly Labour Force Survey (QLFS), 2nd Quarter 2019
Quarterly Labour Force Survey (QLFS), 2nd Quarter 2019Quarterly Labour Force Survey (QLFS), 2nd Quarter 2019
Quarterly Labour Force Survey (QLFS), 2nd Quarter 2019Statistics South Africa
 
Gross Domestic Product (GDP), 1st Quarter 2019
Gross Domestic Product (GDP), 1st Quarter 2019Gross Domestic Product (GDP), 1st Quarter 2019
Gross Domestic Product (GDP), 1st Quarter 2019Statistics South Africa
 
Quarterly Labour Force Survey (QLFS), 1st Quarter 2019
Quarterly Labour Force Survey (QLFS), 1st Quarter 2019Quarterly Labour Force Survey (QLFS), 1st Quarter 2019
Quarterly Labour Force Survey (QLFS), 1st Quarter 2019Statistics South Africa
 
Higher Education and Skills in South Africa
Higher Education and Skills in South AfricaHigher Education and Skills in South Africa
Higher Education and Skills in South AfricaStatistics South Africa
 
Financial statistics of consolidated general government, 2017
Financial statistics of consolidated general government, 2017Financial statistics of consolidated general government, 2017
Financial statistics of consolidated general government, 2017Statistics South Africa
 

More from Statistics South Africa (20)

Qlfs q4 2019 final final for sg (1)
Qlfs q4 2019 final  final for sg (1)Qlfs q4 2019 final  final for sg (1)
Qlfs q4 2019 final final for sg (1)
 
African Statistics Day_Department of Home Affairs
African Statistics Day_Department of Home AffairsAfrican Statistics Day_Department of Home Affairs
African Statistics Day_Department of Home Affairs
 
African Statistics Day_IOM DTM
African Statistics Day_IOM DTMAfrican Statistics Day_IOM DTM
African Statistics Day_IOM DTM
 
Celebrating African Statistics Day 18 November 2019
Celebrating African Statistics Day 18 November 2019Celebrating African Statistics Day 18 November 2019
Celebrating African Statistics Day 18 November 2019
 
QLFS_Q3_2019 Presentation
QLFS_Q3_2019 PresentationQLFS_Q3_2019 Presentation
QLFS_Q3_2019 Presentation
 
Victims of Crime Survey, 2018
Victims of Crime Survey, 2018Victims of Crime Survey, 2018
Victims of Crime Survey, 2018
 
Recorded Live Births 2018
Recorded Live Births  2018Recorded Live Births  2018
Recorded Live Births 2018
 
Gross Domestic Product Q2:2019
Gross Domestic Product Q2:2019Gross Domestic Product Q2:2019
Gross Domestic Product Q2:2019
 
Non-financial census of municipalities 2017/18
Non-financial census of municipalities 2017/18Non-financial census of municipalities 2017/18
Non-financial census of municipalities 2017/18
 
Quarterly Labour Force Survey (QLFS), 2nd Quarter 2019
Quarterly Labour Force Survey (QLFS), 2nd Quarter 2019Quarterly Labour Force Survey (QLFS), 2nd Quarter 2019
Quarterly Labour Force Survey (QLFS), 2nd Quarter 2019
 
Mid-year population estimates, 2019
Mid-year population estimates, 2019Mid-year population estimates, 2019
Mid-year population estimates, 2019
 
Gross Domestic Product (GDP), 1st Quarter 2019
Gross Domestic Product (GDP), 1st Quarter 2019Gross Domestic Product (GDP), 1st Quarter 2019
Gross Domestic Product (GDP), 1st Quarter 2019
 
Quarterly Labour Force Survey (QLFS), 1st Quarter 2019
Quarterly Labour Force Survey (QLFS), 1st Quarter 2019Quarterly Labour Force Survey (QLFS), 1st Quarter 2019
Quarterly Labour Force Survey (QLFS), 1st Quarter 2019
 
Higher Education and Skills in South Africa
Higher Education and Skills in South AfricaHigher Education and Skills in South Africa
Higher Education and Skills in South Africa
 
Quarterly Labour Force Survey
Quarterly Labour Force SurveyQuarterly Labour Force Survey
Quarterly Labour Force Survey
 
Mid-year population estimates, 2018
Mid-year population estimates, 2018Mid-year population estimates, 2018
Mid-year population estimates, 2018
 
Financial statistics of consolidated general government, 2017
Financial statistics of consolidated general government, 2017Financial statistics of consolidated general government, 2017
Financial statistics of consolidated general government, 2017
 
Quarterly Labour Force Survey, Q3:2018
Quarterly Labour Force Survey, Q3:2018Quarterly Labour Force Survey, Q3:2018
Quarterly Labour Force Survey, Q3:2018
 
Victims of Crime Survey, 2017 - 2018
Victims of Crime Survey, 2017 - 2018Victims of Crime Survey, 2017 - 2018
Victims of Crime Survey, 2017 - 2018
 
Recorded live births - 2017
Recorded live births - 2017Recorded live births - 2017
Recorded live births - 2017
 

Recently uploaded

8447779800, Low rate Call girls in Rohini Delhi NCR
8447779800, Low rate Call girls in Rohini Delhi NCR8447779800, Low rate Call girls in Rohini Delhi NCR
8447779800, Low rate Call girls in Rohini Delhi NCRashishs7044
 
8447779800, Low rate Call girls in Kotla Mubarakpur Delhi NCR
8447779800, Low rate Call girls in Kotla Mubarakpur Delhi NCR8447779800, Low rate Call girls in Kotla Mubarakpur Delhi NCR
8447779800, Low rate Call girls in Kotla Mubarakpur Delhi NCRashishs7044
 
Call Girls In Sikandarpur Gurgaon ❤️8860477959_Russian 100% Genuine Escorts I...
Call Girls In Sikandarpur Gurgaon ❤️8860477959_Russian 100% Genuine Escorts I...Call Girls In Sikandarpur Gurgaon ❤️8860477959_Russian 100% Genuine Escorts I...
Call Girls In Sikandarpur Gurgaon ❤️8860477959_Russian 100% Genuine Escorts I...lizamodels9
 
BEST Call Girls In Greater Noida ✨ 9773824855 ✨ Escorts Service In Delhi Ncr,
BEST Call Girls In Greater Noida ✨ 9773824855 ✨ Escorts Service In Delhi Ncr,BEST Call Girls In Greater Noida ✨ 9773824855 ✨ Escorts Service In Delhi Ncr,
BEST Call Girls In Greater Noida ✨ 9773824855 ✨ Escorts Service In Delhi Ncr,noida100girls
 
Call Girls Miyapur 7001305949 all area service COD available Any Time
Call Girls Miyapur 7001305949 all area service COD available Any TimeCall Girls Miyapur 7001305949 all area service COD available Any Time
Call Girls Miyapur 7001305949 all area service COD available Any Timedelhimodelshub1
 
Global Scenario On Sustainable and Resilient Coconut Industry by Dr. Jelfina...
Global Scenario On Sustainable  and Resilient Coconut Industry by Dr. Jelfina...Global Scenario On Sustainable  and Resilient Coconut Industry by Dr. Jelfina...
Global Scenario On Sustainable and Resilient Coconut Industry by Dr. Jelfina...ictsugar
 
The CMO Survey - Highlights and Insights Report - Spring 2024
The CMO Survey - Highlights and Insights Report - Spring 2024The CMO Survey - Highlights and Insights Report - Spring 2024
The CMO Survey - Highlights and Insights Report - Spring 2024christinemoorman
 
/:Call Girls In Indirapuram Ghaziabad ➥9990211544 Independent Best Escorts In...
/:Call Girls In Indirapuram Ghaziabad ➥9990211544 Independent Best Escorts In.../:Call Girls In Indirapuram Ghaziabad ➥9990211544 Independent Best Escorts In...
/:Call Girls In Indirapuram Ghaziabad ➥9990211544 Independent Best Escorts In...lizamodels9
 
Youth Involvement in an Innovative Coconut Value Chain by Mwalimu Menza
Youth Involvement in an Innovative Coconut Value Chain by Mwalimu MenzaYouth Involvement in an Innovative Coconut Value Chain by Mwalimu Menza
Youth Involvement in an Innovative Coconut Value Chain by Mwalimu Menzaictsugar
 
Call Girls In Sikandarpur Gurgaon ❤️8860477959_Russian 100% Genuine Escorts I...
Call Girls In Sikandarpur Gurgaon ❤️8860477959_Russian 100% Genuine Escorts I...Call Girls In Sikandarpur Gurgaon ❤️8860477959_Russian 100% Genuine Escorts I...
Call Girls In Sikandarpur Gurgaon ❤️8860477959_Russian 100% Genuine Escorts I...lizamodels9
 
Marketing Management Business Plan_My Sweet Creations
Marketing Management Business Plan_My Sweet CreationsMarketing Management Business Plan_My Sweet Creations
Marketing Management Business Plan_My Sweet Creationsnakalysalcedo61
 
Future Of Sample Report 2024 | Redacted Version
Future Of Sample Report 2024 | Redacted VersionFuture Of Sample Report 2024 | Redacted Version
Future Of Sample Report 2024 | Redacted VersionMintel Group
 
Annual General Meeting Presentation Slides
Annual General Meeting Presentation SlidesAnnual General Meeting Presentation Slides
Annual General Meeting Presentation SlidesKeppelCorporation
 
Digital Transformation in the PLM domain - distrib.pdf
Digital Transformation in the PLM domain - distrib.pdfDigital Transformation in the PLM domain - distrib.pdf
Digital Transformation in the PLM domain - distrib.pdfJos Voskuil
 
Intro to BCG's Carbon Emissions Benchmark_vF.pdf
Intro to BCG's Carbon Emissions Benchmark_vF.pdfIntro to BCG's Carbon Emissions Benchmark_vF.pdf
Intro to BCG's Carbon Emissions Benchmark_vF.pdfpollardmorgan
 
Lean: From Theory to Practice — One City’s (and Library’s) Lean Story… Abridged
Lean: From Theory to Practice — One City’s (and Library’s) Lean Story… AbridgedLean: From Theory to Practice — One City’s (and Library’s) Lean Story… Abridged
Lean: From Theory to Practice — One City’s (and Library’s) Lean Story… AbridgedKaiNexus
 
Kenya’s Coconut Value Chain by Gatsby Africa
Kenya’s Coconut Value Chain by Gatsby AfricaKenya’s Coconut Value Chain by Gatsby Africa
Kenya’s Coconut Value Chain by Gatsby Africaictsugar
 
VIP Kolkata Call Girl Howrah 👉 8250192130 Available With Room
VIP Kolkata Call Girl Howrah 👉 8250192130  Available With RoomVIP Kolkata Call Girl Howrah 👉 8250192130  Available With Room
VIP Kolkata Call Girl Howrah 👉 8250192130 Available With Roomdivyansh0kumar0
 
8447779800, Low rate Call girls in Saket Delhi NCR
8447779800, Low rate Call girls in Saket Delhi NCR8447779800, Low rate Call girls in Saket Delhi NCR
8447779800, Low rate Call girls in Saket Delhi NCRashishs7044
 
RE Capital's Visionary Leadership under Newman Leech
RE Capital's Visionary Leadership under Newman LeechRE Capital's Visionary Leadership under Newman Leech
RE Capital's Visionary Leadership under Newman LeechNewman George Leech
 

Recently uploaded (20)

8447779800, Low rate Call girls in Rohini Delhi NCR
8447779800, Low rate Call girls in Rohini Delhi NCR8447779800, Low rate Call girls in Rohini Delhi NCR
8447779800, Low rate Call girls in Rohini Delhi NCR
 
8447779800, Low rate Call girls in Kotla Mubarakpur Delhi NCR
8447779800, Low rate Call girls in Kotla Mubarakpur Delhi NCR8447779800, Low rate Call girls in Kotla Mubarakpur Delhi NCR
8447779800, Low rate Call girls in Kotla Mubarakpur Delhi NCR
 
Call Girls In Sikandarpur Gurgaon ❤️8860477959_Russian 100% Genuine Escorts I...
Call Girls In Sikandarpur Gurgaon ❤️8860477959_Russian 100% Genuine Escorts I...Call Girls In Sikandarpur Gurgaon ❤️8860477959_Russian 100% Genuine Escorts I...
Call Girls In Sikandarpur Gurgaon ❤️8860477959_Russian 100% Genuine Escorts I...
 
BEST Call Girls In Greater Noida ✨ 9773824855 ✨ Escorts Service In Delhi Ncr,
BEST Call Girls In Greater Noida ✨ 9773824855 ✨ Escorts Service In Delhi Ncr,BEST Call Girls In Greater Noida ✨ 9773824855 ✨ Escorts Service In Delhi Ncr,
BEST Call Girls In Greater Noida ✨ 9773824855 ✨ Escorts Service In Delhi Ncr,
 
Call Girls Miyapur 7001305949 all area service COD available Any Time
Call Girls Miyapur 7001305949 all area service COD available Any TimeCall Girls Miyapur 7001305949 all area service COD available Any Time
Call Girls Miyapur 7001305949 all area service COD available Any Time
 
Global Scenario On Sustainable and Resilient Coconut Industry by Dr. Jelfina...
Global Scenario On Sustainable  and Resilient Coconut Industry by Dr. Jelfina...Global Scenario On Sustainable  and Resilient Coconut Industry by Dr. Jelfina...
Global Scenario On Sustainable and Resilient Coconut Industry by Dr. Jelfina...
 
The CMO Survey - Highlights and Insights Report - Spring 2024
The CMO Survey - Highlights and Insights Report - Spring 2024The CMO Survey - Highlights and Insights Report - Spring 2024
The CMO Survey - Highlights and Insights Report - Spring 2024
 
/:Call Girls In Indirapuram Ghaziabad ➥9990211544 Independent Best Escorts In...
/:Call Girls In Indirapuram Ghaziabad ➥9990211544 Independent Best Escorts In.../:Call Girls In Indirapuram Ghaziabad ➥9990211544 Independent Best Escorts In...
/:Call Girls In Indirapuram Ghaziabad ➥9990211544 Independent Best Escorts In...
 
Youth Involvement in an Innovative Coconut Value Chain by Mwalimu Menza
Youth Involvement in an Innovative Coconut Value Chain by Mwalimu MenzaYouth Involvement in an Innovative Coconut Value Chain by Mwalimu Menza
Youth Involvement in an Innovative Coconut Value Chain by Mwalimu Menza
 
Call Girls In Sikandarpur Gurgaon ❤️8860477959_Russian 100% Genuine Escorts I...
Call Girls In Sikandarpur Gurgaon ❤️8860477959_Russian 100% Genuine Escorts I...Call Girls In Sikandarpur Gurgaon ❤️8860477959_Russian 100% Genuine Escorts I...
Call Girls In Sikandarpur Gurgaon ❤️8860477959_Russian 100% Genuine Escorts I...
 
Marketing Management Business Plan_My Sweet Creations
Marketing Management Business Plan_My Sweet CreationsMarketing Management Business Plan_My Sweet Creations
Marketing Management Business Plan_My Sweet Creations
 
Future Of Sample Report 2024 | Redacted Version
Future Of Sample Report 2024 | Redacted VersionFuture Of Sample Report 2024 | Redacted Version
Future Of Sample Report 2024 | Redacted Version
 
Annual General Meeting Presentation Slides
Annual General Meeting Presentation SlidesAnnual General Meeting Presentation Slides
Annual General Meeting Presentation Slides
 
Digital Transformation in the PLM domain - distrib.pdf
Digital Transformation in the PLM domain - distrib.pdfDigital Transformation in the PLM domain - distrib.pdf
Digital Transformation in the PLM domain - distrib.pdf
 
Intro to BCG's Carbon Emissions Benchmark_vF.pdf
Intro to BCG's Carbon Emissions Benchmark_vF.pdfIntro to BCG's Carbon Emissions Benchmark_vF.pdf
Intro to BCG's Carbon Emissions Benchmark_vF.pdf
 
Lean: From Theory to Practice — One City’s (and Library’s) Lean Story… Abridged
Lean: From Theory to Practice — One City’s (and Library’s) Lean Story… AbridgedLean: From Theory to Practice — One City’s (and Library’s) Lean Story… Abridged
Lean: From Theory to Practice — One City’s (and Library’s) Lean Story… Abridged
 
Kenya’s Coconut Value Chain by Gatsby Africa
Kenya’s Coconut Value Chain by Gatsby AfricaKenya’s Coconut Value Chain by Gatsby Africa
Kenya’s Coconut Value Chain by Gatsby Africa
 
VIP Kolkata Call Girl Howrah 👉 8250192130 Available With Room
VIP Kolkata Call Girl Howrah 👉 8250192130  Available With RoomVIP Kolkata Call Girl Howrah 👉 8250192130  Available With Room
VIP Kolkata Call Girl Howrah 👉 8250192130 Available With Room
 
8447779800, Low rate Call girls in Saket Delhi NCR
8447779800, Low rate Call girls in Saket Delhi NCR8447779800, Low rate Call girls in Saket Delhi NCR
8447779800, Low rate Call girls in Saket Delhi NCR
 
RE Capital's Visionary Leadership under Newman Leech
RE Capital's Visionary Leadership under Newman LeechRE Capital's Visionary Leadership under Newman Leech
RE Capital's Visionary Leadership under Newman Leech
 

Quarterly Employment Statistics (QES), December 2018

  • 2. QES Q4:2018 QES Background 02 01 04 03 QES is an enterprise-based sample survey QES collects information on employing businesses registered for VAT with annual turnover greater than R300 000 R300 000 Samples are drawn from private non-agricultural businesses e.g. Factories, offices, stores as well as national, provincial and local government entities Sample size of approximately 20 000 was selected
  • 3. QES Q4:2018 QES Coverage INCLUDES EXCLUDES 2 *Mining & quarrying 3 4 5 6 7 8 9 Manufacturing Electricity, gas and water supply Construction Wholesale trade, retail trade, motor trade and hotels and restaurants Transport, Storage & Communication Business services Community & personal services Agriculture, hunting, forestry and fishing The informal business sector Domestic services * Administrative data from DMR
  • 4. QES Q4:2018 4 Number of employees as at the last month of the reference quarter Average monthly earnings for the middle month of the reference quarter Gross earnings for the three months of the reference quarter Estimates are published on a quarter lag (SDDS) QES Variables
  • 6. QES Q4:2018 75 000 69 000 53 000 38 000 32 000 16 000 0 -1000-10 000 0 10 000 20 000 30 000 40 000 50 000 60 000 70 000 80 000 Business services Trade Community services Construction Manufacturing Transport Mining Electricity The employment estimates produced by the 2018 sample for June quarter were greater than the 2017 employment estimates in all sectors except Mining and Electricity. The estimate was 282 000 higher compared to 2017 sample estimates which was 9 749 000 in the same period. Difference in QES 2017 and 2018 estimates as at June 2018 quarter
  • 7. QES Q4:2018 The employment estimates produced by the 2018 sample for Sept quarter were greater than the 2017 employment estimates in all sectors except Mining and Electricity. The estimate was 293 000 higher compared to 2017 sample estimates which was 9 771 000 in the same period. Difference in QES 2017 and 2018 estimates as at September 2018 quarter 80 000 72 000 55 000 34 000 31 000 21 000 0 0 0 10 000 20 000 30 000 40 000 50 000 60 000 70 000 80 000 90 000 Business services Trade Community services Manufacturing Construction Transport Mining Electricity
  • 9. QES Q4:2018 Numberofemployees (Thousands) The estimates for the June 2018 quarter were linked to the 2017 sample estimate. The difference between the two estimates was 282 000 in June 2018 quarter and 293 000 in September 2018 quarter. 9 734 9 749 9 772 9 799 10 032 10 065 7 500 8 000 8 500 9 000 9 500 10 000 10 500 2017Q2 2017Q3 2017Q4 2018Q1 2018Q2 2018Q3 Revised estimates 2018 sample 2017 sample 2018 sample: Linked series (revised estimates)
  • 10. QES Q4:2018 Why is there a difference in employment and gross earnings levels 2018 and 2017 samples? Small businesses growing to the extent that they are now captured in the registration process; o greater compliance with administrative requirements to register as an employer (Business Sampling Frame rose by 1.5% in February 2017 compared with February 2018) The higher employment and earnings estimates from the 2018 sample may be attributed, though not limited to, the following:
  • 11. QES Q4:2018 The series was linked from sub-sector reporting level, and aggregated to industry level Only 4 quarters were linked to the series (i.e. Q2:2017, Q3:2017, Q4:2017, and Q1:2018) Methodology
  • 13. QES Q4:2018 Q4:2018 EMPLOYMENT RESULTS 10,151M 1,6% Y/Y 158 000 0,9% Q/Q 87 000 The total number of persons employed increased from 10,064M in Q3:2018 Jobs increased by 158 000 (or 1,6%) in the reference quarter compared with the same quarter of 2017 (Q4:2017). There was a quarterly increase of 87 000 jobs (or 0,9%) in the Q4:2018 compared with Q3:2018.
  • 14. QES Q4:2018 Q4:2018 EMPLOYMENT COMPOSITION FULL TIME 9,086M PART TIME 1,065M Part-time employees are those permanent, temporary or casual employees who work less than 40 hours per week. Full-time employees are those permanent, temporary and casual employees who normally work 40 hours or more per week. 90% 10%
  • 15. QES Q4:2018 55 24 -1 3 -1 -3 -7 -20 50 -2 25 10 2 0 0 0 2 37 Businessservices Trade Communityservices Transport Electricity Manufacturing Mining Construction Total Full-time Part-time Quarter-to-quarter employment change Full-time jobs rose by 50 000 and part-time by 37 000. Business services industry showed an increase of 53 000 in employment for the quarter ended in December 2018, followed by trade industry with 49 000 employees. A combined total of 29 000 jobs were lost in the construction, mining, manufacturing and electricity industries. Numberofemployees (Thousands)
  • 16. QES Q4:2018 88 45 17 5 5 -1 -8 -17 134 -11 10 15 2 0 0 0 8 24 Businessservices Trade Communityservices Transport Manufacturing Electricity Mining Construction Total Full Time Part Time Year-on-year employment change There was an annual increase of 158 000 jobs in Q4:2018 compared with Q4:2017. Business services industry recorded the highest increase in employment in the fourth quarter compared with the same quarter in 2017. Construction, mining and electricity industries lost a combined total of 18 000 jobs in Q4:2018 compared with Q4:2017. Full-time employees contributed the most jobs. Numberofemployees (Thousands)
  • 17. QES Q4:2018 PERCENTAGE CHANGE IN EMPLOYMENT Quarterly and annual changes in employment in the fourth quarter of 2018. 2,3% 2,2% 1,0% 0,3% -0,2% -1,5% -1,6% -2,8% 0,9% -4,0 -3,0 -2,0 -1,0 0,0 1,0 2,0 3,0 Business services Trade Transport Community services Manufacturing Mining Electricity Construction Total Quarter-on-quarter 3,4% 2,5% 1,5% 1,2% 0,4% -1,4% -1,6% -1,8% 1,6% - 3,0 - 2,0 - 1,0 0,0 1,0 2,0 3,0 4,0 Business services Trade Transport Community services Manufacturing Construction Electricity Mining Total Year-on-year
  • 18. QES Q4:2018 * Revised estimates 489 459 456 471 456 449 420 430 440 450 460 470 480 490 500 JUN SEP DEC MAR JUN SEP DEC MAR JUN SEP DEC MAR JUN SEP* DEC 2015 2016 2017 2018 THOUSANDS Number of employees in the Mining and Quarrying Industry The mining industry continues to shed jobs, reaching its lowest level at 449 000 in Q4:2018. There was a quarterly decrease of 7 000 jobs compared with Q3:2018 from 456 000. The industry lost 8 000 jobs compared in the fourth quarter of 2017. Numberofemployees
  • 19. QES Q4:2018 * Revised estimates There’s an upward trend shown in the trade industry with 49 000 additional jobs in the fourth quarter following a moderate gain in the third quarter of 2018. Year-on-year the industry gained 55 000 jobs compared with same quarter of 2017. Number of employees in the Trade Industry 1 926 2 062 2 131 2 206 2 212 2 261 JUN SEP DEC MAR JUN SEP DEC MAR JUN* SEP* DEC* MAR* JUN* SEP* DEC 2015 2016 2017 2018 Numberofemployees Thousands
  • 20. QES Q4:2018 2 545 2 659 2 698 2 751 2 681 2 684 2 693 JUN SEP DEC MAR JUN SEP DEC MAR JUN* SEP* DEC* MAR* JUN* SEP* DEC 2015 2016 2017 2018 Numberofemployees Thousands Number of employees in the Community Services Industry The Community service industry reported an increase of 9 000 jobs in the fourth quarter. Year-on-year the industry gained 32 000 jobs in Q4:2018 compared with same quarter of previous year. Increase was due to appointment of casual workers for the election registration drive in Q1:2016 Increase was due to appointment of casual workers for local government election in Q3:2016 Increase due to appointment of casual workers for the upcoming 2019 national election registration drive. * Revised estimates
  • 21. QES Q4:2018 * Revised estimates 9 293 9 702 10 098 10 064 10 151 8 800 9 000 9 200 9 400 9 600 9 800 10 000 10 200 10 400 Jun Sep Dec Mar Jun Sep Dec Mar Jun* Sep* Dec* Mar* Jun* Sep Dec 2015 2016 2017 2018 THOUSANDS Employment growth over time from June 2015 to December 2018 Employment time-series from 2015. The number of jobs increased by nearly 900 thousand from 9,3 million in second quarter of 2015 to 10,2 million in the last quarter of 2018.
  • 22. QES Q4:2018 Q4:2018 GROSS EARNINGS RESULTS R725bn Total gross earnings paid in the quarter (from R685 billion in 2018:Q3). 6,9% Y/Y R47 billion Increases in gross earnings may be due to salary increases, bonus and overtime payments paid in the current quarter. 5,8% Q/Q R40 billion
  • 23. QES Q4:2018 Q4:2018 GROSS EARNINGS COMPOSITION R725bn 13% 87% Bonus and overtime payments R95bn Basic salary/wages R630bn
  • 24. QES Q4:2018 Quarter-on-quarter Gross earnings (R' 000) Industry Basic Salary/Wages Bonus & Overtime Payments Total Gross Earnings Trade 2 233 000 8 749 000 10 982 000 Business services 3 692 000 3 365 000 7 057 000 Manufacturing 997 000 7 247 000 8 244 000 Community services -2 892 000 8 409 000 5 517 000 Construction -182 000 3 687 000 3 505 000 Transport 490 000 2 077 000 2 567 000 Electricity 136 000 1 381 000 1 517 000 Mining 544 000 544 000 Total 5 018 000 34 915 000 39 933 000 Quarter-on-quarter gains Increases in gross earnings was due to salary increases (R5 billion), bonuses and overtime payments (R35 billion) paid in the fourth quarter of 2018.
  • 25. QES Q4:2018 Year-on-year Gross earnings (R' 000) Industry Basic Salary/Wages Bonus & Overtime Payments Total Gross Earnings Community services 15 674 000 3 983 000 19 657 000 Business services 7 479 000 4 916 000 12 395 000 Trade 5 710 000 1 264 000 6 974 000 Manufacturing 3 054 000 738 000 3 792 000 Mining 1 861 000 1 861 000 Transport 1 955 000 -260 000 1 695 000 Electricity 432 000 405 000 837 000 Construction 261 000 -869 000 -608 000 Total 36 426 000 10 177 000 46 603 000 Increases in gross earnings was due to salary increases (R36 billion), bonuses and overtime payments (R10 billion) paid in the fourth quarter of 2018. Year-on-year gains
  • 26. QES Q4:2018 PERCENTAGE CHANGE IN GROSS EARNINGS Changes in quarterly and annual changes in gross earnings paid in the fourth quarter of 2018. 18,7% 12,0% 11,3% 10,9% 6,7% 3,9% 2,4% 1,6% 5,8% 0,0 5,0 10,0 15,0 20,0 Electricity Manufacturing Trade Construction Transport Business services Community services Mining Total Quarter-on-quarter 9,5% 9,3% 7,0% 6,9% 5,7% 5,2% 4,3% -1,7% 6,9% - 5,0 0,0 5,0 10,0 Electricity Community services Business services Trade Mining Manufacturing Transport Construction Total Year-on-year
  • 27. QES Q4:2018 PERCENTAGE CHANGE IN GROSS EARNINGS Changes in quarterly and annual changes in gross earnings paid in the fourth quarter of 2018. 18,7% 12,0% 11,3% 10,9% 6,7% 3,9% 2,4% 1,6% 5,8% 0,0 5,0 10,0 15,0 20,0 Electricity Manufacturing Trade Construction Transport Business services Community services Mining Total Quarter-on-quarter 9,5% 5,2% 6,9% -1,7% 4,3% 7,0% 9,3% 5,7% 6,9% -4,0% -2,0% 0,0% 2,0% 4,0% 6,0% 8,0% 10,0% 12,0% Electricity Manufacturing Trade Construction Transport Business Services Community Services Mining Total Year-on-year
  • 28. QES Q4:2018 Grossearnings R’billion * Revised estimates 500 685 725 0 100 200 300 400 500 600 700 800 JUN SEP DEC MAR JUN SEP DEC MAR JUN* SEP* DEC* MAR* JUN* SEP* DEC 2015 2016 2017 2018 Gross earnings have steadily trended upwards since 2015. Changes in gross earnings observed from June 2015 to December 2018 The gross earnings increased by R225 billion (or 45.0%) from R500 billion in second quarter of 2015 to R725 billion at the end of 2018.
  • 30. QES Q4:2018 NOVEMBER 2018: AVERAGE MONTHLY EARNINGS (AME) R21 190 AME including bonuses and overtime payments paid in November 2018 remained unchanged (R21 192 August 2018) Quarter-on-quarter AME remained unchanged and year-on-year there was an increase of 4,9% 0% Y/Y 4,9%
  • 31. QES Q4:2018 5,4% 2,0% 0,6% 0,5% 0,0% -0,5% -0,3% -1,1% -1,6% - 2,0 0,0 2,0 4,0 6,0 Electricity Mining Community services Manufacturing Total Transport Business services Trade Construction Q/Q Y/Y There was an increase in average monthly earnings for 4 of 8 industries in the fourth quarter compared with quarter three. Year-on-year there was an increase in November 2018 compared with November 2017. November 2018: average monthly earnings 10,4% 8,2% 8,0% 4,8% 4,9% 5,0% 3,6% 3,4% 0,4% 0,0% 5,0% 10,0% 15,0% Electricity Mining Community Services Manufacturing Total Transport Business Services Trade Construction