Download to read offline

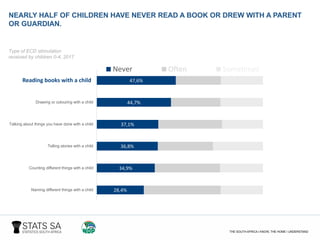
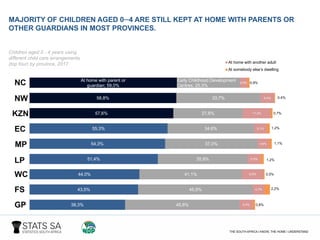
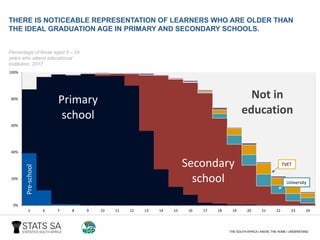
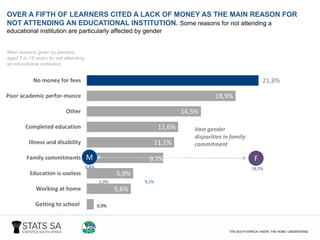
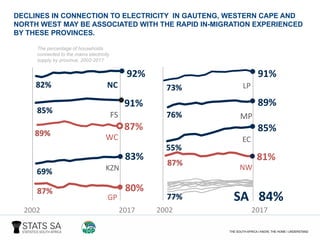
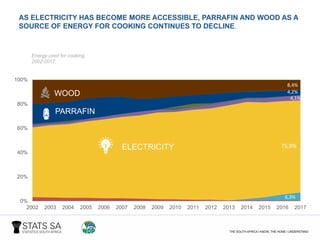
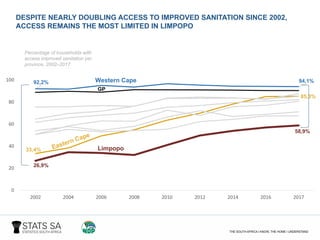
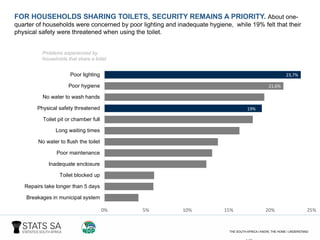
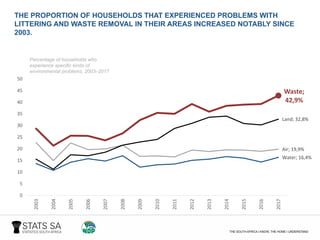
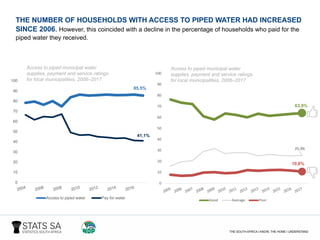

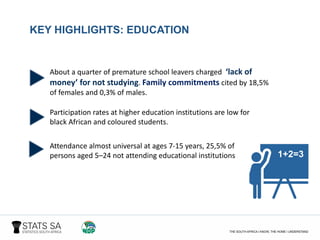
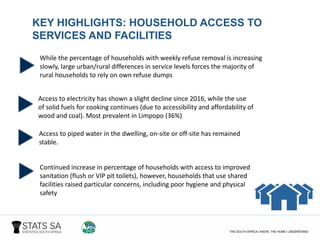
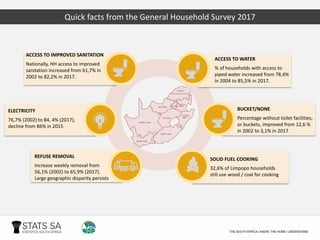

The document provides statistics from the 2017 General Household Survey conducted by StatsSA. Some key findings include: - Nearly half of children aged 0-4 have never participated in early childhood development activities like reading, drawing or counting with parents. - The majority of children aged 0-4 are still cared for at home, though early childhood development centers are becoming more common. - Lack of money was cited as the main reason over 20% of youth aged 7-18 did not attend school. - Access to services like electricity, water and sanitation have increased from 2002-2017 but still have room for improvement, especially in rural areas. - Waste removal and litter are common environmental problems reported across South


![Casale et al_r_fbrief06[1]](https://cdn.slidesharecdn.com/ss_thumbnails/casaleetalrfbrief061-100908043139-phpapp01-thumbnail.jpg?width=640&height=640&fit=bounds)