Detroit Q3 2018 Industrial Market Report
•
1 like•54 views

Colliers International Detroit Industrial Market Report Q3 2018 David Abraham, MAI SRA Associate Managing Director | Detroit, Valuation & Advisory Services Valuation & Advisory Services Direct +1 734 674 9505 Main +1 248 540 1000 | Fax +1 248 226 1873 david.abraham@colliers.com

Recommended
Recommended
More Related Content
What's hot
What's hot (18)
Similar to Detroit Q3 2018 Industrial Market Report
Similar to Detroit Q3 2018 Industrial Market Report (20)
Recently uploaded
Recently uploaded (20)
Detroit Q3 2018 Industrial Market Report
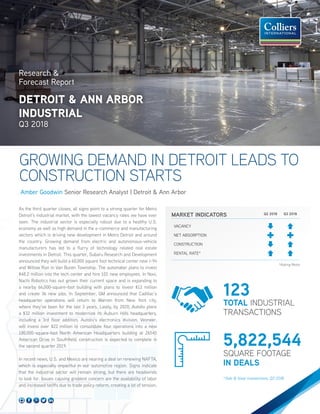
- 1. *Sale & lease transactions, Q3 2018. Research & Forecast Report DETROIT & ANN ARBOR INDUSTRIAL Q3 2018 As the third quarter closes, all signs point to a strong quarter for Metro Detroit’s industrial market, with the lowest vacancy rates we have ever seen. The industrial sector is especially robust due to a healthy U.S. economy as well as high demand in the e-commerce and manufacturing sectors which is driving new development in Metro Detroit and around the country. Growing demand from electric and autonomous-vehicle manufacturers has led to a flurry of technology related real estate investments in Detroit. This quarter, Subaru Research and Development announced they will build a 60,000 square foot technical center near I-94 and Willow Run in Van Buren Township. The automaker plans to invest $48.2 million into the tech center and hire 101 new employees. In Novi, Nachi Robotics has out grown their current space and is expanding to a nearby 66,000-square-foot building with plans to invest $12 million and create 36 new jobs. In September, GM announced that Cadillac’s headquarter operations will return to Warren from New York city, where they’ve been for the last 3 years. Lastly, by 2020, Autoliv plans a $32 million investment to modernize its Auburn Hills headquarters, including a 3rd floor addition. Autoliv’s electronics division, Veoneer, will invest over $22 million to consolidate four operations into a new 180,000-square-foot North American Headquarters building at 26545 American Drive in Southfield; construction is expected to complete in the second quarter 2019. In recent news, U.S. and Mexico are nearing a deal on renewing NAFTA, which is especially impactful in our automotive region. Signs indicate that the industrial sector will remain strong, but there are headwinds to look for. Issues causing greatest concern are the availability of labor and increased tariffs due to trade policy reform, creating a lot of tension. GROWING DEMAND IN DETROIT LEADS TO CONSTRUCTION STARTS Amber Goodwin Senior Research Analyst | Detroit & Ann Arbor 123 TOTAL INDUSTRIAL TRANSACTIONS 5,822,544 SQUARE FOOTAGE IN DEALS MARKET INDICATORS VACANCY NET ABSORPTION CONSTRUCTION RENTAL RATE* Q2 2018 Q3 2018 *Asking Rents
- 2. TOTAL FLEX WAREHOUSE 2 Detroit & Ann Arbor Research & Forecast Report | Q3 2018 | Industrial | Colliers International TOTAL FLEX WAREHOUSE QUOTED RENTAL RATES OVERALL MARKET OCCUPANCY RATE OVERALL MARKET PROPERTY CITY SUBMARKET SIZE OF DEAL BUYER NAME PRICE 43800 Gen-Mar Drive Novi I-96 Corridor 439,150 STAG Industrial, Inc. $47.82 5025 Venture Drive Ann Arbor Washtenaw 25,260 5025 Venture Drive LLC $101.35 12499 Evergreen Avenue (Industrial Cold Storage) Detroit Detroit East Area 303,383 AIC Ventures $54.77 12163 Globe Street Livonia Airport / I-275 55,000 Linear AMS $60.00 SALES PROPERTY CITY SUBMARKET SIZE OF DEAL TENANT NAME 19661 Brownstown Center Dr Brownstown Airport / I-275 272,228 Westrock Corrugated 24680 Mound Road Warren East Area 86,422 Federal Resources Supply Company 8555-8625 Inkster Road Taylor Downriver 70,000 Production Management One Inc. 740 Advance Street Brighton I-96 Corridor 71,170 Unified Industries LEASES Notes on the Market VACANCY & ABSORPTION The total industrial vacancy in Metro Detroit was 3.2% for the third quarter of 2018. The warehouse vacancy rate was 2.9%. The biggest constraints in the warehouse market is in the East Area where the vacancy rate was 2.1% and in the Airport/I-275 submarket which is currently 3.2% vacant. The total vacancy rate for flex product was 6%. The Washtenaw/Ann Arbor area, a highly driven technology market, has the lowest flex vacancy rate at 2.3%. Demand in our region has pushed vacancies to a level we have never witnessed before. Net absorption in the third quarter was a positive 631,538 square feet. The largest leases signed this quarter were for warehouse distribution buildings. Westrock Corrugated signed a lease for 272,288 square feet at 19661 Brownstown Center Drive in the downriver industrial submarket. Penske Logistics, a transportation services company, moved into their 590,000 square foot preleased warehouse space in Ashley Capital’s newly constructed 745,694 square-foot warehouse at Livonia Corporate Center. RENTAL RATES Rental rates continue to tick upward, and leasing activity remains strong in the Detroit market. Activity surrounding lease renewals continues as occupiers are renewing at their existing locations due to the space constraints within the market. Leases are often being signed at full market asking rates with minimal concessions as the market remains in favor of the landlord. The average quoted rental rate for the total industrial market rose to $6.07 per square foot at the end of the third quarter of 2018, an increase from $5.94 at the end of the second quarter 2018. The average quoted rental rate for flex space in the third quarter was $9.57 per square foot, compared to $9.29 in the second quarter. The average quoted rental rate for warehouse space in the third quarter was $5.60 per square foot, compared to $5.46 per square foot in the second quarter. SALES ACTIVITY There were 82 industrial and flex sales transactions in the third quarter totaling 3,791,919 square feet. Investors continue to find deal value in Metro Detroit with the average sale price at $48 per square foot in the total industrial sector, compared to the U.S. average of $80 per square foot. The largest industrial building which sold this quarter was in Novi. STAG Industrial Holdings LLC purchased 43800 Gen-Mar, a 439,150 square foot distribution building for $47.82 per square foot. The building is currently leased to CVS with a reported lease rate of $3.20 per square foot, NNN. In Ann Arbor, 5025 Venture Drive, a flex building of 25,260 square feet, sold for $101.35 per square foot. CONSTRUCTION ACTIVITY Construction and labor costs weigh on the minds of local developers. Developers are pursuing land development and unique redevelopment opportunities and feeling confident as most projects are met with preleasing activity, with buildings greater than 100,000 square feet being 100% leased by the time they deliver. In Metro Detroit, there is currently 7,028,371 square feet under construction in 51 buildings, with 70.3% being preleased at delivery. The market delivered 1,344,194 square feet and construction starts are up to 1.7 million square feet the third quarter 2018, compared to 600,000 square feet that started in the second quarter. NOTABLE INDUSTRIAL DEALS
- 3. 3 Detroit & Ann Arbor Research & Forecast Report | Q3 2018 | Industrial | Colliers International BY THE NUMBERSINDUSTRIAL MARKET > Q3 > 2018 FLEX MARKET STATISTICS AIRPORT / I-275 DETROIT AREA DOWNRIVER EAST AREA I-96 CORRIDOR OAKLAND COUNTY NW ROYAL OAK / SOUTHFIELD TROY AREA WASHTENAW TOTALS EXISTING INVENTORY NO. OF BUILDINGS 253 71 17 140 302 175 105 142 164 1,460 TOTAL INVENTORY 11,138,916 2,255,122 893,232 4,680,738 9,033,029 8,140,791 3,148,117 4,494,003 8,127,701 54,059,067 VACANCY DIRECT SF 579,149 161,052 49,845 155,800 465,696 736,280 303,189 274,512 187,562 3,147,338 TOTAL SF 655,912 161,052 49,845 155,800 477,227 736,280 303,189 306,782 187,562 3,267,902 VACANCY % 5.9% 7.1% 5.6% 3.3% 5.3% 9.0% 9.6% 6.8% 2.3% 6.0% YTD NET ABSORPTION 58,470 39,400 2,996 (27,418) 266,777 48,502 (30,635) (24,453) 103,654 432,230 YTD DELIVERIES 0 0 0 0 0 0 0 0 44,525 44,525 UNDER CONSTRUCTION SF 118,785 0 0 22,165 0 0 180,000 0 0 330,950 QUOTED RATES $9.50 $12.98 $7.35 $6.84 $10.11 $9.41 $10.37 $10.97 $14.38 $9.57 WAREHOUSE MARKET STATISTICS AIRPORT / I-275 DETROIT AREA DOWNRIVER EAST AREA I-96 CORRIDOR OAKLAND COUNTY NW ROYAL OAK / SOUTHFIELD TROY AREA WASHTENAW TOTALS EXISTING INVENTORY NO. OF BUILDINGS 2,923 1,852 685 4,034 1,833 1,270 1,095 1,301 714 17,289 TOTAL INVENTORY 118,553,915 86,387,088 49,201,668 120,460,839 48,142,970 45,218,439 16,966,944 26,447,362 22,447,000 593,700,523 VACANCY DIRECT SF 3,709,179 3,451,953 738,346 2,473,641 1,399,133 1,497,737 592,847 634,408 571,005 16,759,899 TOTAL SF 3,839,364 3,497,653 738,346 2,473,641 1,414,933 1,867,941 592,847 634,408 574,805 17,386,671 VACANCY % 3.2% 4.0% 1.5% 2.1% 2.9% 4.1% 3.5% 2.4% 2.6% 2.9% YTD NET ABSORPTION (25,,969) 197,139 282,250 149,135 14,306 305,616 (58,113) (249,558) (32,809) 1,323,744 YTD DELIVERIES 1,194,095 0 0 750,850 213,261 136,000 0 0 15,200 3,393,964 UNDER CONSTRUCTION SF 2,281,194 530,000 79,580 1,953,216 649,685 392,540 651,610 6,734 77,840 6,697,421 QUOTED RATES $5.48 $4.67 $4.24 $6.02 $6.57 $6.22 $6.07 $6.71 $7.35 $5.60 TOTAL MARKET STATISTICS AIRPORT / I-275 DETROIT AREA DOWNRIVER EAST AREA I-96 CORRIDOR OAKLAND COUNTY NW ROYAL OAK / SOUTHFIELD TROY AREA WASHTENAW TOTALS EXISTING INVENTORY NO. OF BUILDINGS 3,176 1,923 702 4,174 2,135 1,445 1,200 1,443 878 18,749 TOTAL INVENTORY 129,692,831 88,642,210 50,094,900 125,141,577 57,175,999 53,359,230 20,115,061 30,941,365 30,574,701 647,759,590 VACANCY DIRECT SF 4,288,328 3,613,005 788,191 2,629,441 1,864,829 2,234,017 896,036 908,920 758,567 19,907,237 TOTAL SF 4,495,276 3,658,705 788,191 2,629,441 1,892,160 2,604,221 896,036 941,190 762,367 20,654,573 VACANCY % 3.5% 4.1% 1.6% 2.1% 3.3% 4.9% 4.5% 3.0% 2.5% 3.2% YTD NET ABSORPTION (197,499) 236,539 285,246 121,717 281,083 354,118 (88,748) (274,011) 70,845 1,755,974 YTD DELIVERIES 1,194,095 0 0 750,850 213,261 136,000 0 0 59,725 3,438,489 UNDER CONSTRUCTION SF 2,409,979 530,000 79,580 1,975,381 649,685 392,540 831,610 6,734 77,840 7,028,371 QUOTED RATES $5.89 $4.88 $4.28 $6.05 $7.28 $6.97 $7.22 $7.75 $8.99 $6.07
- 4. 4 Copyright © 2018 Colliers International. The information contained herein has been obtained from sources deemed reliable. While every reasonable effort has been made to ensure its accuracy, we cannot guarantee it. No responsibility is assumed for any inaccuracies. Readers are encouraged to consult their professional advisors prior to acting on any of the material contained in this report. Colliers International | Detroit 2 Corporate Drive, Suite 300 Southfield, MI +1 248 540 1000 colliers.com/detroit COLLIERSINTERNATIONAL2018STATISTICS Amber Goodwin Senior Research Analyst Detroit & Ann Arbor +1 248 540 1000 Ext. 1624 amber.goodwin@colliers.com FOR MORE INFORMATION Paul Choukourian, CCIM Executive Managing Director Detroit & Ann Arbor +1 248 540 1000 Ext. 1622 paul.choukourian@colliers.com CONSTRUCTION ACTIVITY CONTINUED Most notable is the ground breaking of industrial/warehouse developer Ashley Capital’s, 569,382 square foot speculative industrial building in the East Area submarket, which is set to deliver in August 2019. Asking rates for this development are $6.95 per square foot, NNN. In a market so tight, we expect this speculative construction will not sit vacant for long. In April, Ashley Capital purchased the former 95-acre Hazel Park Raceway for redevelopment. Work has begun to demolish the horse track and begin construction preparation to develop two new industrial buildings on this site. The project is slated for a 650,000-square- foot speculative building and a larger building, of undetermined size. Developer costs, for shell warehouse buildings, are typically $50-$75 per square foot. Occupiers should plan on additional costs for interior finishes, mechanical, electrical, and plumbing improvements. 2018 REVIEW »» Strong global economy drives demand for distribution and warehouse space, in part due to technology advances including e-commerce, changing consumer habits »» Record low vacancy rates, record high asking rents and positive absorption »» Detroit is becoming a hub for tech talent and technology related companies »» The outcome of impending tariff regulations weigh on our minds 2018 OUTLOOK »» Michigan is a great place to do business, the overall industrial sector expected to remain healthy for the remainder of 2018 »» Occupiers and Investors are eager to tap into Detroit because of economic incentives, access to a diverse talent pool, and automotive resources »» New speculative construction is met with optimism »» The state and local colleges join forces to develop our local labor pool and continue to attract new business opportunities to the region »» Optimism surrounding industrial real estate in Detroit and our nation remains high despite the brewing trade war between the United States and China »» Tightness in labor markets with truck drivers and mechanical engineers remaining in high demand All statistics are for 2018, are in U.S. dollars and include affiliates.