Downloaded 18 times
![Qcl 14-v3 [flow charts]-[nitie mumbai]_[pramesh anuragi]](https://image.slidesharecdn.com/qcl-14-v3flowchartsnitiemumbaiprameshanuragi-150115135242-conversion-gate02/75/Qcl-14-v3-flow-charts-nitie-mumbai-_-pramesh-anuragi-14-2048.jpg)

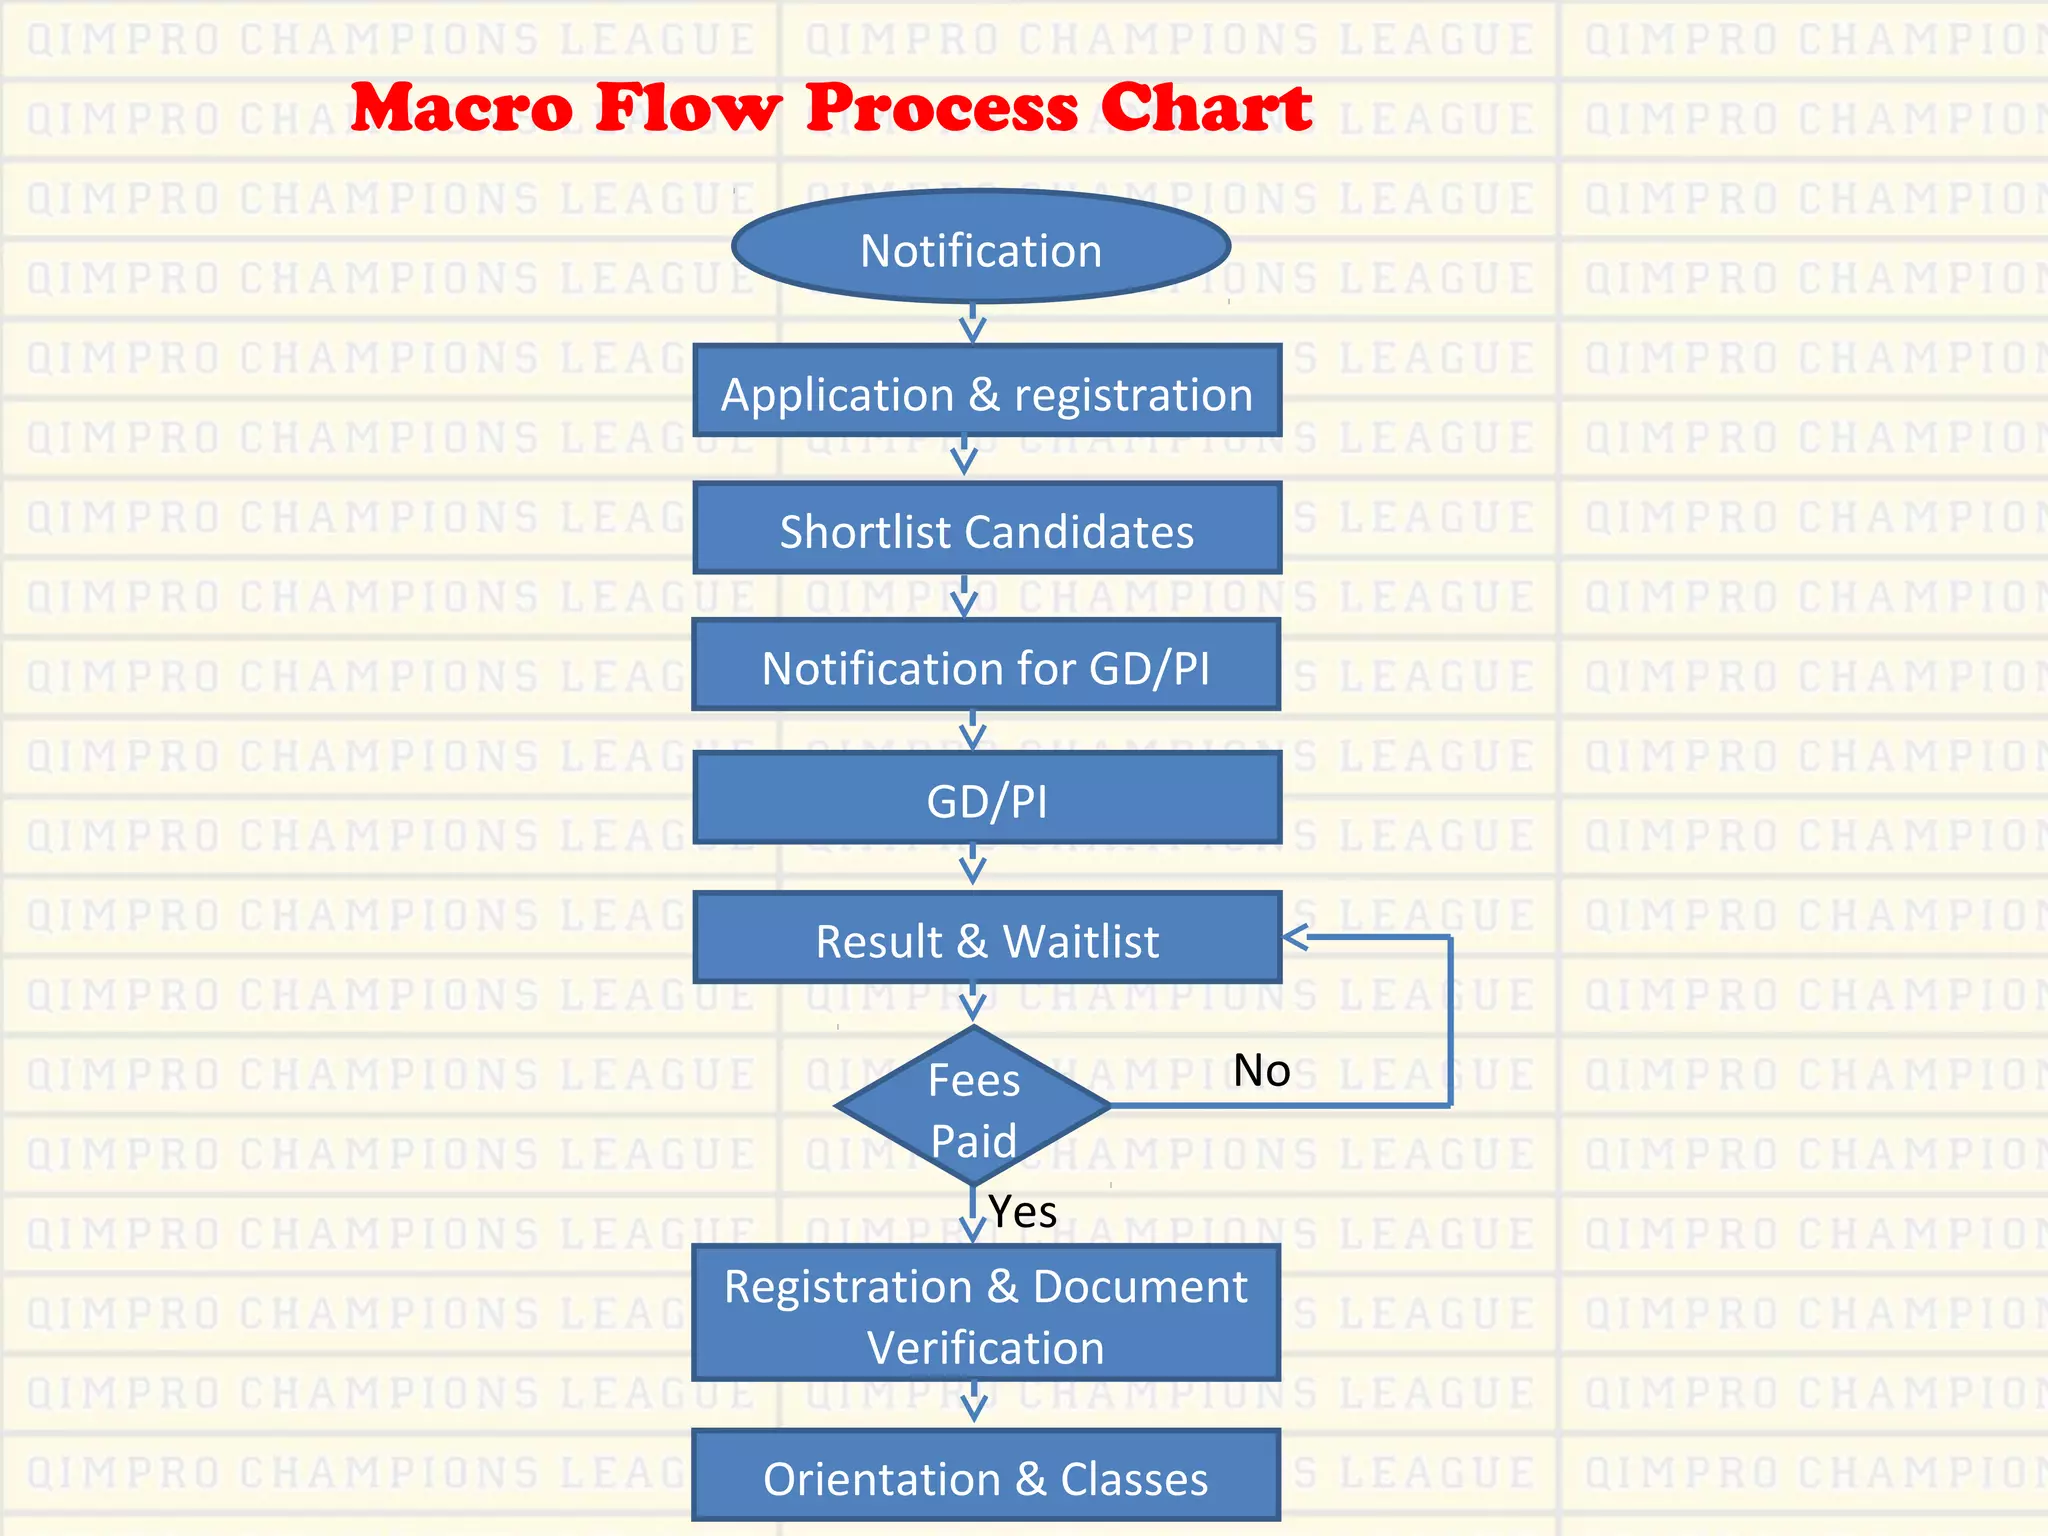
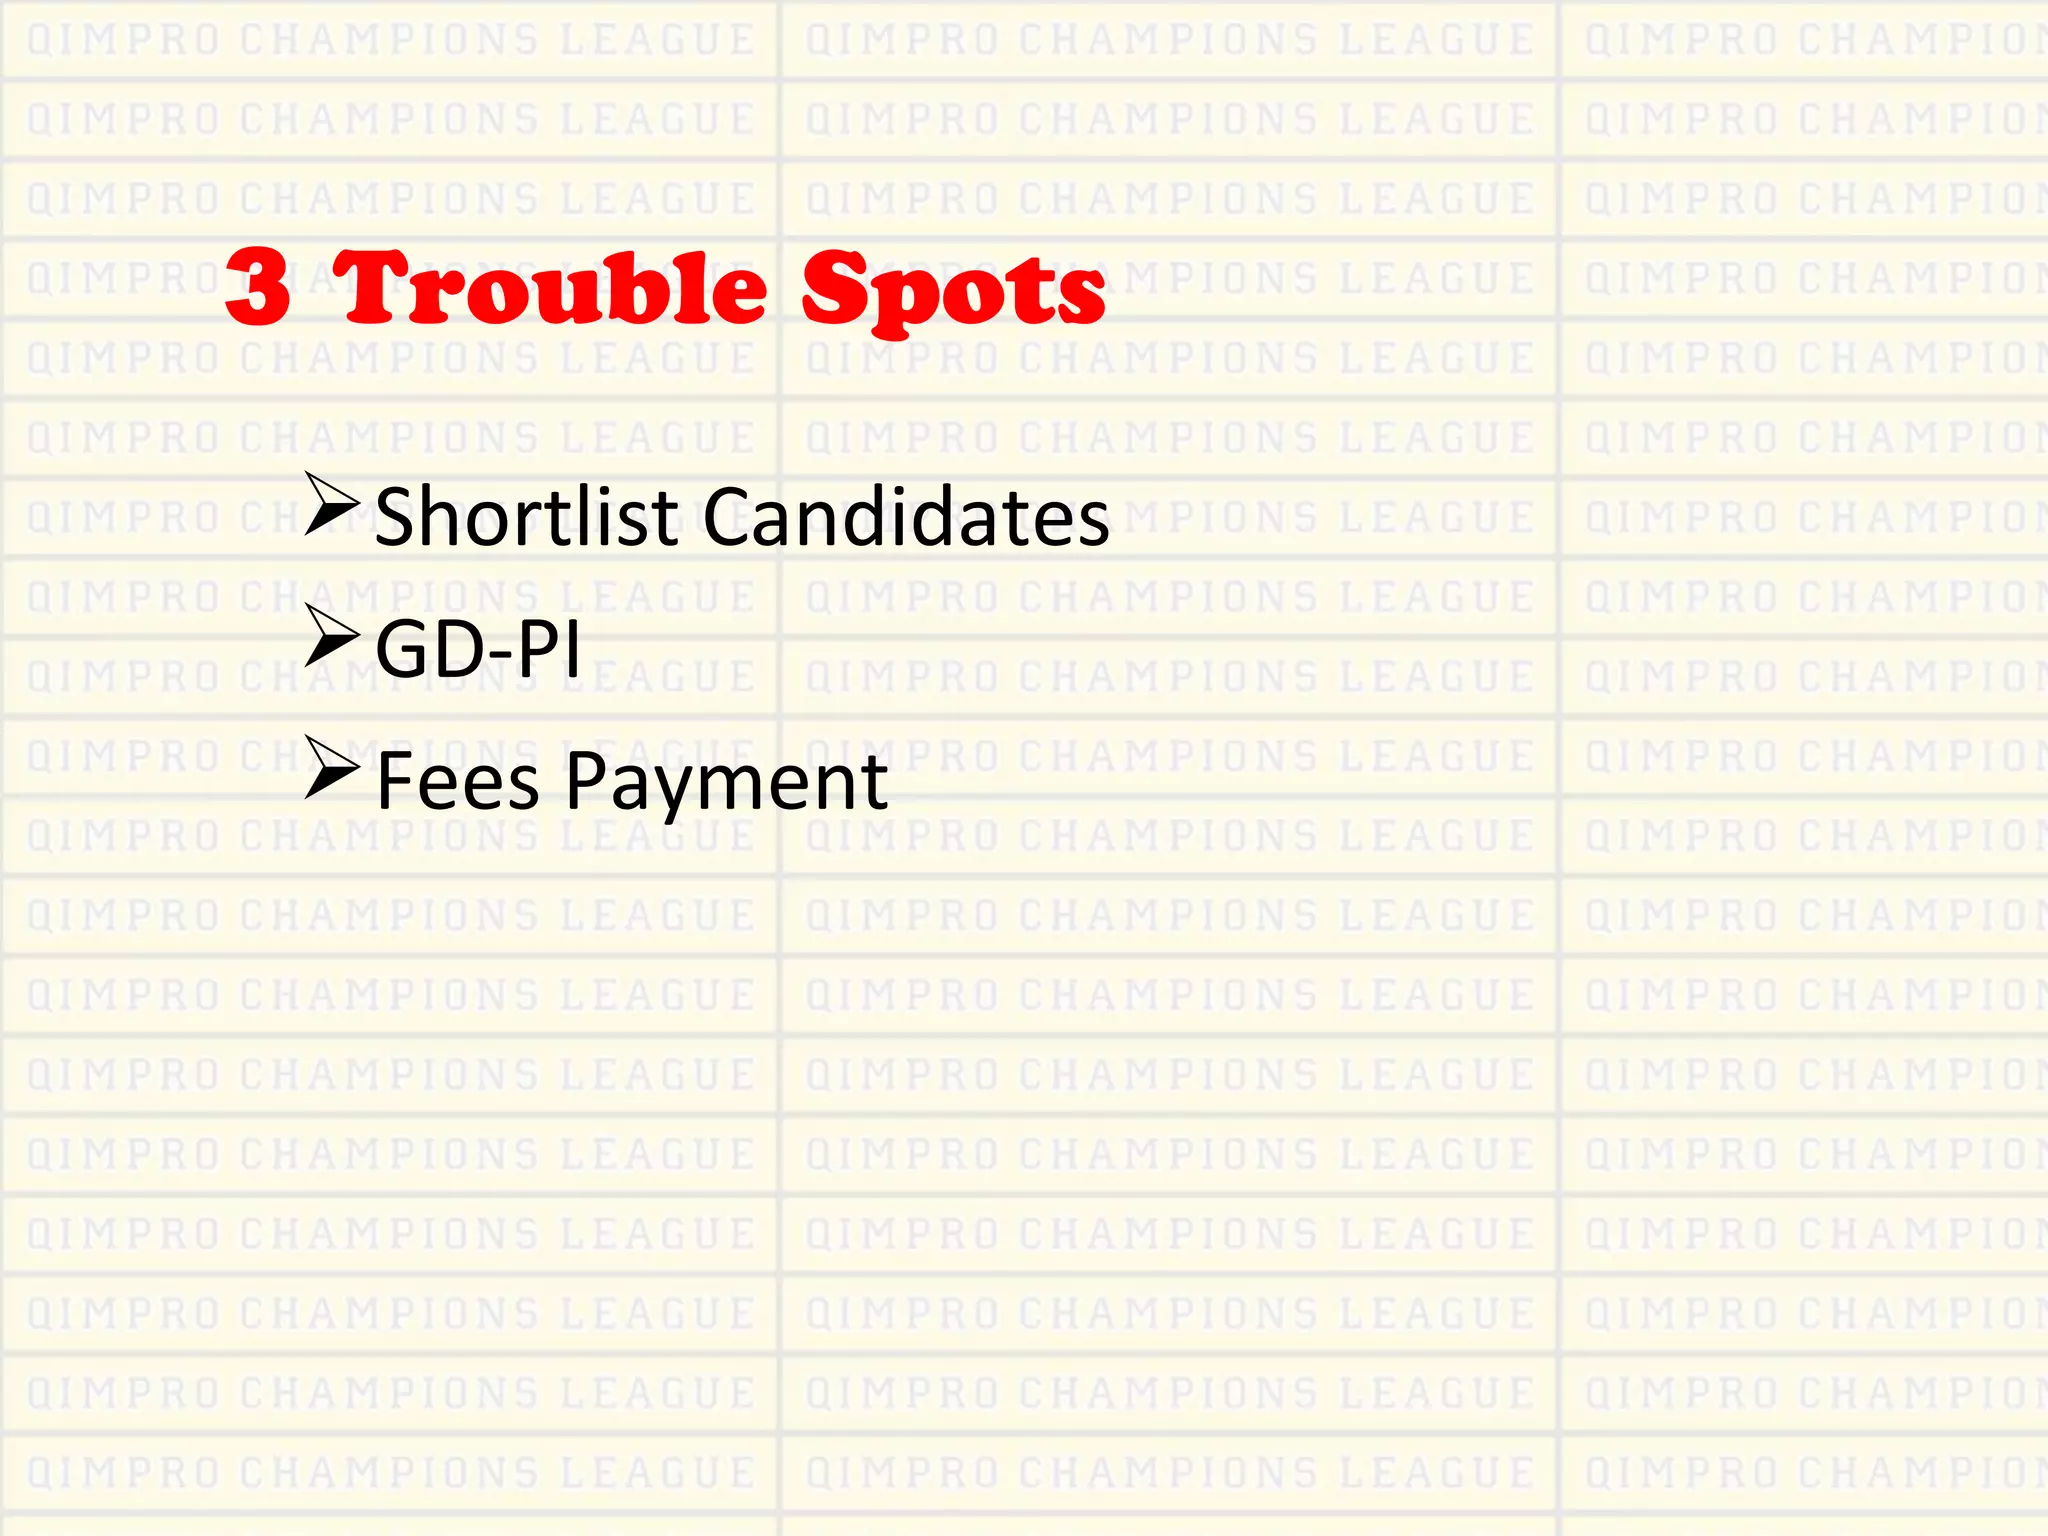
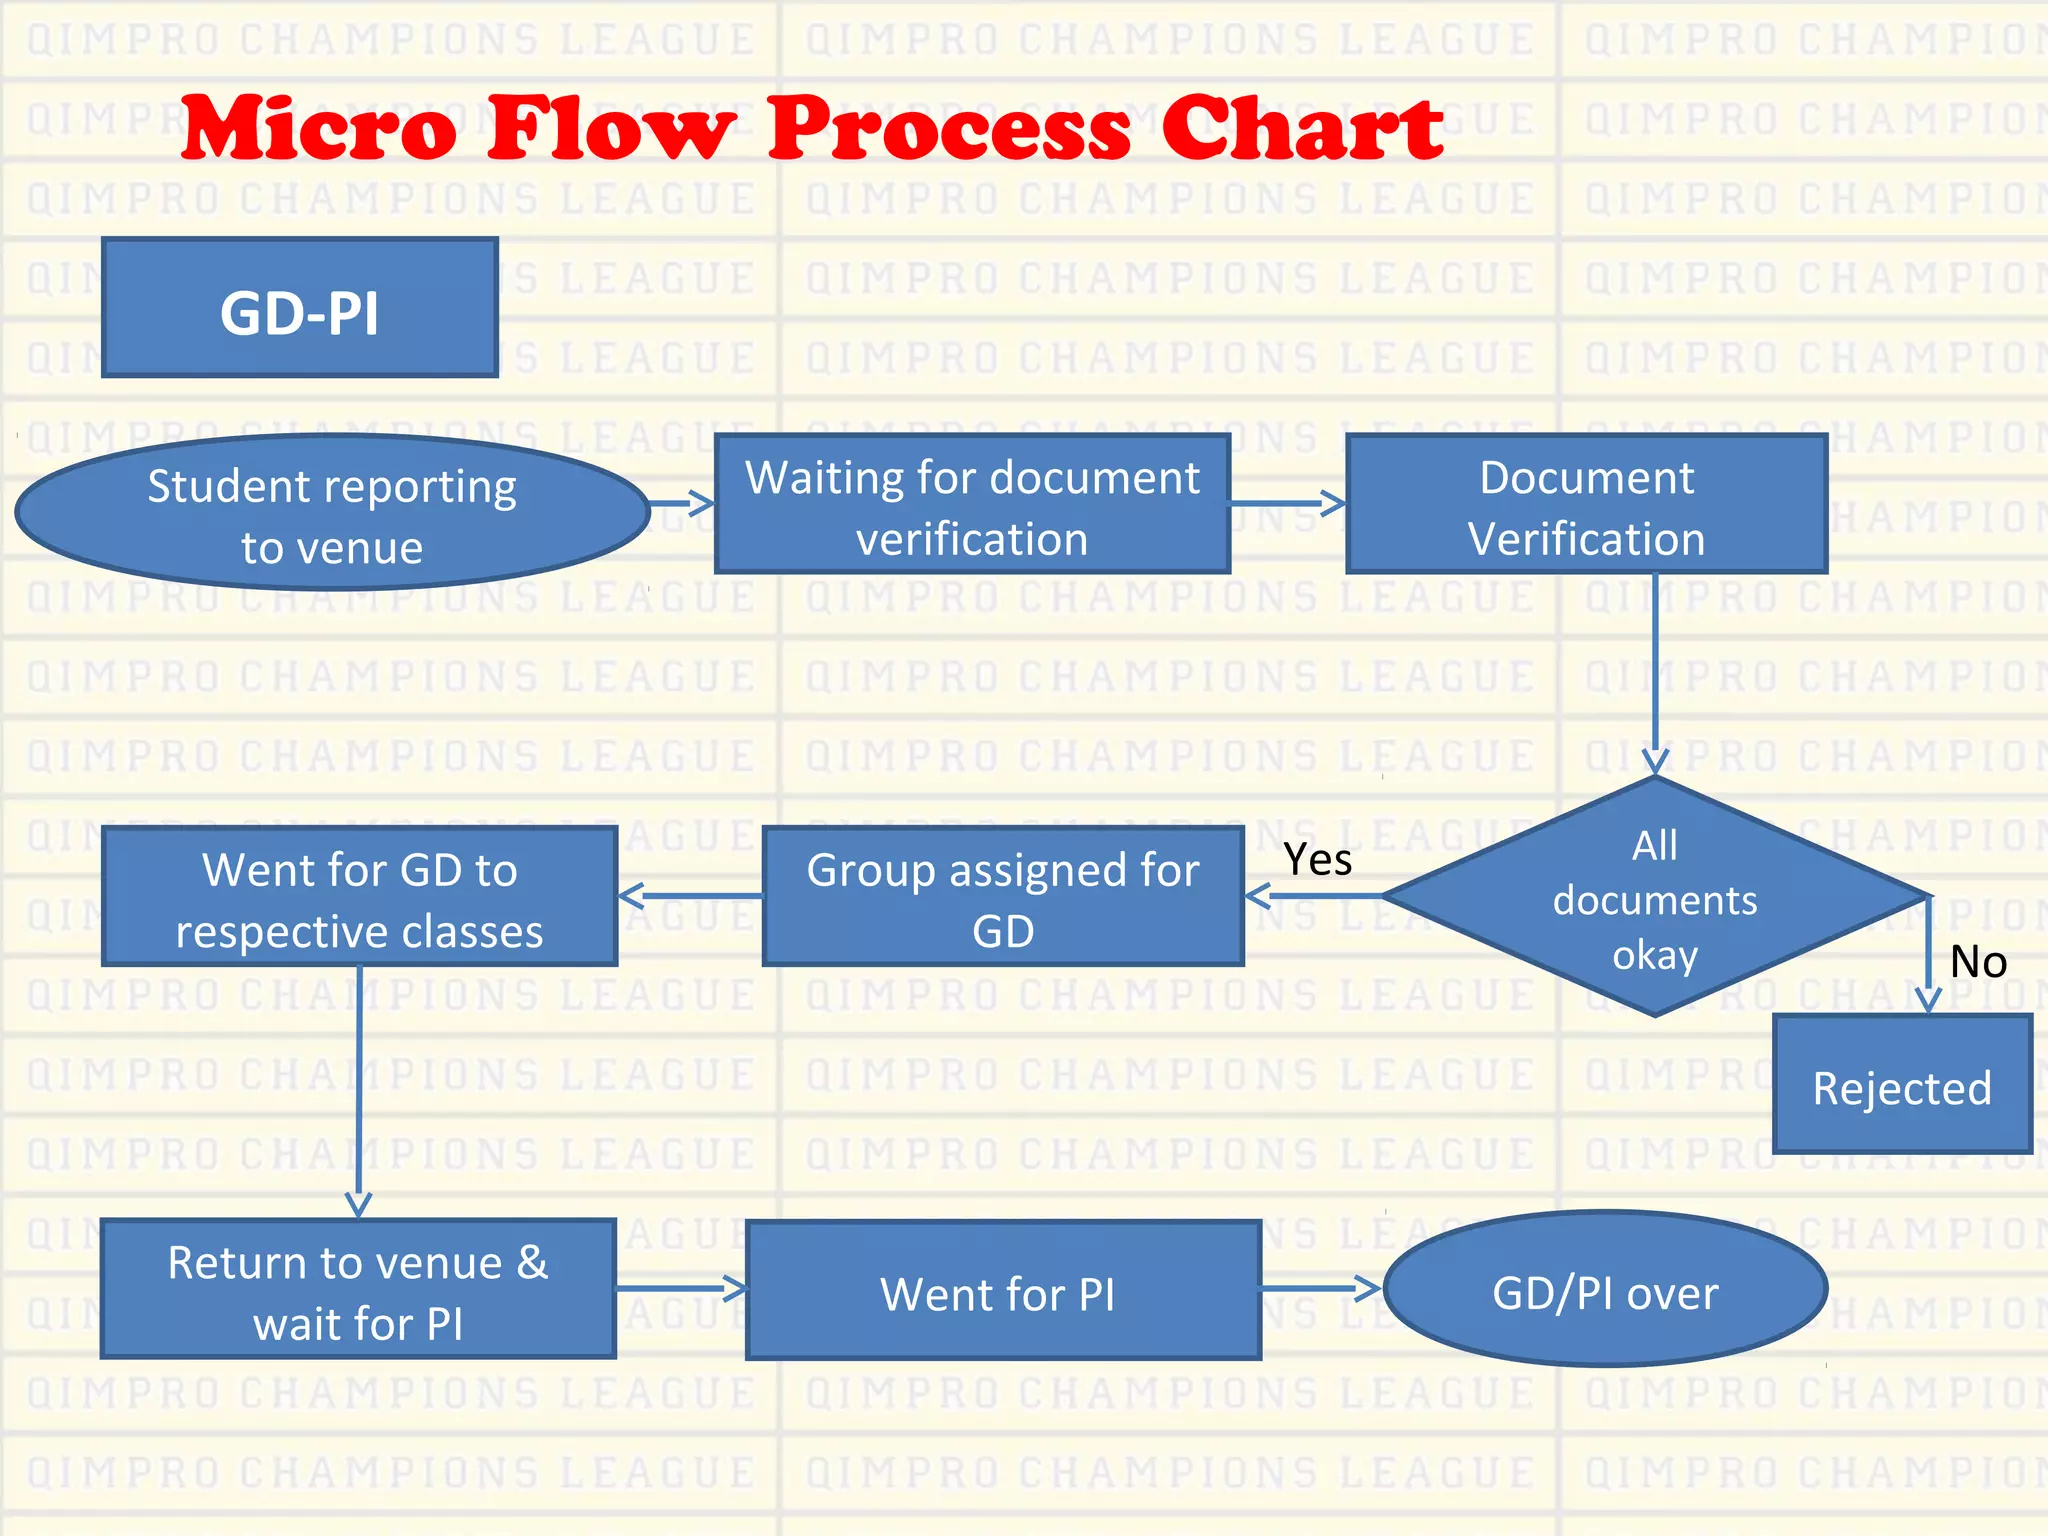
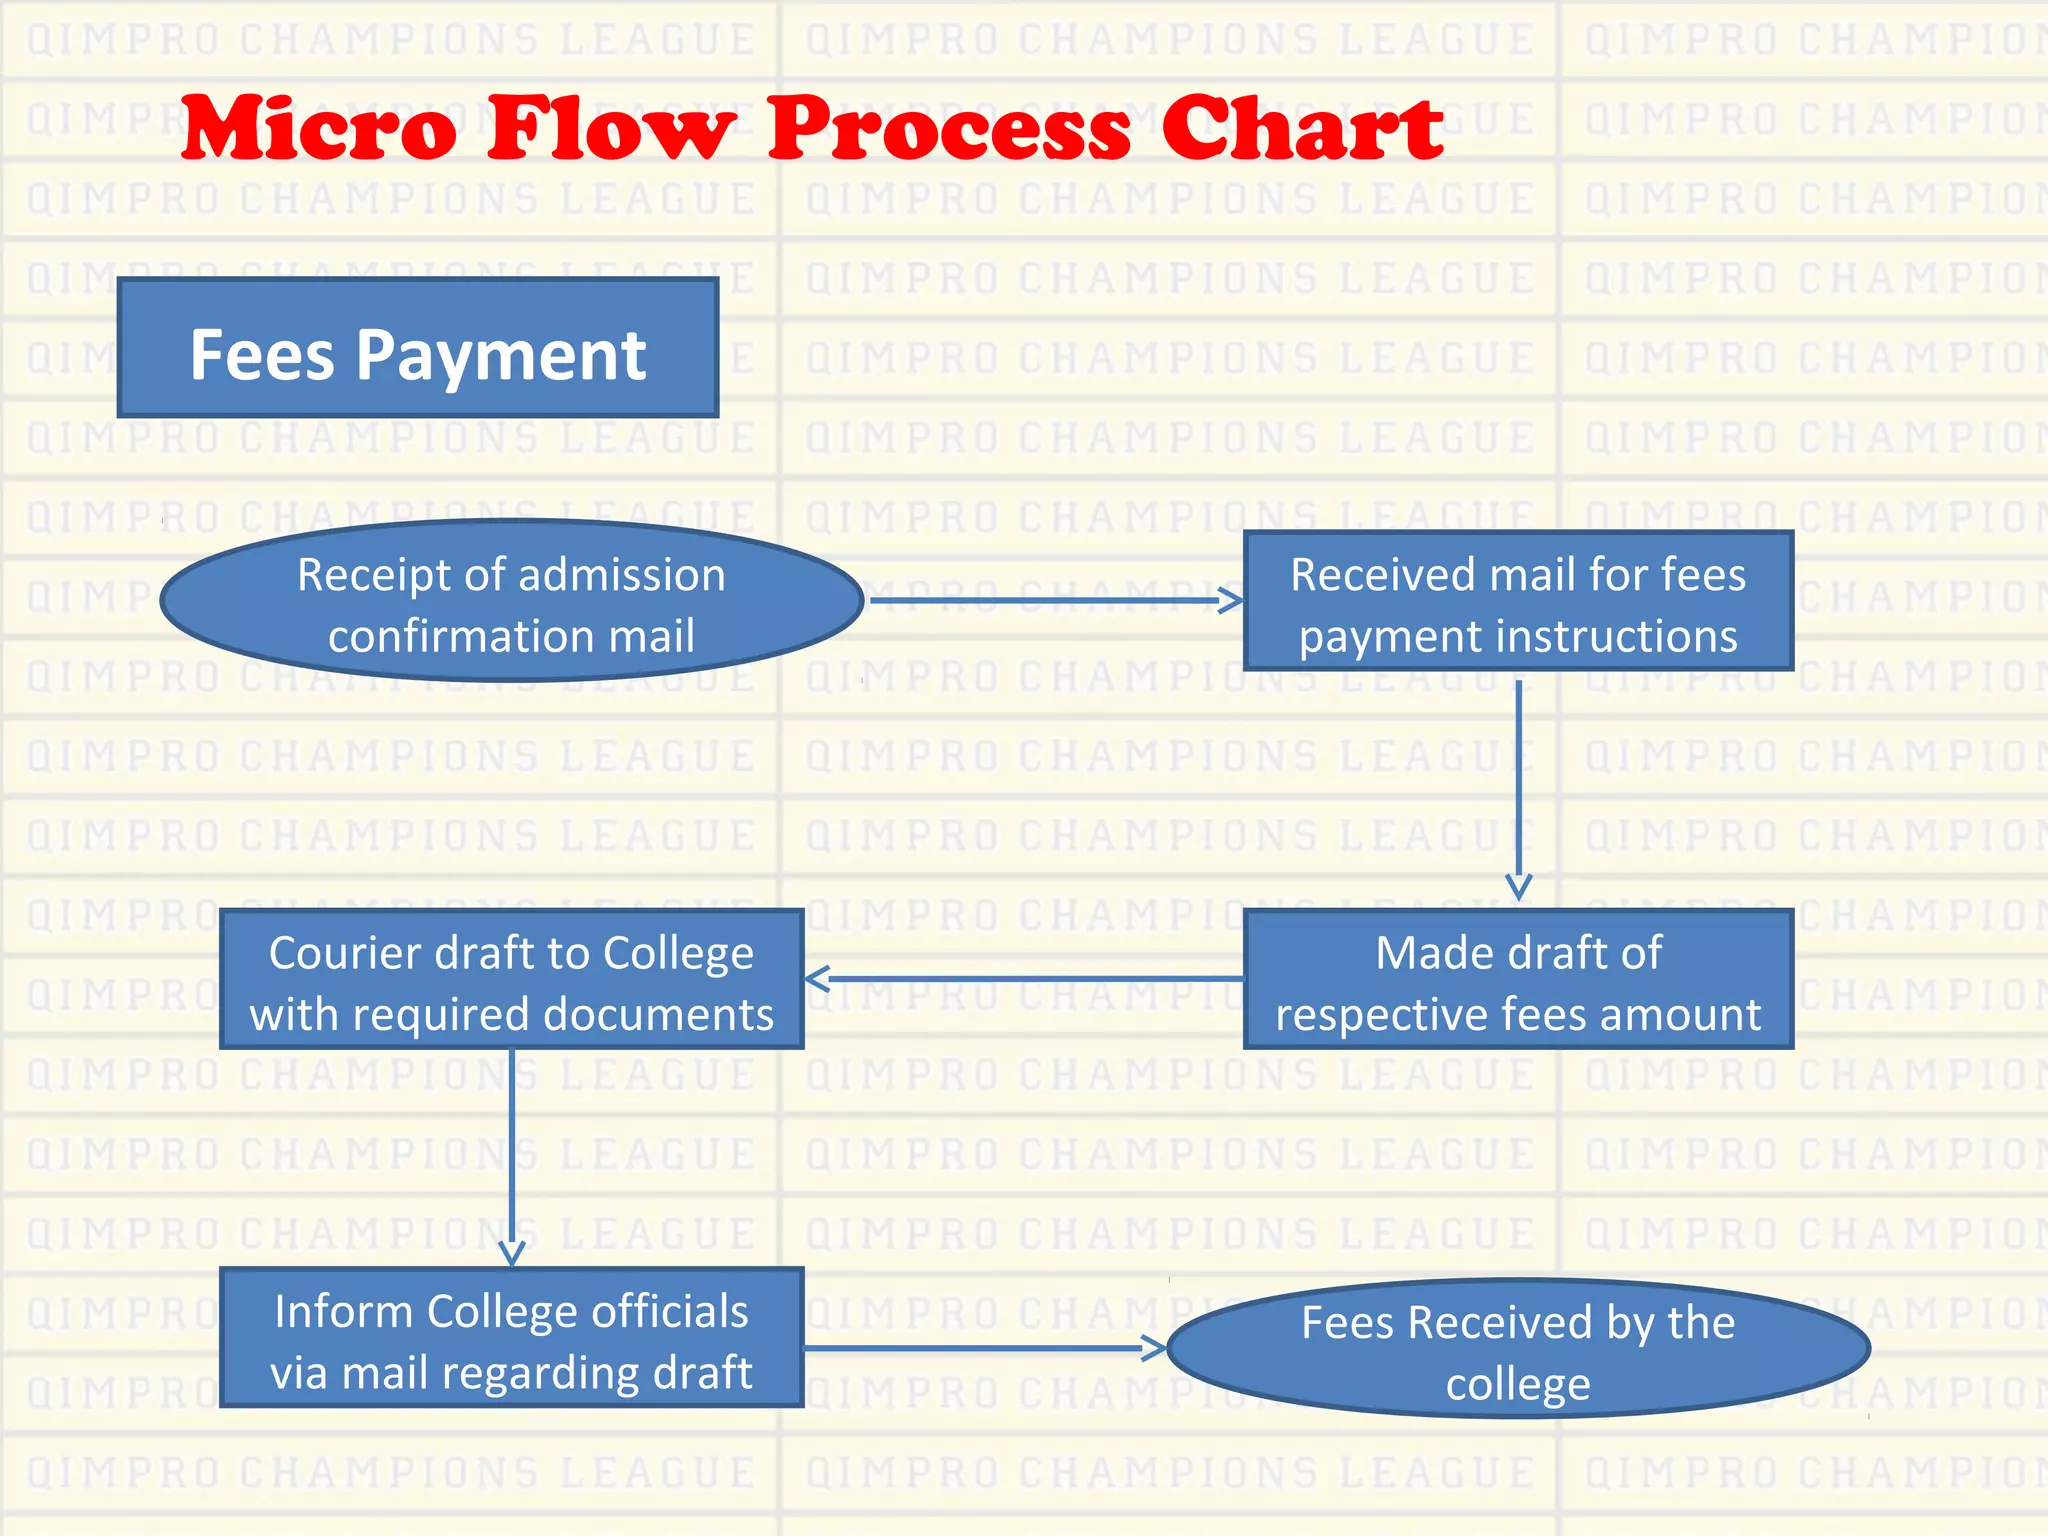
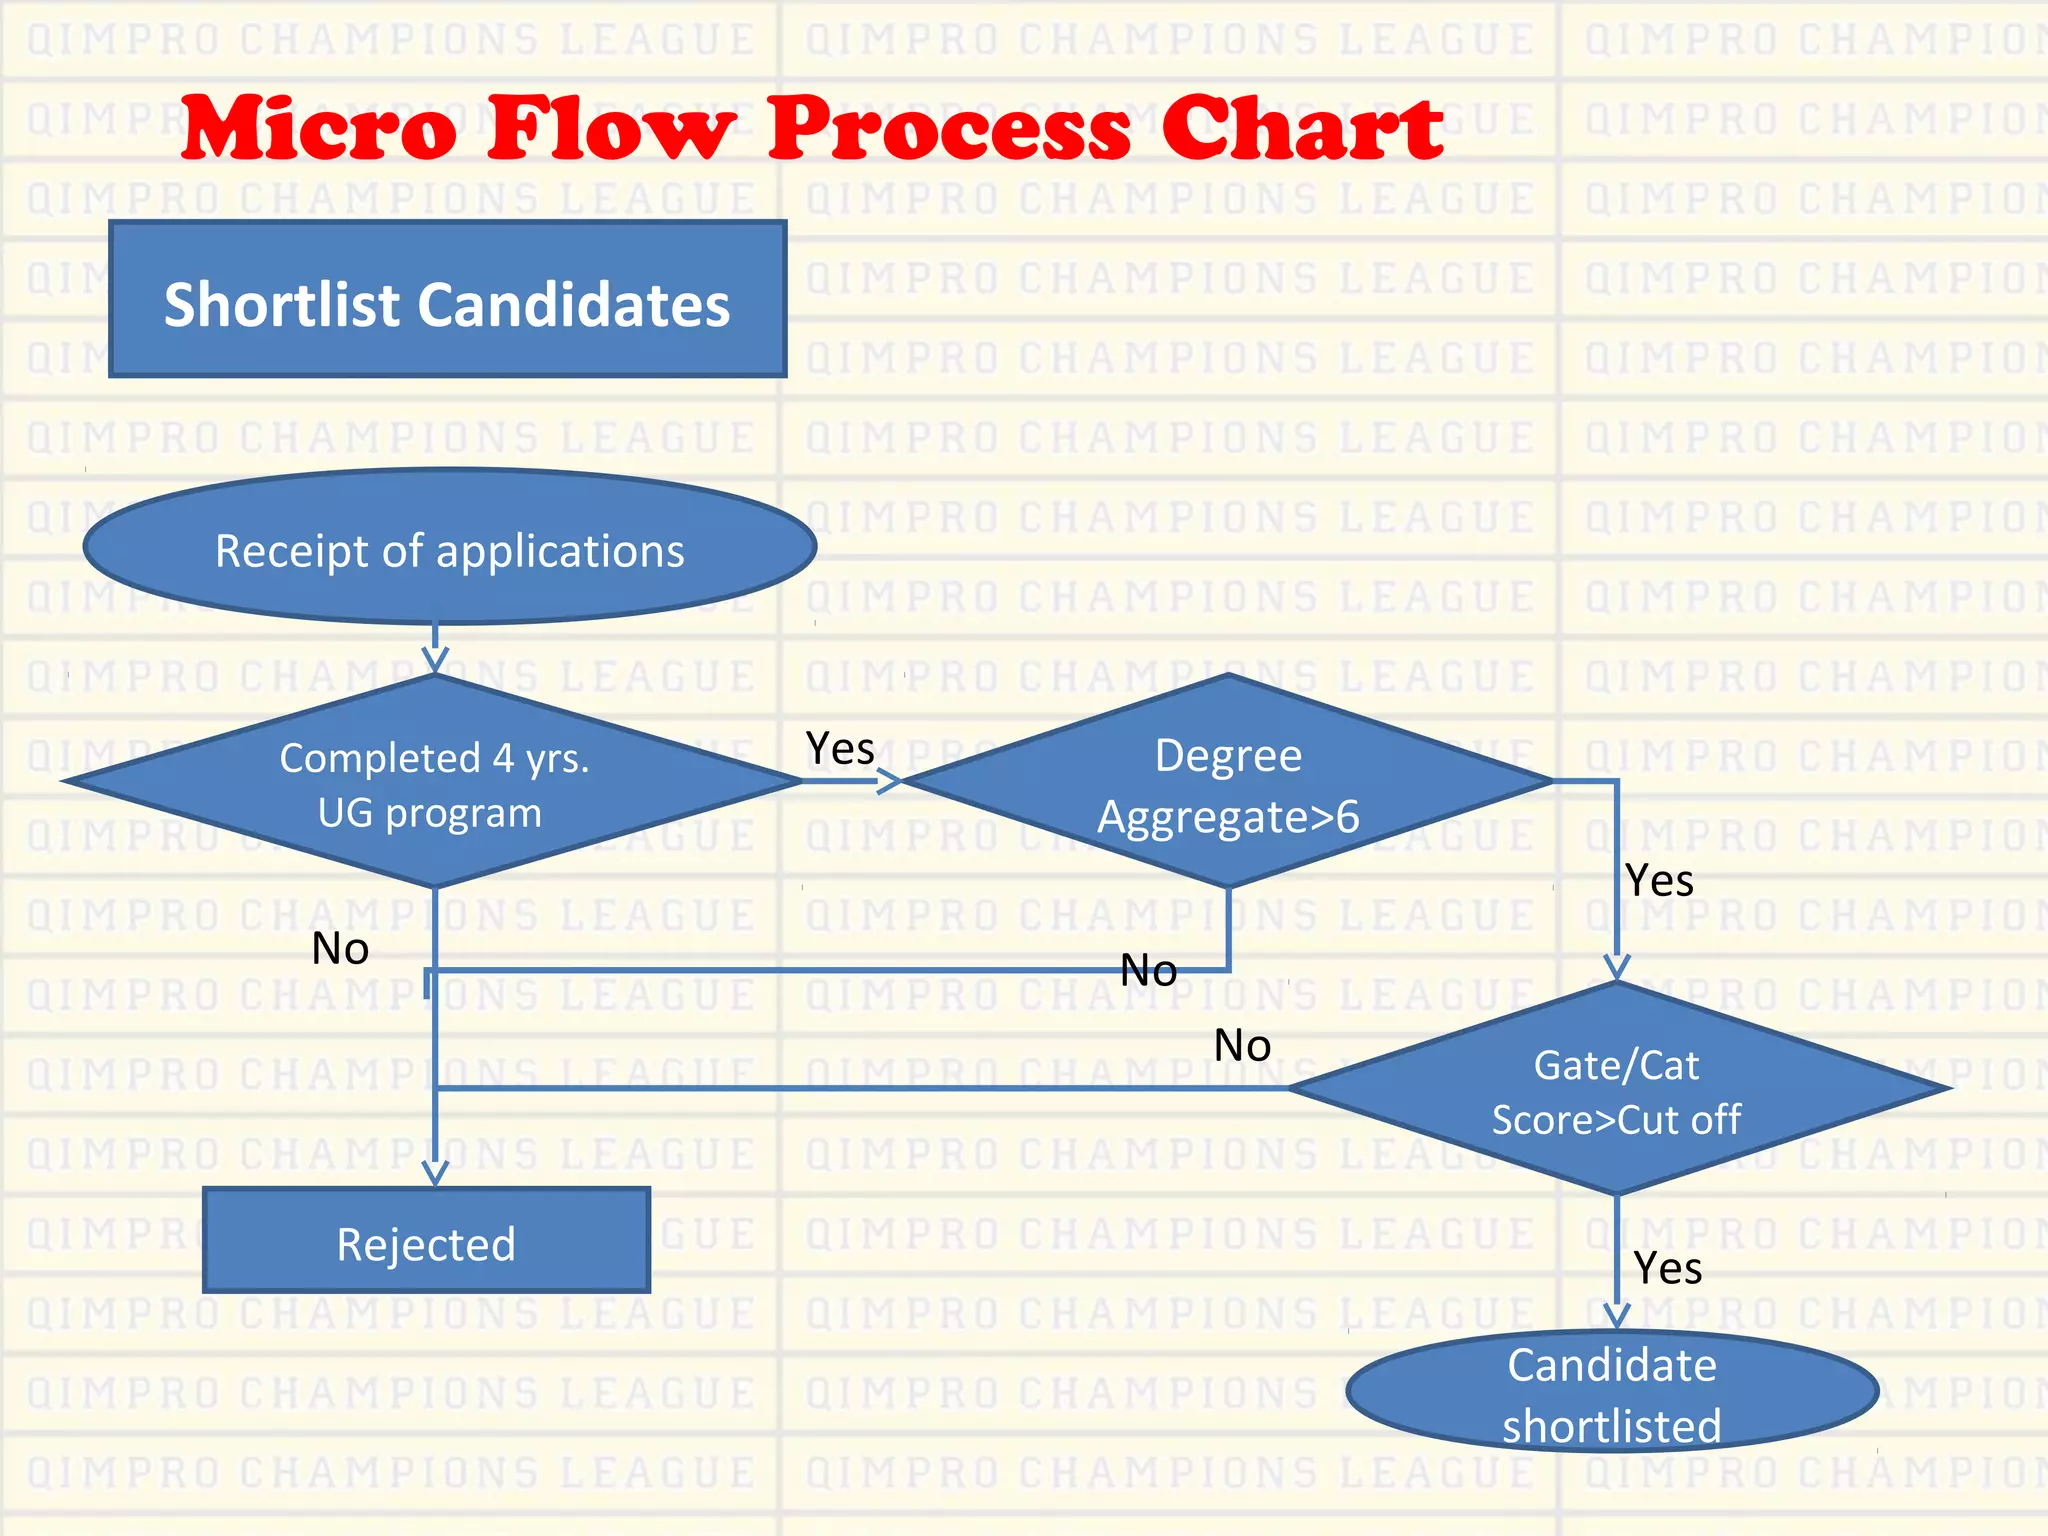
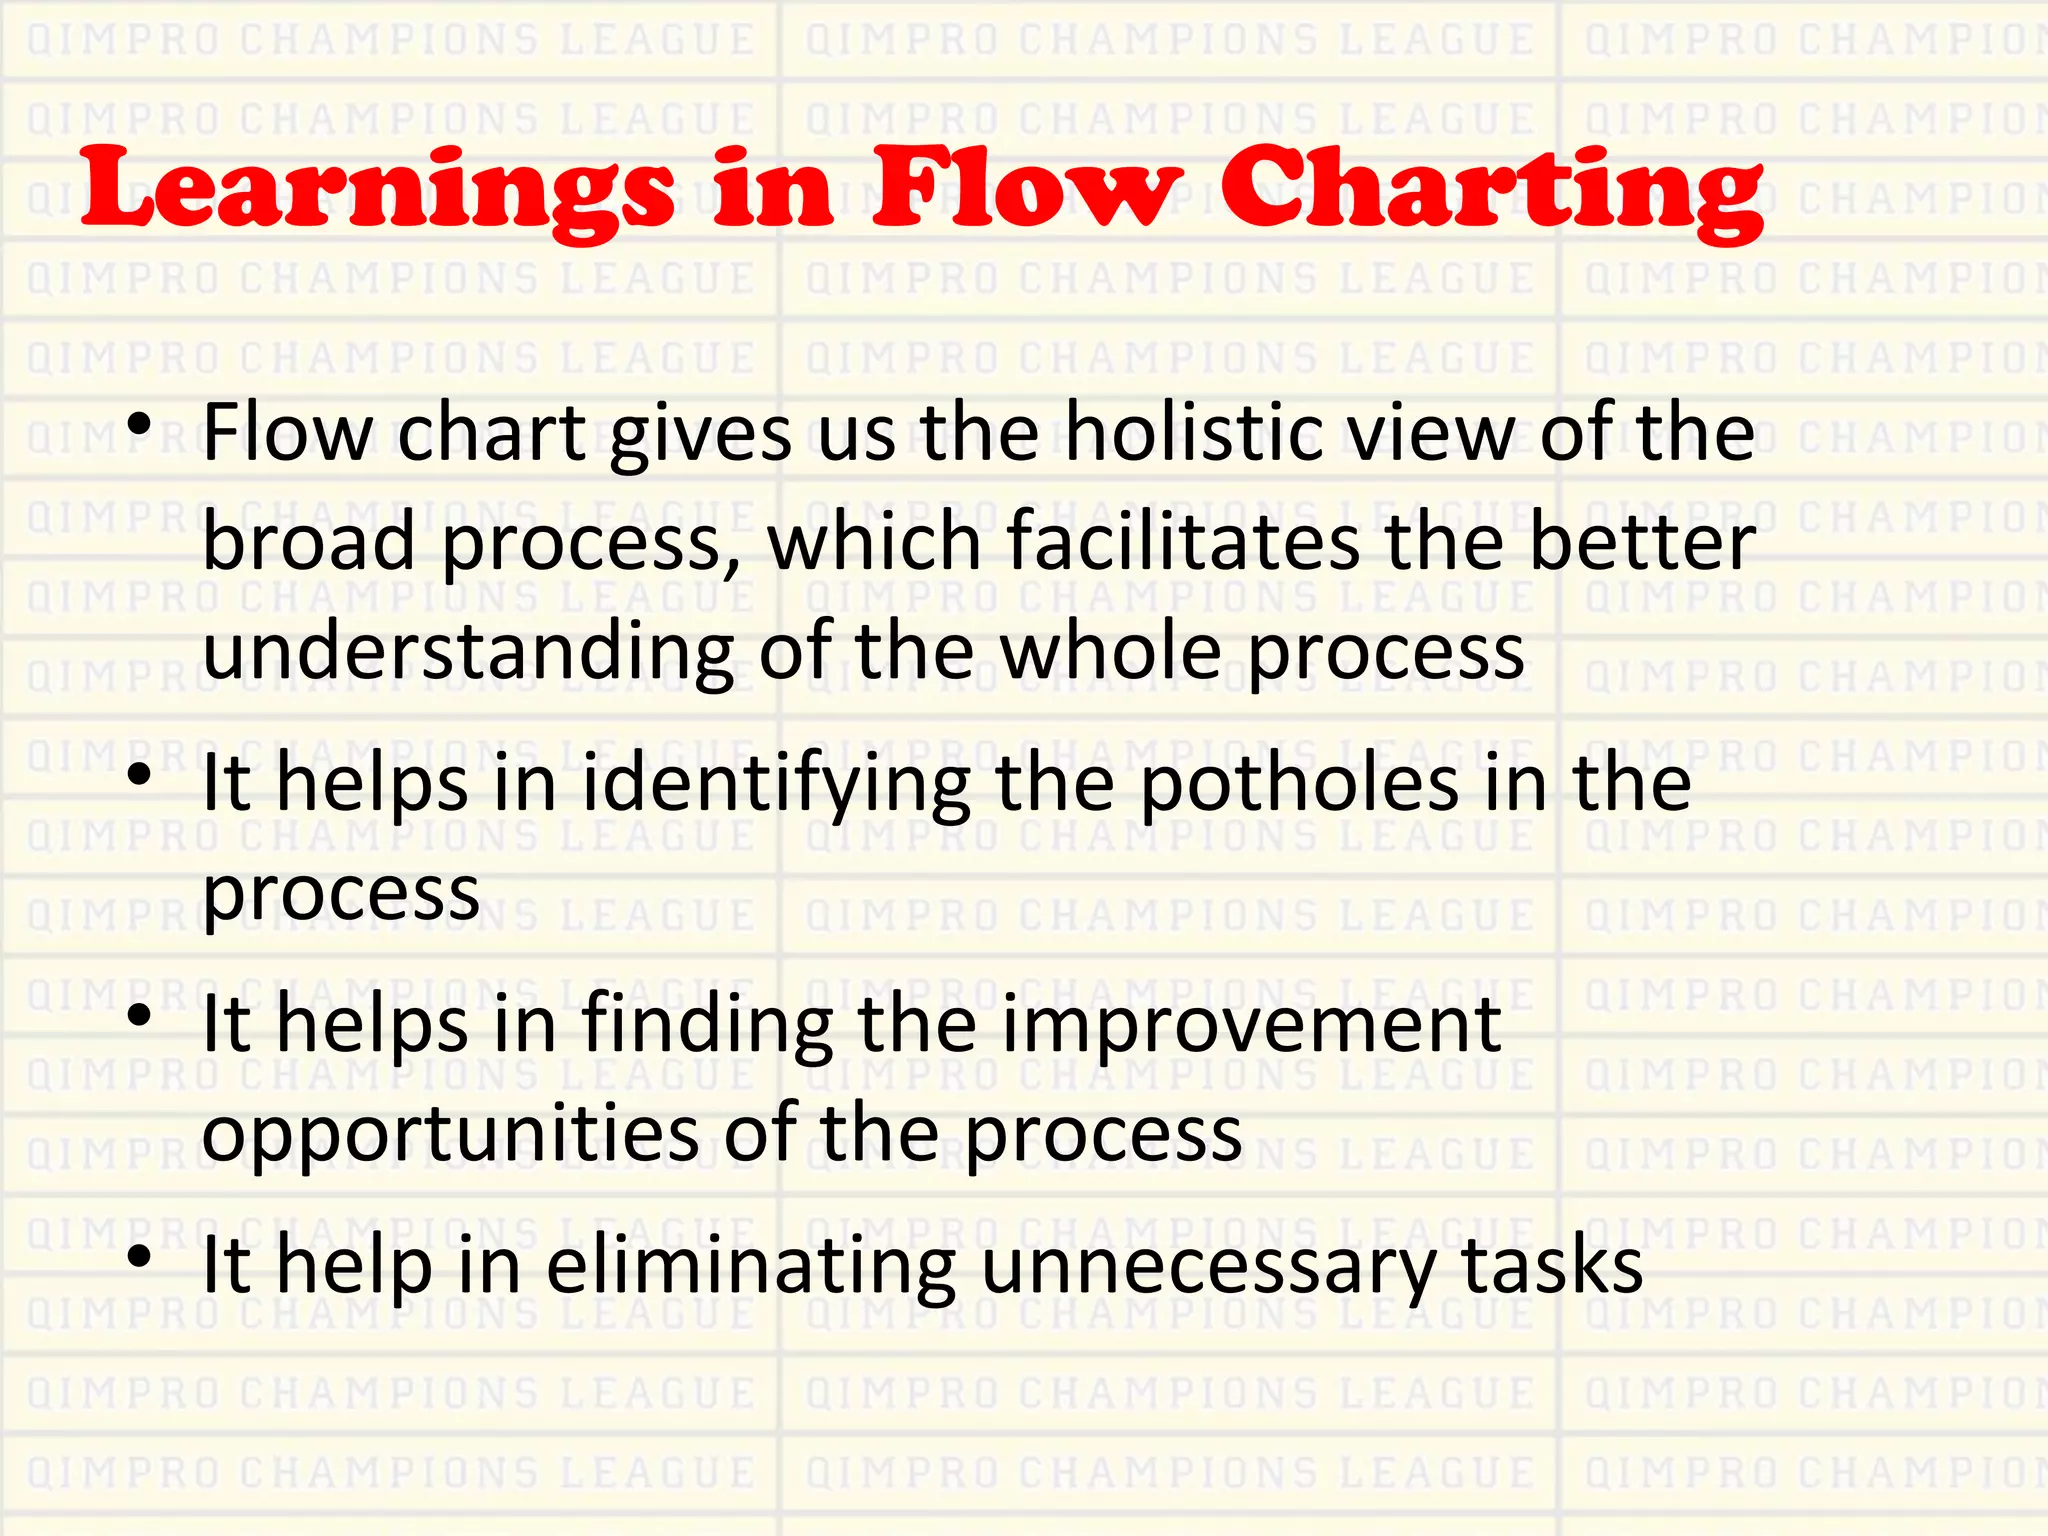
The document describes the college admissions process through flow charts at different levels: 1) A macro flow chart shows the overall process from application to orientation. 2) Micro flow charts dive deeper into three trouble spots: shortlisting candidates, the GD-PI process, and fees payment. 3) The micro charts identify problems like long wait times and unclear instructions, and propose solutions like simultaneous GD-PI and earlier group assignment.
![Qcl 14-v3 [flowchart]-nitie_chappa kishore](https://cdn.slidesharecdn.com/ss_thumbnails/qcl-14-v3flowchartnitiechappakishore-150117021153-conversion-gate01-thumbnail.jpg?width=640&height=640&fit=bounds)


![Qcl 14-v3 [flowcharts]-[banasthali university]_[aparna agnihotri]](https://cdn.slidesharecdn.com/ss_thumbnails/qcl-14-v3flowchartsbanasthaliuniversityaparnaagnihotri-150108072250-conversion-gate01-thumbnail.jpg?width=640&height=640&fit=bounds)


![Qcl 14-v3 [flowchart]-[nitie]_[chappa kishore]](https://cdn.slidesharecdn.com/ss_thumbnails/qcl-14-v3flowchartnitiechappakishore-150117022112-conversion-gate01-thumbnail.jpg?width=640&height=640&fit=bounds)
![Qcl 14-v3 [flowchart]-[nitie]_[chappa kishore]](https://cdn.slidesharecdn.com/ss_thumbnails/qcl-14-v3flowchartnitiechappakishore-150117021754-conversion-gate02-thumbnail.jpg?width=640&height=640&fit=bounds)

![Qcl 14-v3 [flowchart]-[banasthali university]_[kumari shalini]](https://cdn.slidesharecdn.com/ss_thumbnails/qcl-14-v3flowchartbanasthaliuniversitykumarishalini-150117065408-conversion-gate01-thumbnail.jpg?width=640&height=640&fit=bounds)

![QCL_14_v3_[flowcharting]_[banasthali vidyapith]_[komal sharma]](https://cdn.slidesharecdn.com/ss_thumbnails/flowchartppt-150212062325-conversion-gate01-thumbnail.jpg?width=640&height=640&fit=bounds)
![QCL-15-v3[2-flowcharts]_[banasthali vidyapith]_[komal sharma]](https://cdn.slidesharecdn.com/ss_thumbnails/flowchartppt-141230093706-conversion-gate01-thumbnail.jpg?width=640&height=640&fit=bounds)


![Qcl 14-v3 [flowchart]-[banasthali university]_[kumari shalini]](https://cdn.slidesharecdn.com/ss_thumbnails/qcl-14-v3flowchartbanasthaliuniversitykumarishalini-150117065901-conversion-gate02-thumbnail.jpg?width=640&height=640&fit=bounds)


![Qcl 14-v3 [flowcharting2]-[banasthali vidyapith]_[kirti vastava]](https://cdn.slidesharecdn.com/ss_thumbnails/d0pj75surxial50tvxvs-signature-1288414e2a3042d01203652a986a03e29023d6f9762b16614cc9f06258f8cde7-poli-150215000317-conversion-gate01-thumbnail.jpg?width=640&height=640&fit=bounds)
![Qcl 14-v3 [flowcharting2]-[banasthali vidyapith]_[kirti vastava]](https://cdn.slidesharecdn.com/ss_thumbnails/qcl-14-v3flowcharting2banasthalividyapithkirtivastava-150214004957-conversion-gate01-thumbnail.jpg?width=640&height=640&fit=bounds)
![Qcl 14-v3 [flowcharting2]-[banasthali vidyapith]_[kirti vastava]](https://cdn.slidesharecdn.com/ss_thumbnails/qcl-14-v3flowcharting2banasthalividyapithkirtivastava-150214235021-conversion-gate02-thumbnail.jpg?width=640&height=640&fit=bounds)
![Qcl 14-v3_ [Challenge 2]_[banasthali university]_[akanksha]](https://cdn.slidesharecdn.com/ss_thumbnails/qcl-14-v3flowchartsbanasthaliuniversityakanksha-150121011334-conversion-gate01-thumbnail.jpg?width=640&height=640&fit=bounds)


