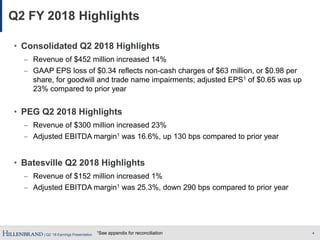
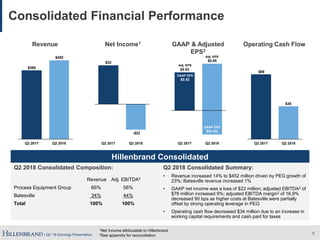
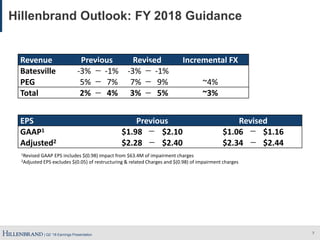
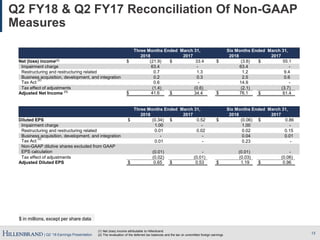
- Revenue for Q2 2018 increased 14% to $452 million, driven by a 23% increase in revenue for the Process Equipment Group. Adjusted EPS increased 23% to $0.65 compared to the prior year.
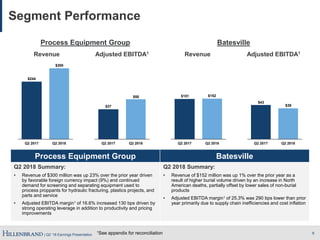
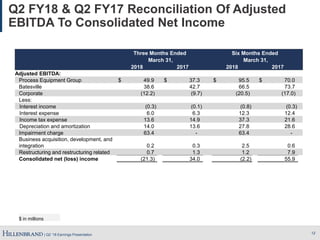
- The Process Equipment Group saw a 23% revenue increase and a 130 basis point increase in adjusted EBITDA margin to 16.6% due to strong operating leverage, productivity improvements, and pricing increases.
- Batesville's revenue increased 1% while adjusted EBITDA margin decreased 290 basis points to 25.3% primarily due to supply chain inefficiencies and cost inflation.