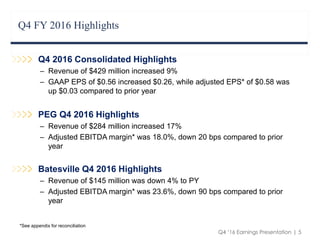
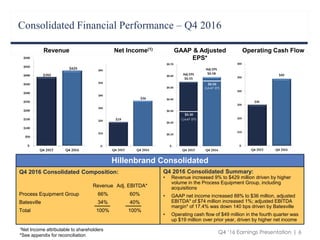
Hillenbrand reported financial results for Q4 2016 with the following highlights:
- Revenue increased 9% to $429 million driven by growth in the Process Equipment Group.
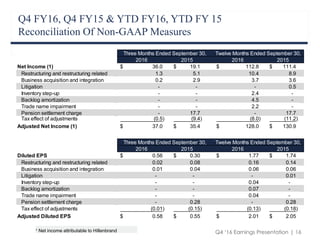
- Net income increased 88% to $36 million and adjusted EPS increased slightly to $0.58.
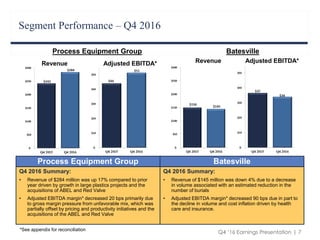
- The Process Equipment Group saw a 17% revenue increase while Batesville's revenue declined 4%.
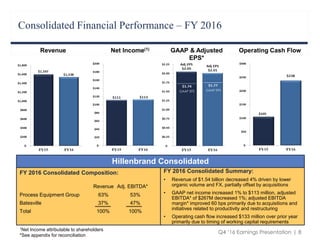
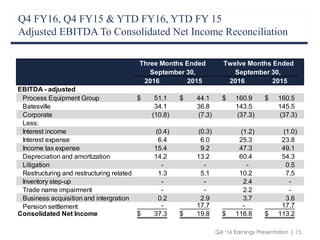
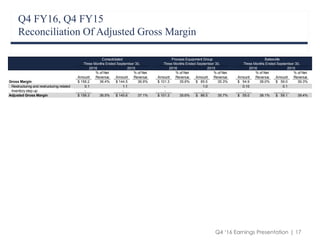
- For the full 2016 year, revenue declined 4% to $1.54 billion while net income grew 1% and adjusted EBITDA margin improved.
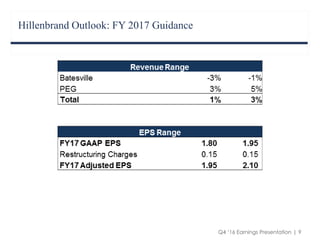
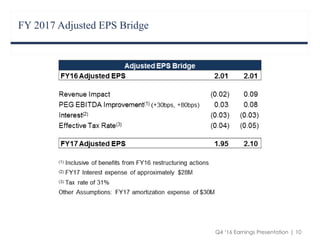
- The company provided guidance for adjusted EPS of $2.10-$2.20 for FY2017.