Hillenbrand provides concise summaries in 3 sentences or less that provide the high level and essential information from the document.
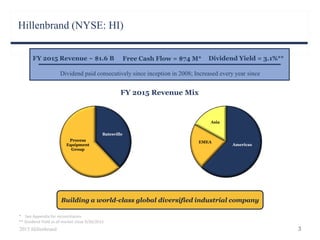
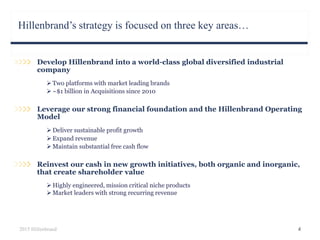
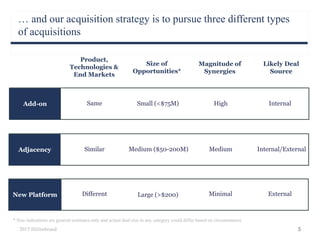
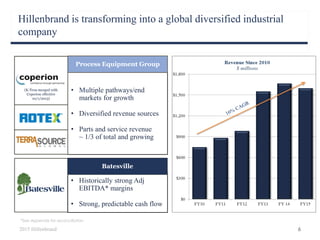
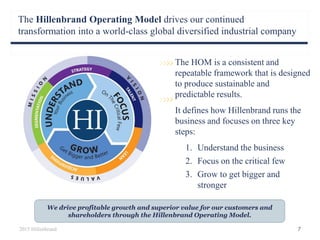
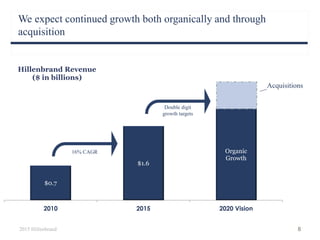
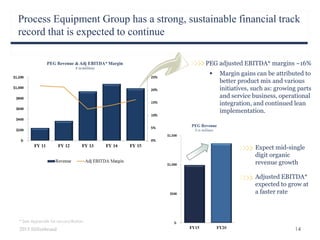
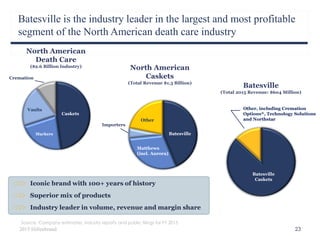
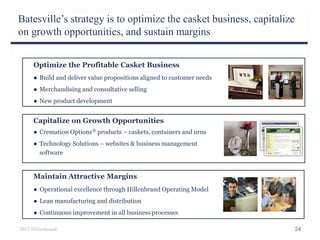
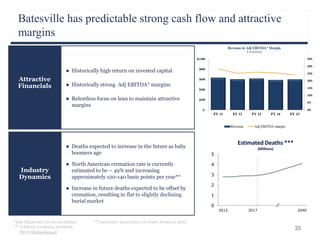
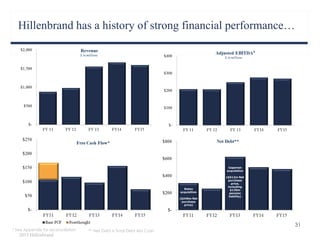
Hillenbrand is a global diversified industrial company with two main business segments: Process Equipment Group, which manufactures mission critical industrial equipment, and Batesville, which is the leader in the North American death care industry. The company pursues growth both organically and through acquisitions, with a strategy focused on optimizing current businesses, capitalizing on growth opportunities, and maintaining strong margins and cash flow. Hillenbrand has a history of strong financial performance and acquiring companies like ABEL that advance its strategic goals.