Managing Uncertainty: Newman George Leech's Real Estate Finance Strategy
Q1 2012 Houston Office Market Report
1. Q1 2012 | OFFICE MARKET
HOUSTON OFFICE MARKET
RESEARCH & FORECAST REPORT
Houston’s Class A Suburban Office Rental Rate Increases 5.5%
Houston’s office market has undergone significant changes in the past twelve months benefiting
from positive absorption, falling vacancy, and rising rental rates. Increased leasing activity has
made it harder to find available blocks of quality Class A office space, leading to new office
MARKET INDICATORS construction. Demand for both multi-tenant and single tenant buildings are spurring this new
growth.
Q1 2011 Q1 2012
CITYWIDE NET Expansion in the energy sector has spurred demand for office space. Anadarko has begun
ABSORPTION (SF) 378k 1.1m construction on a second office tower (550,000 SF) in The Woodlands, and Phillips 66 recently
)
announced plans to build a new headquarters in West Houston.
CITYWIDE AVERAGE The Woodlands Development Company currently has 3 Waterway Square Place under
VACANCY 15.9% 14.6% construction where Nexeo Solutions pre-leased 64,000 square feet and Waste Connections pre-
leased 49,929 square feet in the 11-story, 234,000 square foot Class A project. A complete list
CITYWIDE AVERAGE of properties currently under construction can be found on page 7 of this report.
RENTAL RATE $22.81 $23.56 Citywide, overall vacancy levels decreased by 90 basis points between quarters from 15.5% to
14.6% and by 130 basis points from a year ago. The most significant decrease in vacancy
CLASS A RENTAL RATE between quarters was the CBD Class A vacancy rate, which decreased by a remarkable 300
basis points from 14.3% to 11.3%.
CBD $34.19 $36.42
The average citywide rental rate rose by 1.5% between quarters to $23.56 from $23.20 per
SUBURBAN $26.91 $28.86
square foot, and on a year-over-year basis by 3.3% to $23.56 per square foot from $22.81 per
CLASS A VACANCY square foot. The largest quarterly rental rate increase was Class A suburban office rental rates
CBD 12.6% 11.3% which increased by 5.5% to $28.86 per square foot from $27.34.
SUBURBAN 16.6% 14.4%
The Houston metropolitan area added 93,400 jobs between February 2011 and February 2012, a
3.7% increase. Unemployment fell to 7.2% from 8.4% one year ago. Houston area home sales
increased by 16.9% compared to February 2011 sales. With continued expansion in the energy
industry and a strong housing market, Houston’s economy is expected to remain healthy for both
the near and long-term.
JOB GROWTH & UNEMPLOYMENT
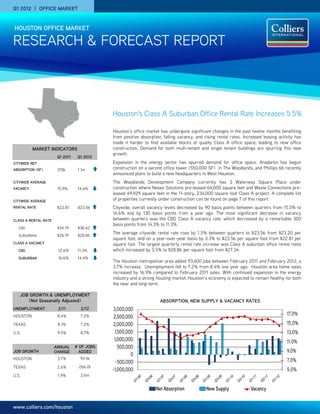
(Not Seasonally Adjusted) ABSORPTION, NEW SUPPLY & VACANCY RATES
UNEMPLOYMENT 2/11 2/12 3,000,000
17.0%
HOUSTON 8.4% 7.2% 2,500,000
TEXAS 8.1% 7.2% 2,000,000 15.0%
U.S. 9.5% 8.7% 1,500,000 13.0%
1,000,000 11.0%
ANNUAL # OF JOBS 500,000
JOB GROWTH CHANGE ADDED 9.0%
0
HOUSTON 3.7% 93.4k
-500,000 7.0%
TEXAS 2.6% 266.2k
-1,000,000 5.0%
U.S. 1.9% 2.6m
Net Absorption New Supply Vacancy
www.colliers.com/houston
2. RESEARCH & FORECAST REPORT | Q1 2012 | HOUSTON OFFICE MARKET
VACANCY & AVAILABILITY ABSORPTION & DEMAND
CBD VS. SUBURBAN Overall vacancy levels decreased by 90 basis Houston recorded positive net absorption of
CLASS A OFFICE VACANCY points between quarters to 14.6% from 15.5%. 1,074,493 SF in the first quarter. Contributing to
The average suburban vacancy rate decreased the first quarter’s positive gain was suburban
20.0%
by 60 basis points to 14.7% from 15.3% the Class A space with a positive net absorption of
18.0%
previous quarter, while CBD vacancy decreased 964,119 SF, followed by CBD Class A space with
16.0%
by 230 basis points to 14.3% from 16.6%. On a positive net absorption of 239,148 SF. The
14.0%
year-over-year basis, the city-wide vacancy majority of the suburban positive absorption
12.0%
10.0%
rate decreased by 130 basis points to 14.6% was due to The University of Texas MD
8.0%
from 15.9%. The suburban vacancy rate Anderson Cancer Center moving into their new
6.0%
decreased by 110 basis points to 14.7% from administrative building in the South
4.0%
15.8%, and the CBD vacancy rate decreased by Main/Medical Center submarket. Administrative
170 basis points to 14.3% from 16.0%. employees were relocated from eight different
The CBD Class A vacancy rate decreased by locations to the new building.
300 basis points to 11.3% from 14.3% between RENTAL RATES
CBD VACANCY SUBURBAN VACANCY quarters, while the CBD Class B vacancy rate
The average citywide rental rate rose between
decreased 50 basis points to 17.5% from 18.0%.
quarters from $23.20 to $23.56 per square
The suburban Class A vacancy rate decreased foot. The CBD Class A average quoted rental
by 200 basis points to 12.4% from 14.4% rate increased by 3.2% from $35.29 to $36.42
CLASS A OFFICE RENTS
between quarters, while the suburban Class B per square foot, while the suburban Class A
$40.00
vacancy rate increased between quarters from average rate increased 5.56% from $27.34 to
$38.00 16.6% to 17.3%. $28.86 per square foot.
$36.00 Citywide, a total of 39 office properties (7 less The CBD Class B average rate increased slightly
$34.00 than the previous quarter) had a minimum of from $23.65 to $23.81 per square foot, while
100,000 SF available for lease in both direct the suburban Class B average rate rose from
$32.00
and sublease space, and 12 of those properties $18.30 to $19.05 per square foot between
$30.00 have over 200,000 SF available. quarters.
$28.00 Available sublease space totaled 2.4 million On a year-over-year basis the citywide average
$26.00 SF, including 0.9 million SF of vacant space and rental rate increased by 3.3% from $22.81 to
1.5 million SF of subleases available for $23.56 per square foot.
occupancy over the next 18 months.
CBD RENTS SUBURBAN RENTS
QUOTED GROSS RENTAL RATES FOR TOP PERFORMING OFFICE BUILDINGS
YEAR AVAIL. RENT
BUILDING NAME ADDRESS SUBMARKET RBA (SF) LEASED OWNER
BUILT SF ($/SF)
New York State Common Retirement
5 Houston Center 1401 McKinney St CBD 600,000 2002 91.8% 82,822 $42.65
Fund
1000 Main 1000 Main St CBD 837,161 2003 98.7% 15,094 $44.57 KAN AM 1000 Main LP
Heritage Plaza 1111 Bagby CBD 1,089,266 1986 86.7% 144,551 $41.90 Brookfield Office Properties
BG Group Place 811 Main CBD 972,474 2011 70.1% 291,079 $42.00 CalPERS
Wells Fargo Bank Tower 1300 Post Oak Blvd. Galleria 491,254 1983 94.1% 53,711 $37.15 TIAA-CREF
Williams Tower 2800 Post Oak Blvd Galleria 1,476,973 1983 91.8% 183,582 $37.66 Hines
9 Greenway Plaza 9 Greenway Greenway 746,824 1978 93.6% 71,503 $31.40 Crescent Real Estate Equities
Enclave Business Park 1200 Enclave Pky Katy Freeway 149,683 1999 82.4% 39,094 $33.00 Piedmont Office Realty Trust, Inc.
San Felipe Plaza 5847 San Felipe St San Felipe/Voss 980,472 1984 84.8% 189002 $36.42 Thomas Properties Group, L.P.
One BriarLake Plaza 2000 W. Sam Houston Westchase 502410 2000 100% 47,332 $41.55 Behringer Harvard
Waterway Square 4 Waterway Ave. Woodlands 232,364 2009 98.9% 2,539 $37.75 The Woodlands Development Company
Note: Avail. SF includes direct and sublet space.
Source: CoStar Property
COLLIERS INTERNATIONAL | P. 2
3. RESEARCH & FORECAST REPORT | Q1 2012 | HOUSTON OFFICE MARKET
SALES ACTIVITY
Houston’s Office Investment sales activity increased between quarters with 21 properties changing hands, compared to 10 in the
previous quarter. According to CoStar Comps, Houston office sale transactions had a total dollar volume of $269.2 million, averaging
$125/SF with an 8.0% capitalization rate.
Some of the more significant transactions that closed during the first quarter are listed in the table below.
Q1 2012 SIGNIFICANT SALES TRANSACTIONS
SALE
BUILDING NAME SUBMARKET RBA (SF) YEAR BUILT BUYER SELLER $/SF CLOSED
PRICE
Brookhollow Renovated Parmenter Realty
Northwest 806,004 Thomas Properties $71M $88 1/2012
Central I, II & III in 2009 Partners
Renovated Parmenter Realty KBS Real Estate
2200 West Loop S Galleria/Uptown 201,720 $30M $149 1/2012
in 2000 Partners Investment Trust, Inc.
Skanska USA Building,
15375 Memorial Dr Katy Freeway 349,674 1985 Allstate Insurance Co $15.8M $45 2/2012
Inc.
The Plaza at CORE Real Estate,
Katy Freeway 344,296 2008 The Azrieli Foundation $13.5M $312 1/2012
Enclave LLC
Highland Resources Cougar Investors
510 Bering San Felipe/Voss 100,840 1984 $9.9M $135 2/2012
Inc. LTD, LLLP
LEASING ACTIVITY
Houston’s office leasing activity reached 3.2 million SF in the first quarter. Below is a list of the significant 1Q 2012 lease transactions.
1Q 2012 TOP OFFICE LEASES
BUILDING NAME/ADDRESS SUBMARKET SF TENANT LEASE DATE
20555 Hwy 249 FM 1960/Hwy 249 497,124 Noble Energy Jan-12
1
1221 McKinney St CBD 310,178 LyondellBasell Industries Jan-12
Post Oak Central Three Galleria/West Loop 131,068 Apache Corporation Jan-12
Chase Center 601 Travis CBD 62,261 Dynegy Jan-12
3 Waterway Square Place Woodlands 49,929 Waste Connections, Inc. Feb-12
920 Memorial City Way Katy Freeway 49,000 Cobalt International Energy Mar-12
1
Two Eldridge Place Katy Freeway 46,000 Sunqaurd VeriCenter, Inc. Mar-12
2
3 Waterway Square Place Woodlands 42,684 Nexeo Solutions, LLC Mar-12
Phoenix Tower Greenway Plaza 33,394 New York Life Mar-12
1
2000 West Loop South Galleria/West Loop 31,744 Post Oak Bank, N.A. Mar-12
BG Group Place 811 Main CBD 27,126 Louis Dreyfus Energy Services Feb-12
The Reserve at Sierra Pines Woodlands 27,253 Strike, LLC Mar-12
Heritage Plaza 1111 Bagby CBD 26,656 McGraw Hill Jan-12
One Eldridge Place Katy Freeway 20,485 Marubeni Offshore Production1, 2 Mar-12
1
Renewal
2
Expansion
3
Sublease
COLLIERS INTERNATIONAL | P. 3
7. RESEARCH & FORECAST REPORT | Q1 2012 | HOUSTON OFFICE MARKET
HOUSTON SUBURBAN OFFICE MARKET SUMMARY - CONTINUED
Inventory Direct Vacancy Sublease Vacancy Vacancy Vacancy Rate (%) Net Absorption (SF) Rental Rate
Class # of Bldgs. Total (SF) (SF) Rate (%) (SF) Rate (%) Total (SF) Q1-2012 Q4-2011 Q1-2012 Q4-2011 AVG ($/SF)
West Loop/Galleria
A 35 14,737,279 1,463,808 9.9% 107,959 0.7% 1,571,767 10.7% 10.9% 20,785 50,604 $30.04
B 59 7,372,003 1,375,835 18.7% 8,798 0.1% 1,384,633 18.8% 18.9% 10,919 20,408 $21.79
C 4 240,656 0 0.0% 0 0.0% 0 0.0% 0.0% 0 0 $16.75
Total 98 22,349,938 2,839,643 12.7% 116,757 0.5% 2,956,400 13.2% 13.5% 31,704 71,012 $27.12
Westchase
A 21 6,636,105 777,631 11.7% 33,834 0.5% 811,465 12.2% 12.0% 4,841 162,360 $29.27
B 59 6,256,354 1,004,789 16.1% 14,661 0.2% 1,019,450 16.3% 16.3% 6,818 -22,508 $18.46
C 7 339,118 62,224 18.3% 0 0.0% 62,224 18.3% 18.3% 0 -11,301 $15.41
Total 87 13,231,577 1,844,644 13.9% 48,495 0.4% 1,893,139 14.3% 14.2% 11,659 128,551 $23.30
The Woodlands
A 16 3,198,901 82,991 2.6% 9,729 0.3% 92,720 2.9% 6.4% 36,814 29,972 $33.16
B 65 3,433,341 414,394 12.1% 20,461 0.6% 434,855 12.7% 14.1% 141,964 155,778 $20.46
C 5 340,505 0 0.0% 0 0.0% 0 0.0% 6.1% 918 2,110 -
Total 86 6,972,747 497,385 7.1% 30,190 0.4% 527,575 7.6% 10.0% 179,696 187,860 $24.13
OFFICE DEVELOPMENT PIPELINE
Currently, there are 9 buildings in Houston’s construction pipeline. The following table is a summary of those projects.
SELECT OFFICE BUILDINGS UNDER CONSTRUCTION
PRE- EST.
BUILDING NAME ADDRESS SUBMARKET SF LEASED DEVELOPER DELIVERY
Anadarko Tower 2 1201 Lake Robbins Dr Woodlands 550,000 100.0% Patrinely Group 2014
Nexen Building 945 Bunker Hill Katy Freeway 331,513 64.3% MetroNational Corp 8/2012
BBVA Compass/2200 Post Oak 2200 Post Oak Blvd. Galleria/Uptown 306,012 59.3% Redstone and Stream 4/2013
Skanska Commercial
3009 Post Oak Blvd. 3009 Post Oak Blvd. Galleria/Uptown 302,536 0.0% 7/2013
Development
Research Forest Lakeside –
2445 Technology Forest Blvd Woodlands 300,000 50.0% Warmack Investments 6/2013
Building 4
The Woodlands Development
3 Waterway Square Place 3 Waterway Ave. Woodlands 233,844 67.0% 6/2013
Company, L.P.
CityCentre Three 842 W Sam Houston Pky N Katy Freeway 120,211 44.0% Midway Companies 9/2012
Halliburton North Belt Campus Milner Road North Belt/Greenspoint 100,000 100.0% - 1/2013
Datavox Technologies 6650 W Sam Houston Pky S Westchase 48,000 100.0% - 3/2012
HOUSTON OFFICE SUBMARKET MAP
COLLIERS INTERNATIONAL | P. 7
8. RESEARCH & FORECAST REPORT | Q1 2012 | HOUSTON OFFICE MARKET
Colliers International Statistics
Revenues: $1.8 Billion
Countries: 62
Offices: 522
Professionals & Staff: 12,300
Brokers: 4,800
Square Feet Managed: 1,250 Million*
Lease/Sale Transactions: 76,000
Total Transaction Value: $68 Billion
(Based on 2011 results.)
*The combination of Colliers International and FirstService results in 2.5
Billion under management - 2nd largest in the world.
Lisa R. Bridges
Director of Market Research Houston
Direct +1 713 830 2125
Fax +1 713 830 2118
lisa.bridges@colliers.com
COLLIERS INTERNATIONAL | HOUSTON
1300 Post Oak Boulevard
Suite 200
Houston, Texas 77056
Main +1 713 222 2111
Accelerating success.
COLLIERS INTERNATIONAL | P. 8