Python Profiling:
A. Jesse Jiryu Davis


@jessejiryudavis


MongoDB
The Glory
&
The Guts
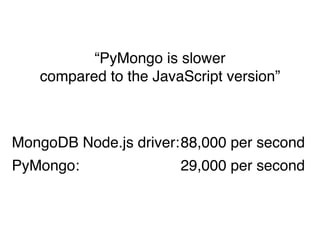
“PyMongo is slower!
compared to the JavaScript version”
MongoDB Node.js driver:!88,000 per second
PyMongo: ! ! ! ! ! ! ! ! ! 29,000 per second
“Why Is
PyMongo Slower?”
From:!steve@mongodb.com!
To:!! jesse@mongodb.com!
CC:!! eliot@mongodb.com

Hi Jesse,!
!
Why is the Node MongoDB driver 3 times!
faster than PyMongo?!


http://dzone.com/articles/mongodb-facts-over-80000
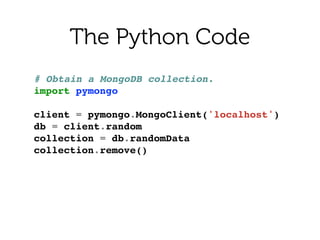
The Python Code
# Obtain a MongoDB collection.!
import pymongo!
!
client = pymongo.MongoClient('localhost')!
db = client.random!
collection = db.randomData!
collection.remove()!
n_documents = 80000!
batch_size = 5000!
batch = []!
!
import time!
start = time.time()
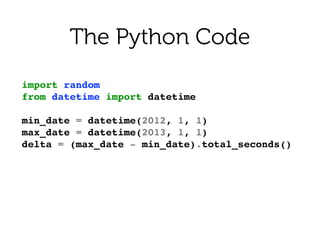
The Python Code
import random!
from datetime import datetime!
!
min_date = datetime(2012, 1, 1)!
max_date = datetime(2013, 1, 1)!
delta = (max_date - min_date).total_seconds()!
The Python Code
What?!
The Python Code
for i in range(n_documents):!
date = datetime.fromtimestamp(!
time.mktime(min_date.timetuple())!
+ int(round(random.random() * delta)))!
!
value = random.random()!
document = {!
'created_on': date,!
'value': value}!
!
batch.append(document)!
if len(batch) == batch_size:!
collection.insert(batch)!
batch = []!
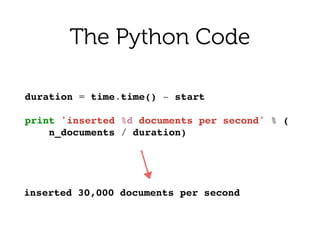
duration = time.time() - start!
!
print 'inserted %d documents per second' % (!
n_documents / duration)!
The Python Code
inserted 30,000 documents per second
The Node.js Code
(not shown)
The Question
Why is the Python script
3 times slower than the
equivalent Node script?
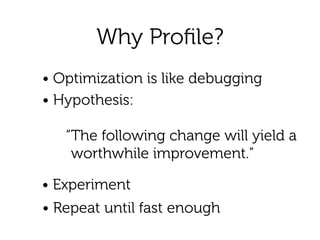
Why Profile?
• Optimization is like debugging
• Hypothesis:

“The following change will yield a
worthwhile improvement.”
• Experiment
• Repeat until fast enough
Why Profile?
Profiling is a way to

generate hypotheses.
Which Profiler?
• cProfile
• GreenletProfiler
• Yappi
Yappi
By Sümer Cip
Yappi
Compared to cProfile, it is:
!
• As fast
• Also measures functions
• Can measure CPU time, not just wall

• Can measure all threads
• Can export to callgrind
Yappi
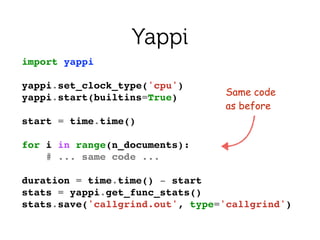
import yappi!
!
yappi.set_clock_type('cpu')!
yappi.start(builtins=True)!
!
start = time.time()!
!
for i in range(n_documents):!
# ... same code ... !
!
duration = time.time() - start!
stats = yappi.get_func_stats()!
stats.save('callgrind.out', type='callgrind')!
Same code

as before
KCacheGrind
for index in range(n_documents):!
date = datetime.fromtimestamp(!
time.mktime(min_date.timetuple())!
+ int(round(random.random() * delta)))!
!
value = random.random()!
document = {!
'created_on': date,!
'value': value}!
!
batch.append(document)!
if len(batch) == batch_size:!
collection.insert(batch)!
batch = []!
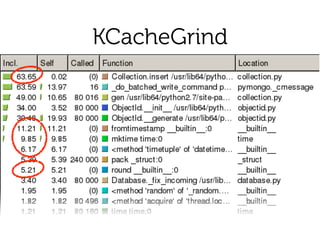
The Python Code
one third

of the time
for index in range(n_documents):!
date = datetime.now()!
!
!
!
value = random.random()!
document = {!
'created_on': date,!
'value': value}!
!
batch.append(document)!
if len(batch) == batch_size:!
collection.insert(batch)!
batch = []!
The Python Code
The Python Code
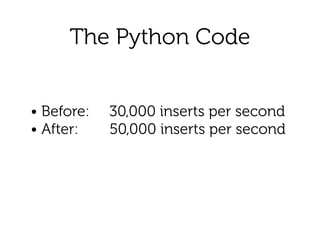
• Before: 30,000 inserts per second
• After: 50,000 inserts per second
Why Profile?
• Generate hypotheses

• Estimate possible improvement
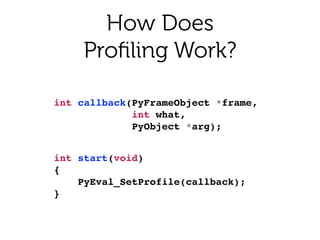
How Does

Profiling Work?
int callback(PyFrameObject *frame,!
int what,!
PyObject *arg);!
int start(void)!
{!
PyEval_SetProfile(callback);!
}!
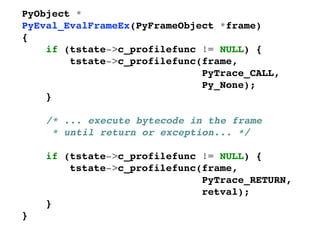
PyObject *!
PyEval_EvalFrameEx(PyFrameObject *frame)!
{!
if (tstate->c_profilefunc != NULL) {!
tstate->c_profilefunc(frame,!
PyTrace_CALL,!
Py_None);!
}!
!
/* ... execute bytecode in the frame!
* until return or exception... */!
!
if (tstate->c_profilefunc != NULL) {!
tstate->c_profilefunc(frame,!
PyTrace_RETURN,!
retval);!
}!
}!
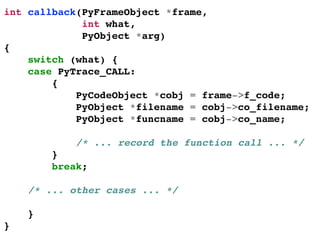
int callback(PyFrameObject *frame,!
int what,!
PyObject *arg)!
{!
switch (what) {!
case PyTrace_CALL:!
{!
PyCodeObject *cobj = frame->f_code;!
PyObject *filename = cobj->co_filename;!
PyObject *funcname = cobj->co_name;!
!
/* ... record the function call ... */!
}!
break;!
!
/* ... other cases ... */!
!
}!
}!
A. Jesse Jiryu Davis


@jessejiryudavis


MongoDB

Python Performance Profiling: The Guts And The Glory

  • 1.
    Python Profiling: A. JesseJiryu Davis 
 @jessejiryudavis 
 MongoDB The Glory & The Guts
  • 3.
    “PyMongo is slower! comparedto the JavaScript version” MongoDB Node.js driver:!88,000 per second PyMongo: ! ! ! ! ! ! ! ! ! 29,000 per second
  • 4.
    “Why Is PyMongo Slower?” From:!steve@mongodb.com! To:!!jesse@mongodb.com! CC:!! eliot@mongodb.com
 Hi Jesse,! ! Why is the Node MongoDB driver 3 times! faster than PyMongo?! 
 http://dzone.com/articles/mongodb-facts-over-80000
  • 5.
    The Python Code #Obtain a MongoDB collection.! import pymongo! ! client = pymongo.MongoClient('localhost')! db = client.random! collection = db.randomData! collection.remove()!
  • 6.
    n_documents = 80000! batch_size= 5000! batch = []! ! import time! start = time.time() The Python Code
  • 7.
    import random! from datetimeimport datetime! ! min_date = datetime(2012, 1, 1)! max_date = datetime(2013, 1, 1)! delta = (max_date - min_date).total_seconds()! The Python Code
  • 8.
    What?! The Python Code fori in range(n_documents):! date = datetime.fromtimestamp(! time.mktime(min_date.timetuple())! + int(round(random.random() * delta)))! ! value = random.random()! document = {! 'created_on': date,! 'value': value}! ! batch.append(document)! if len(batch) == batch_size:! collection.insert(batch)! batch = []!
  • 9.
    duration = time.time()- start! ! print 'inserted %d documents per second' % (! n_documents / duration)! The Python Code inserted 30,000 documents per second
  • 10.
  • 11.
    The Question Why isthe Python script 3 times slower than the equivalent Node script?
  • 12.
    Why Profile? • Optimizationis like debugging • Hypothesis:
 “The following change will yield a worthwhile improvement.” • Experiment • Repeat until fast enough
  • 13.
    Why Profile? Profiling isa way to
 generate hypotheses.
  • 14.
    Which Profiler? • cProfile •GreenletProfiler • Yappi
  • 15.
  • 16.
    Yappi Compared to cProfile,it is: ! • As fast • Also measures functions • Can measure CPU time, not just wall
 • Can measure all threads • Can export to callgrind
  • 17.
    Yappi import yappi! ! yappi.set_clock_type('cpu')! yappi.start(builtins=True)! ! start =time.time()! ! for i in range(n_documents):! # ... same code ... ! ! duration = time.time() - start! stats = yappi.get_func_stats()! stats.save('callgrind.out', type='callgrind')! Same code
 as before
  • 18.
  • 19.
    for index inrange(n_documents):! date = datetime.fromtimestamp(! time.mktime(min_date.timetuple())! + int(round(random.random() * delta)))! ! value = random.random()! document = {! 'created_on': date,! 'value': value}! ! batch.append(document)! if len(batch) == batch_size:! collection.insert(batch)! batch = []! The Python Code one third
 of the time
  • 20.
    for index inrange(n_documents):! date = datetime.now()! ! ! ! value = random.random()! document = {! 'created_on': date,! 'value': value}! ! batch.append(document)! if len(batch) == batch_size:! collection.insert(batch)! batch = []! The Python Code
  • 21.
    The Python Code •Before: 30,000 inserts per second • After: 50,000 inserts per second
  • 22.
    Why Profile? • Generatehypotheses
 • Estimate possible improvement
  • 23.
    How Does
 Profiling Work? intcallback(PyFrameObject *frame,! int what,! PyObject *arg);! int start(void)! {! PyEval_SetProfile(callback);! }!
  • 24.
    PyObject *! PyEval_EvalFrameEx(PyFrameObject *frame)! {! if(tstate->c_profilefunc != NULL) {! tstate->c_profilefunc(frame,! PyTrace_CALL,! Py_None);! }! ! /* ... execute bytecode in the frame! * until return or exception... */! ! if (tstate->c_profilefunc != NULL) {! tstate->c_profilefunc(frame,! PyTrace_RETURN,! retval);! }! }!
  • 25.
    int callback(PyFrameObject *frame,! intwhat,! PyObject *arg)! {! switch (what) {! case PyTrace_CALL:! {! PyCodeObject *cobj = frame->f_code;! PyObject *filename = cobj->co_filename;! PyObject *funcname = cobj->co_name;! ! /* ... record the function call ... */! }! break;! ! /* ... other cases ... */! ! }! }!
  • 26.
    A. Jesse JiryuDavis 
 @jessejiryudavis 
 MongoDB