Embed presentation
Download as PDF, PPTX


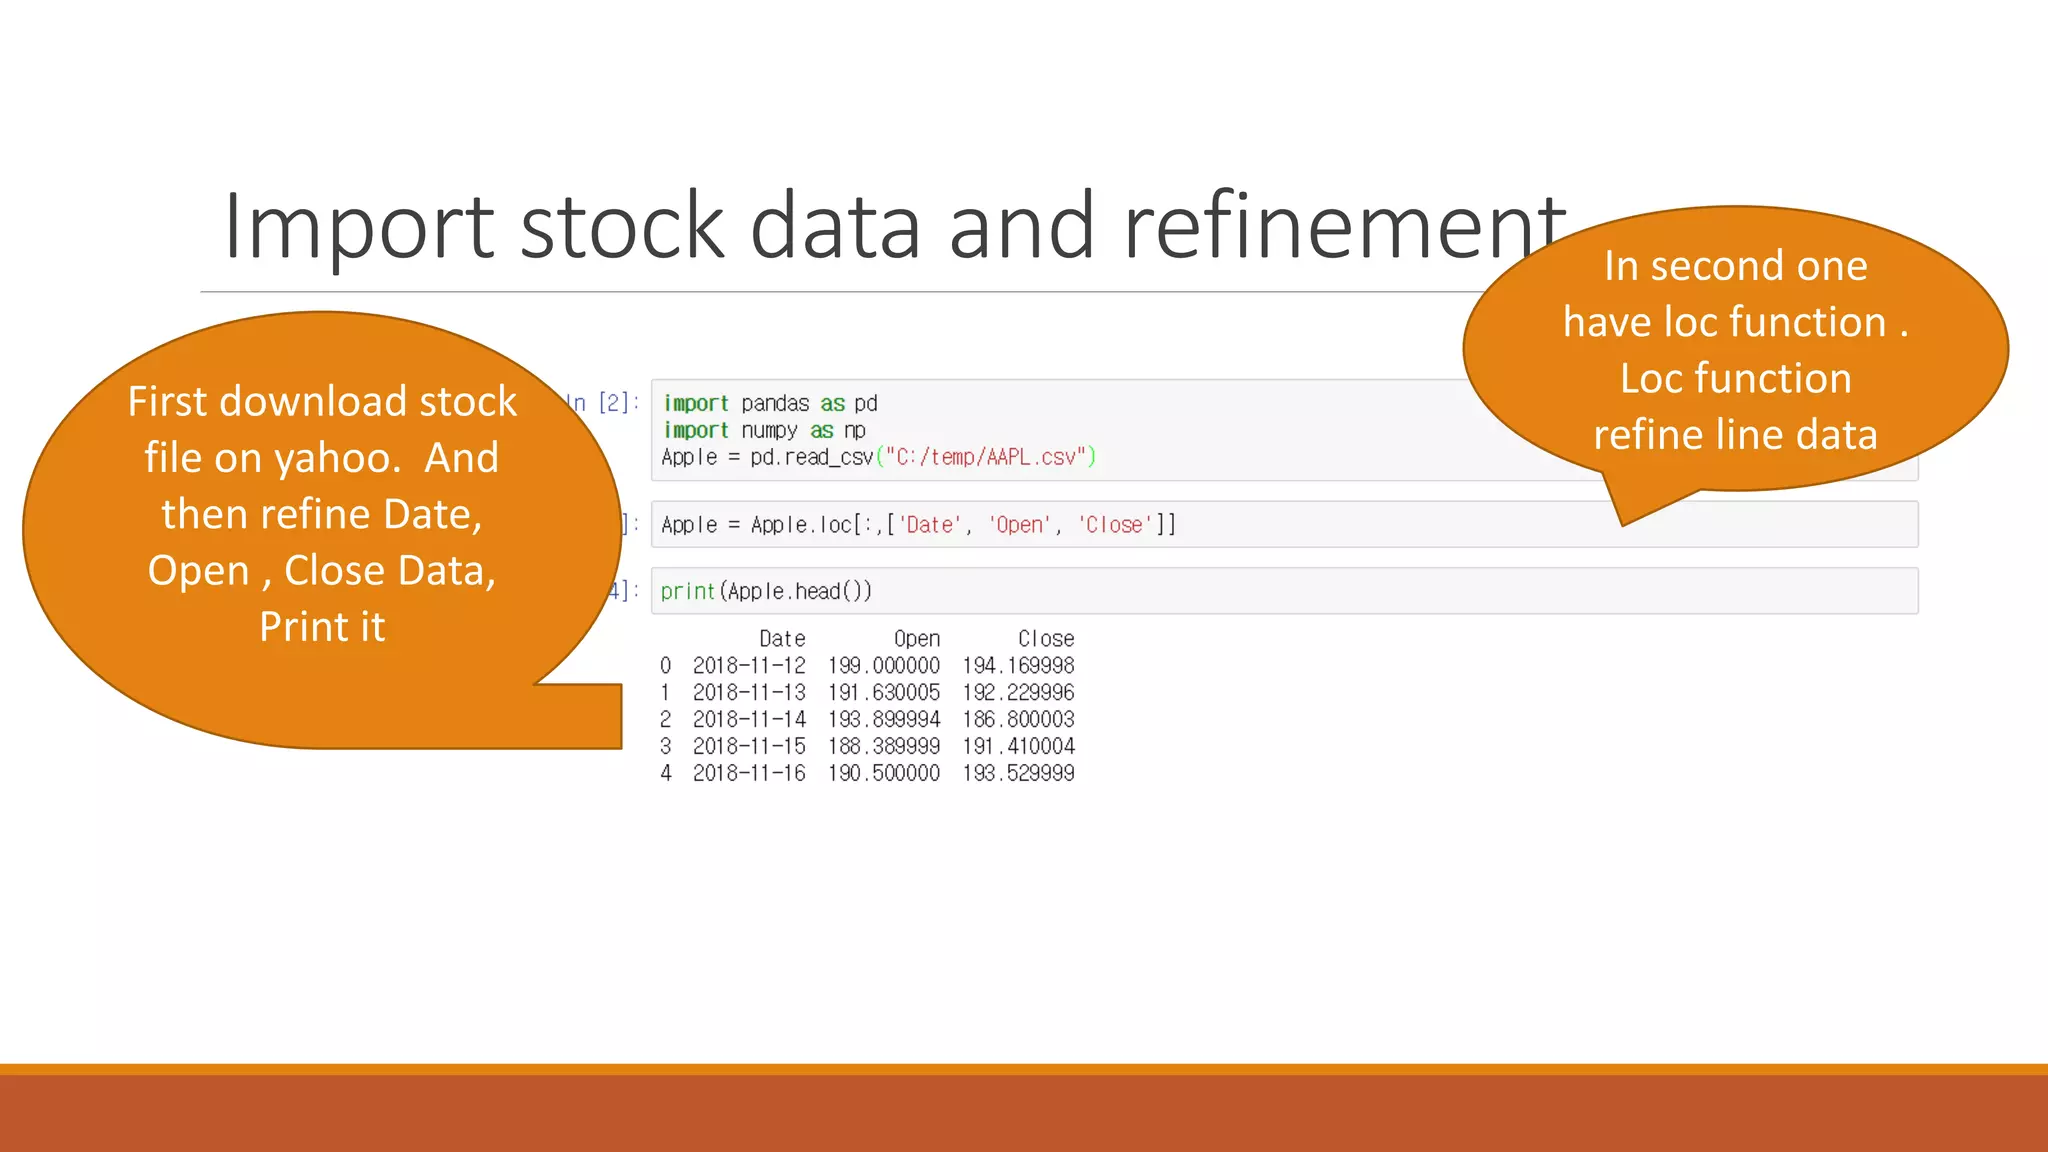
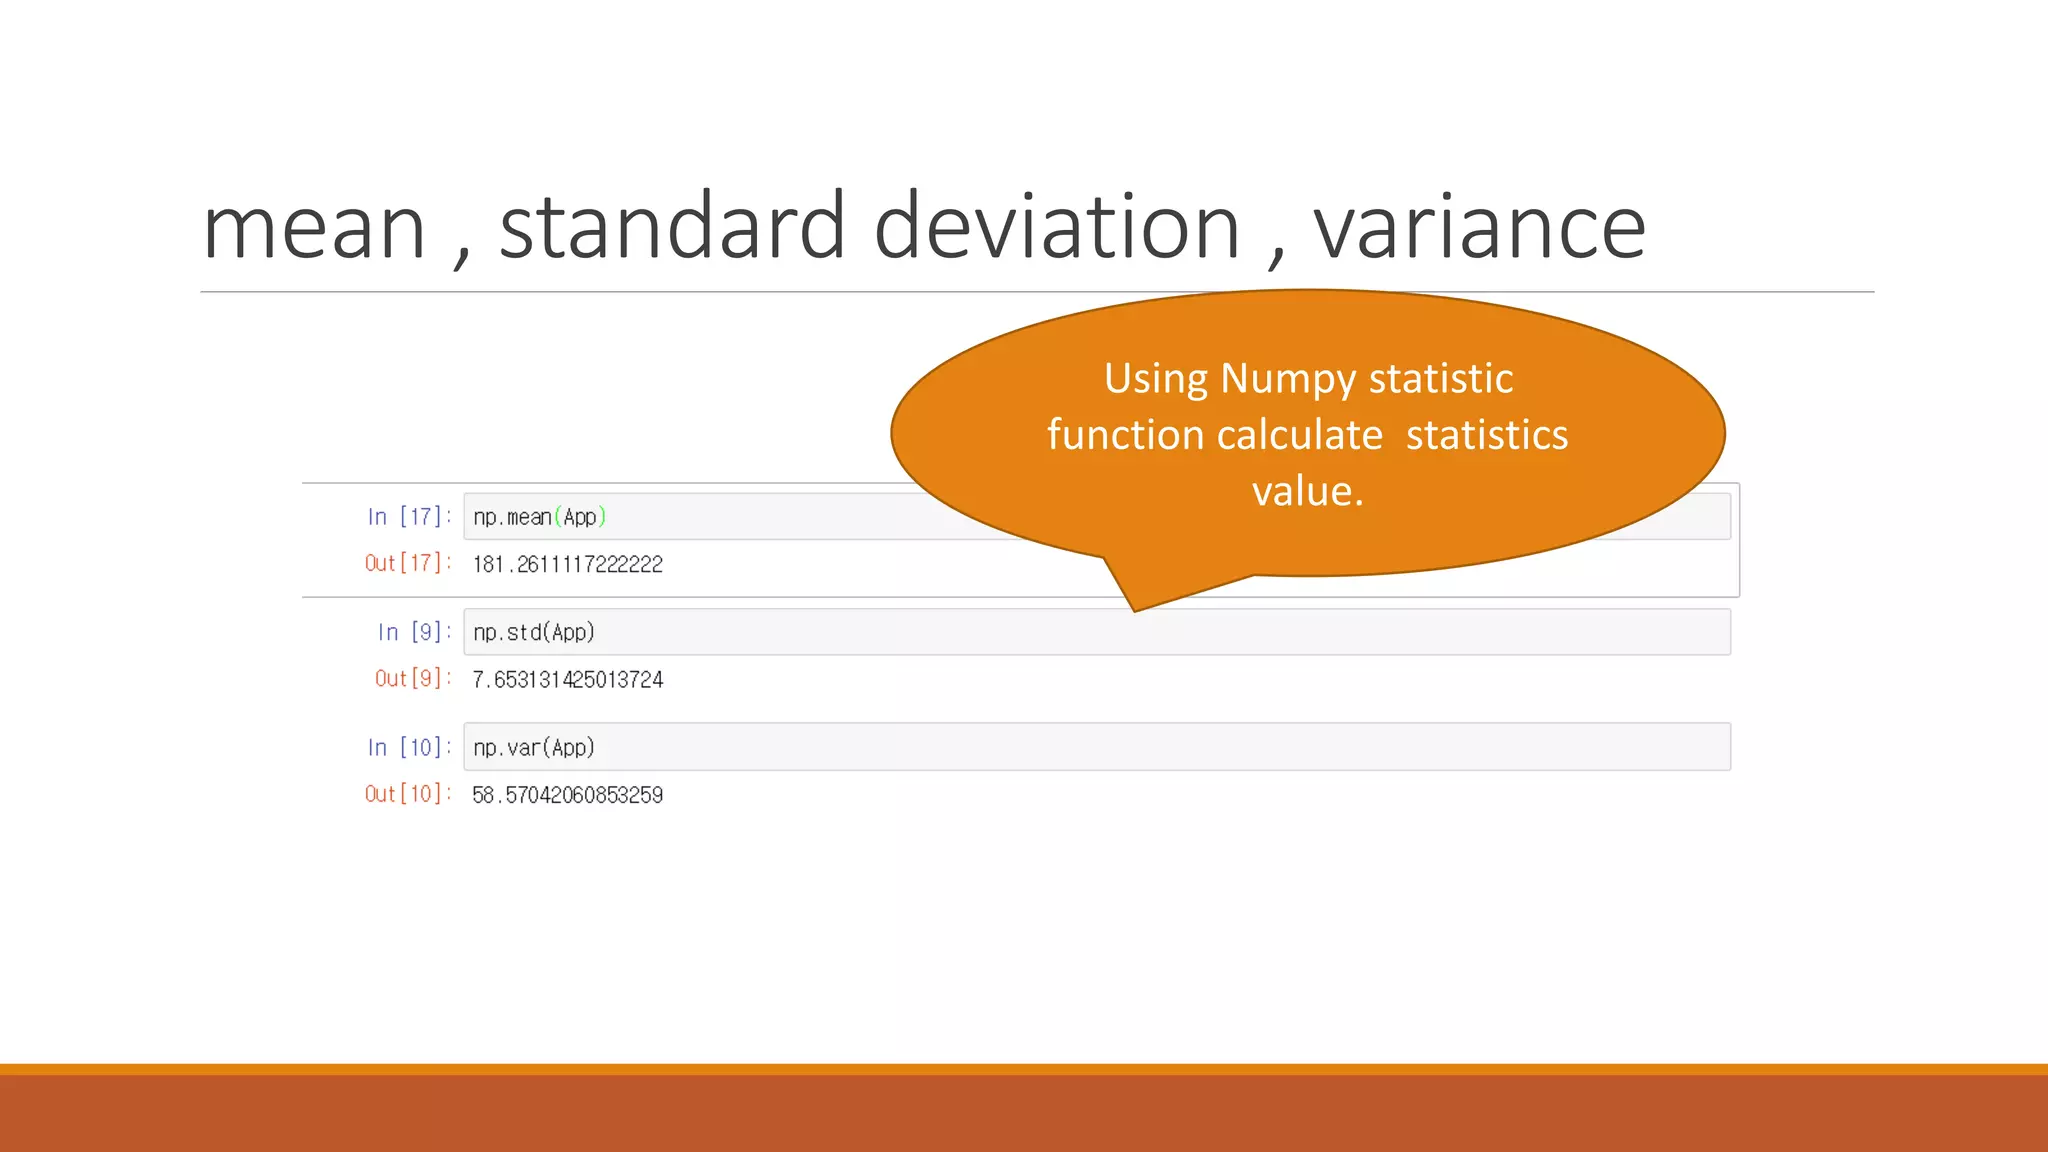
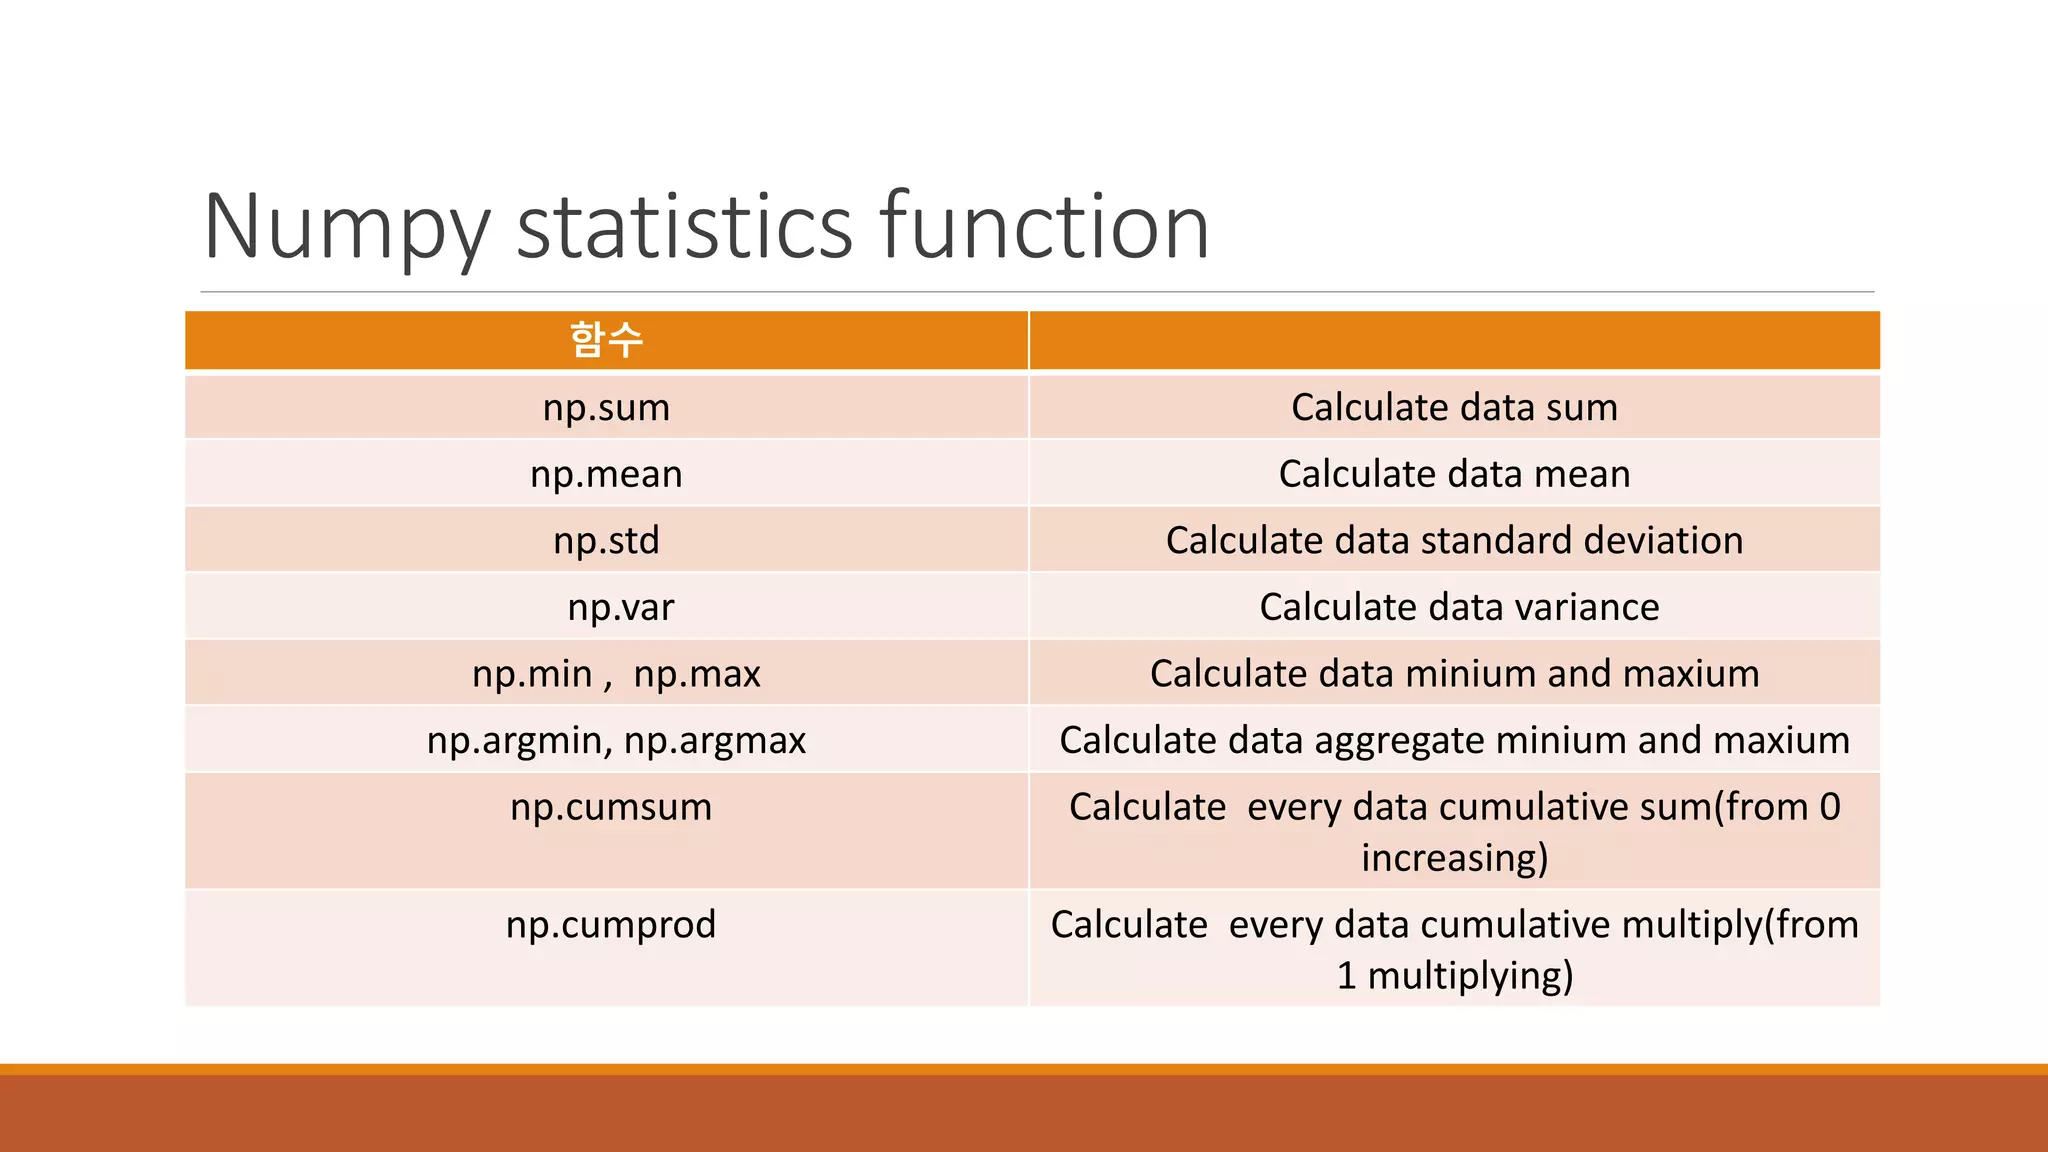
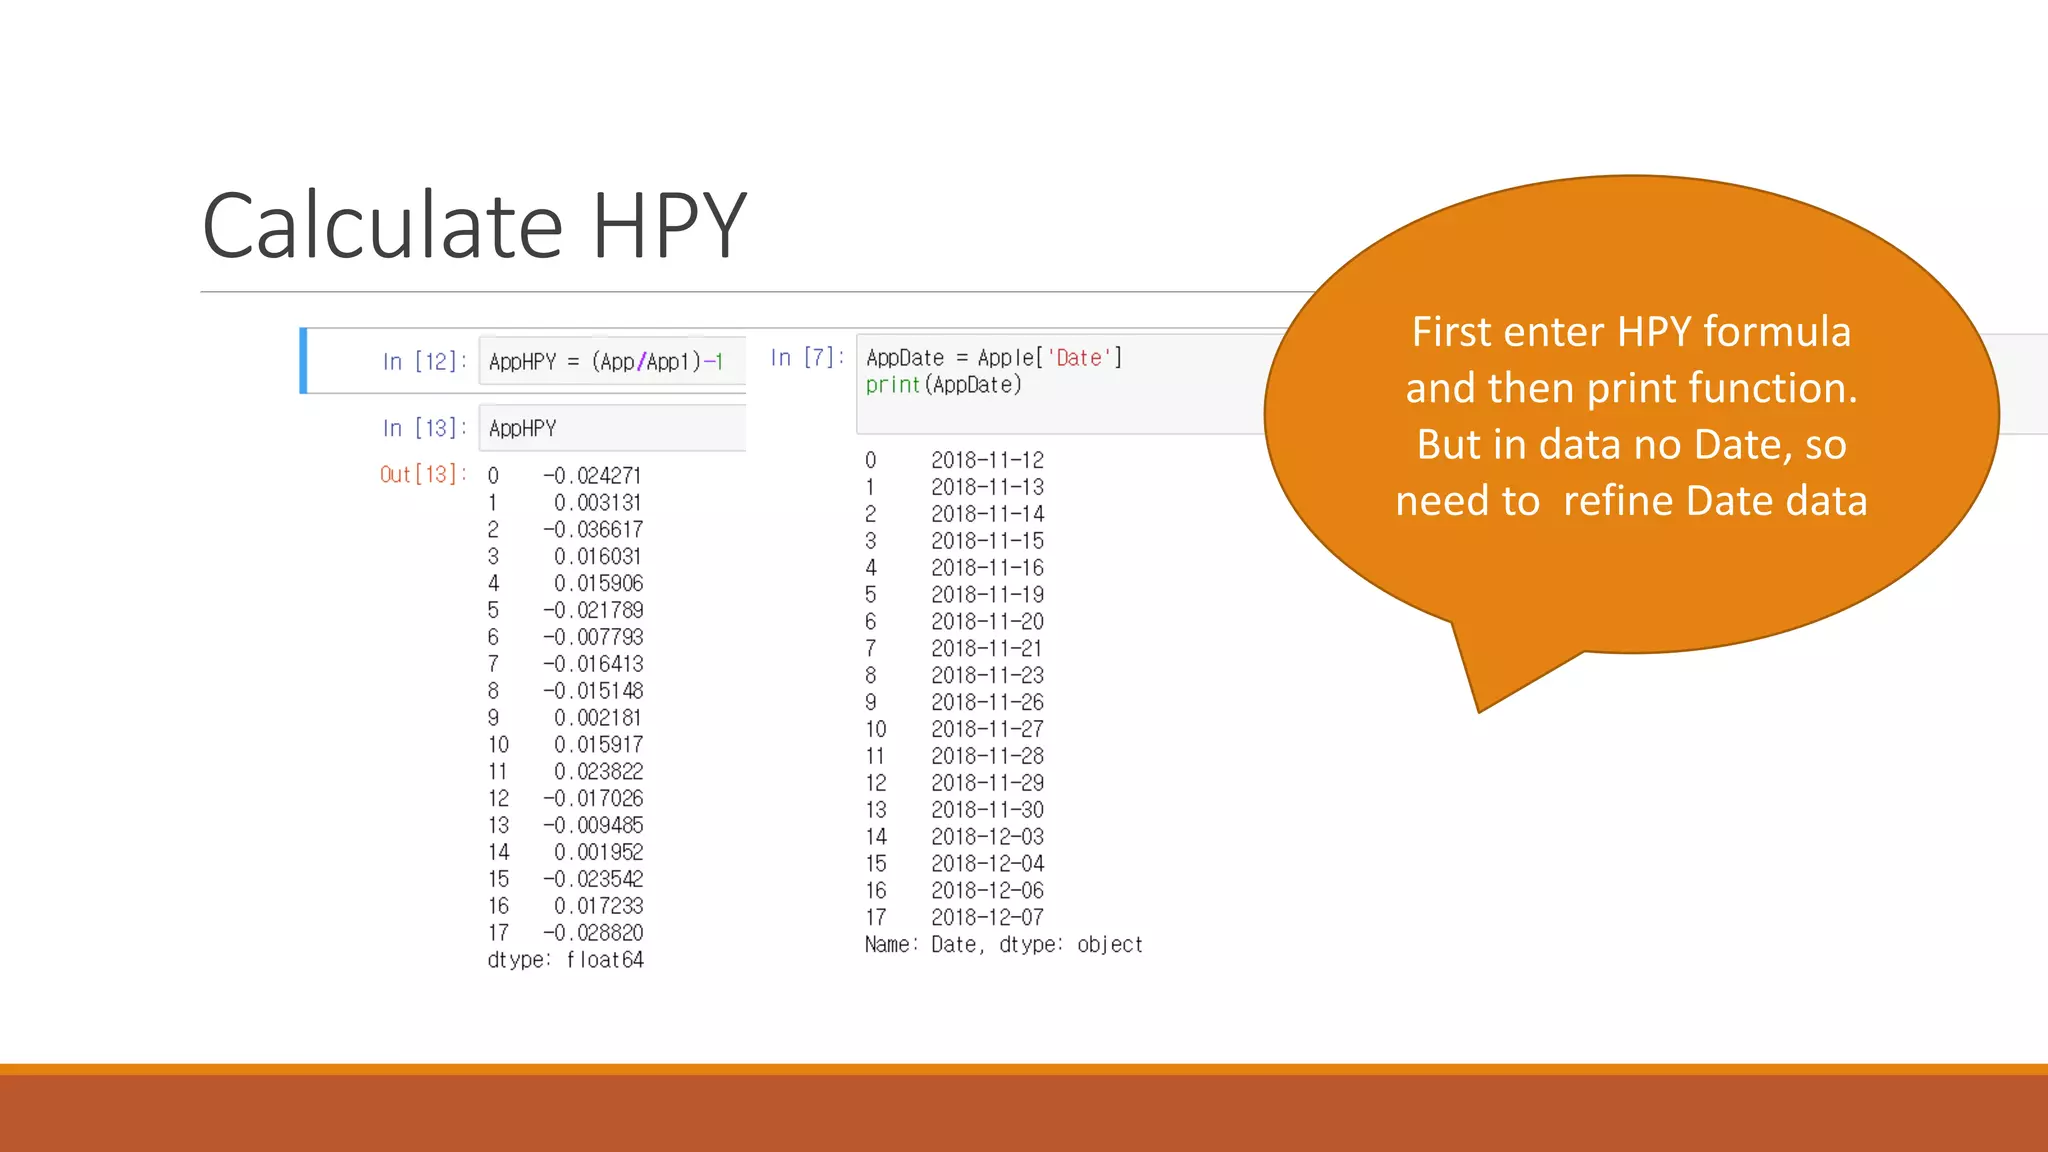
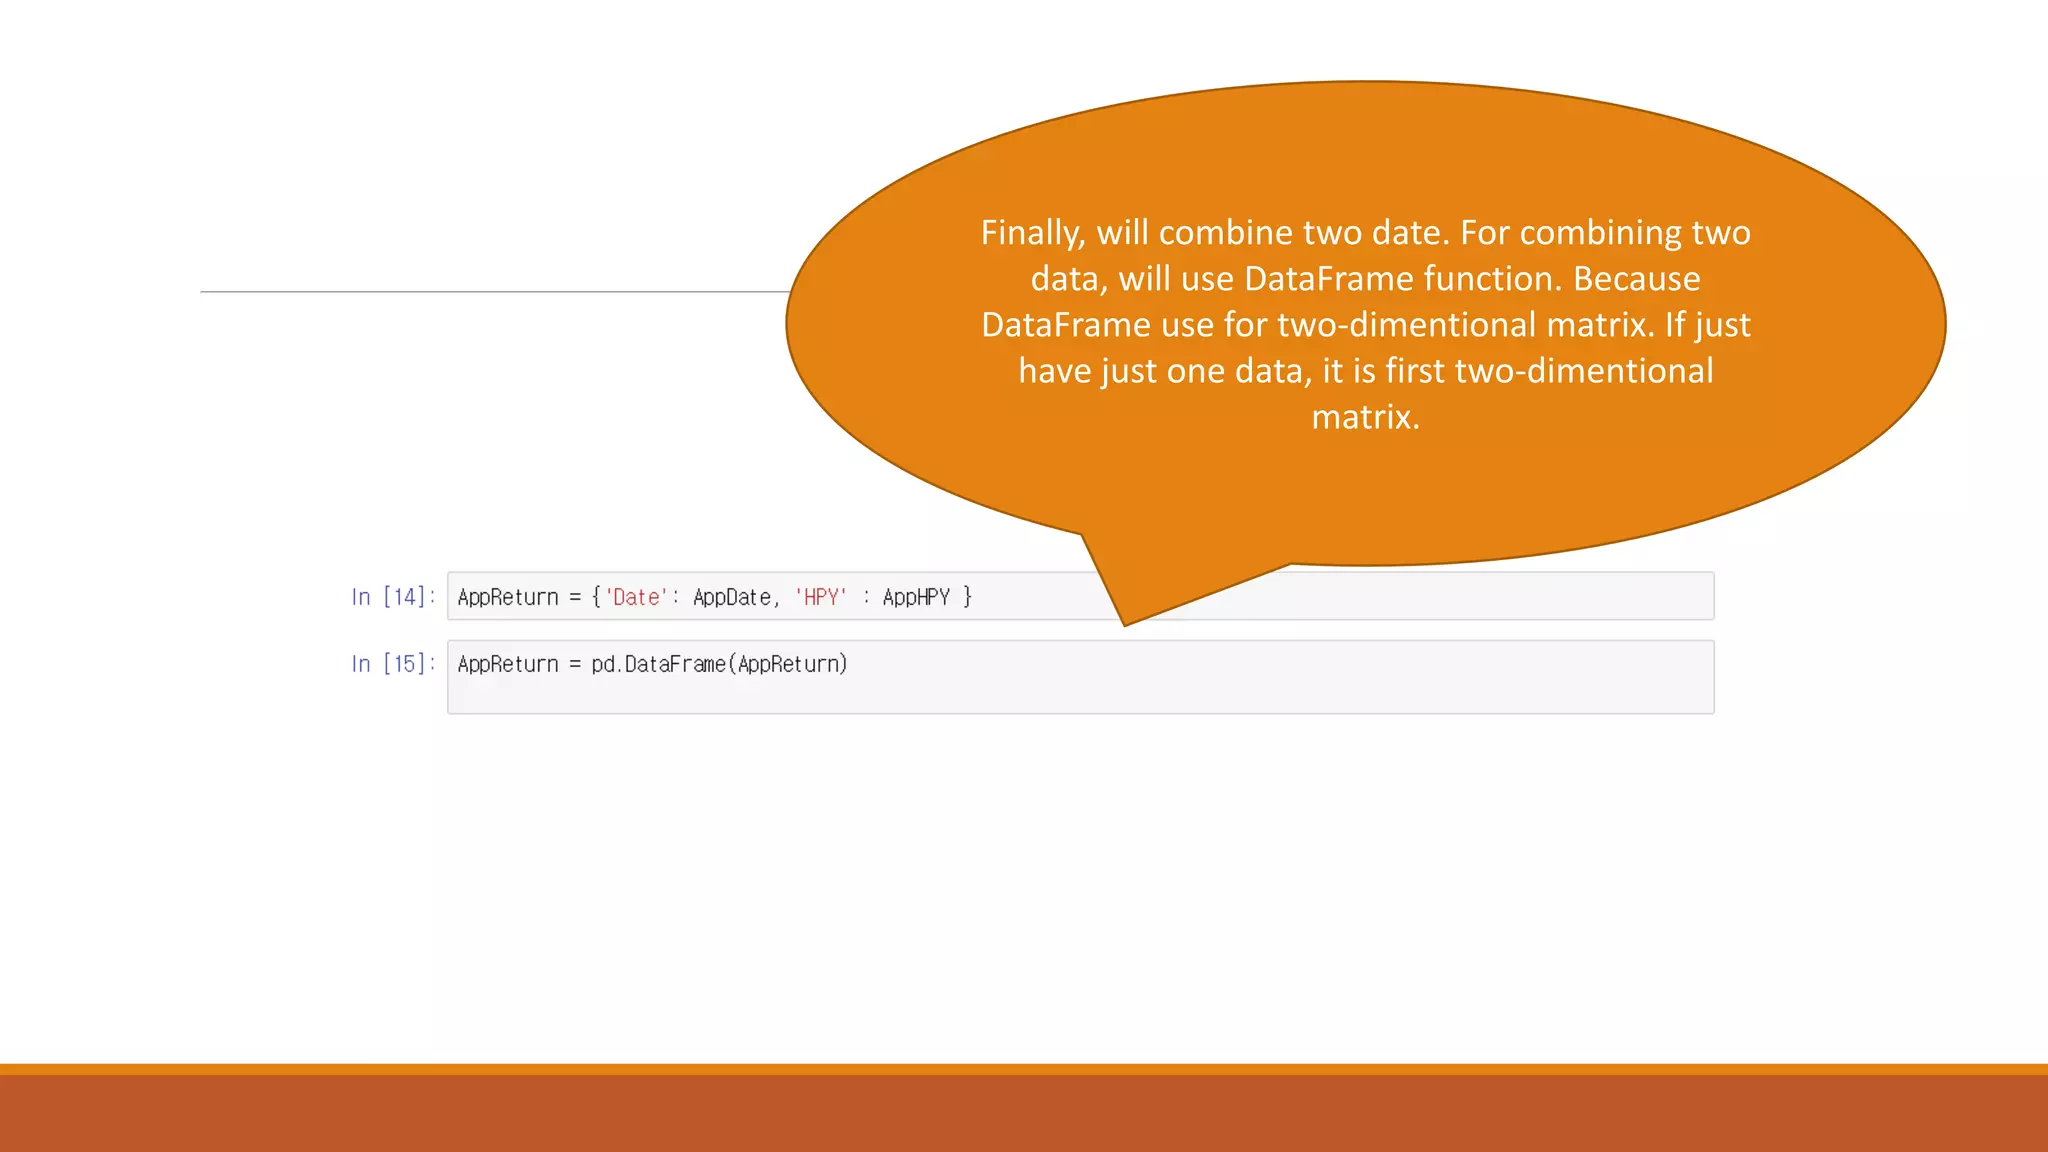
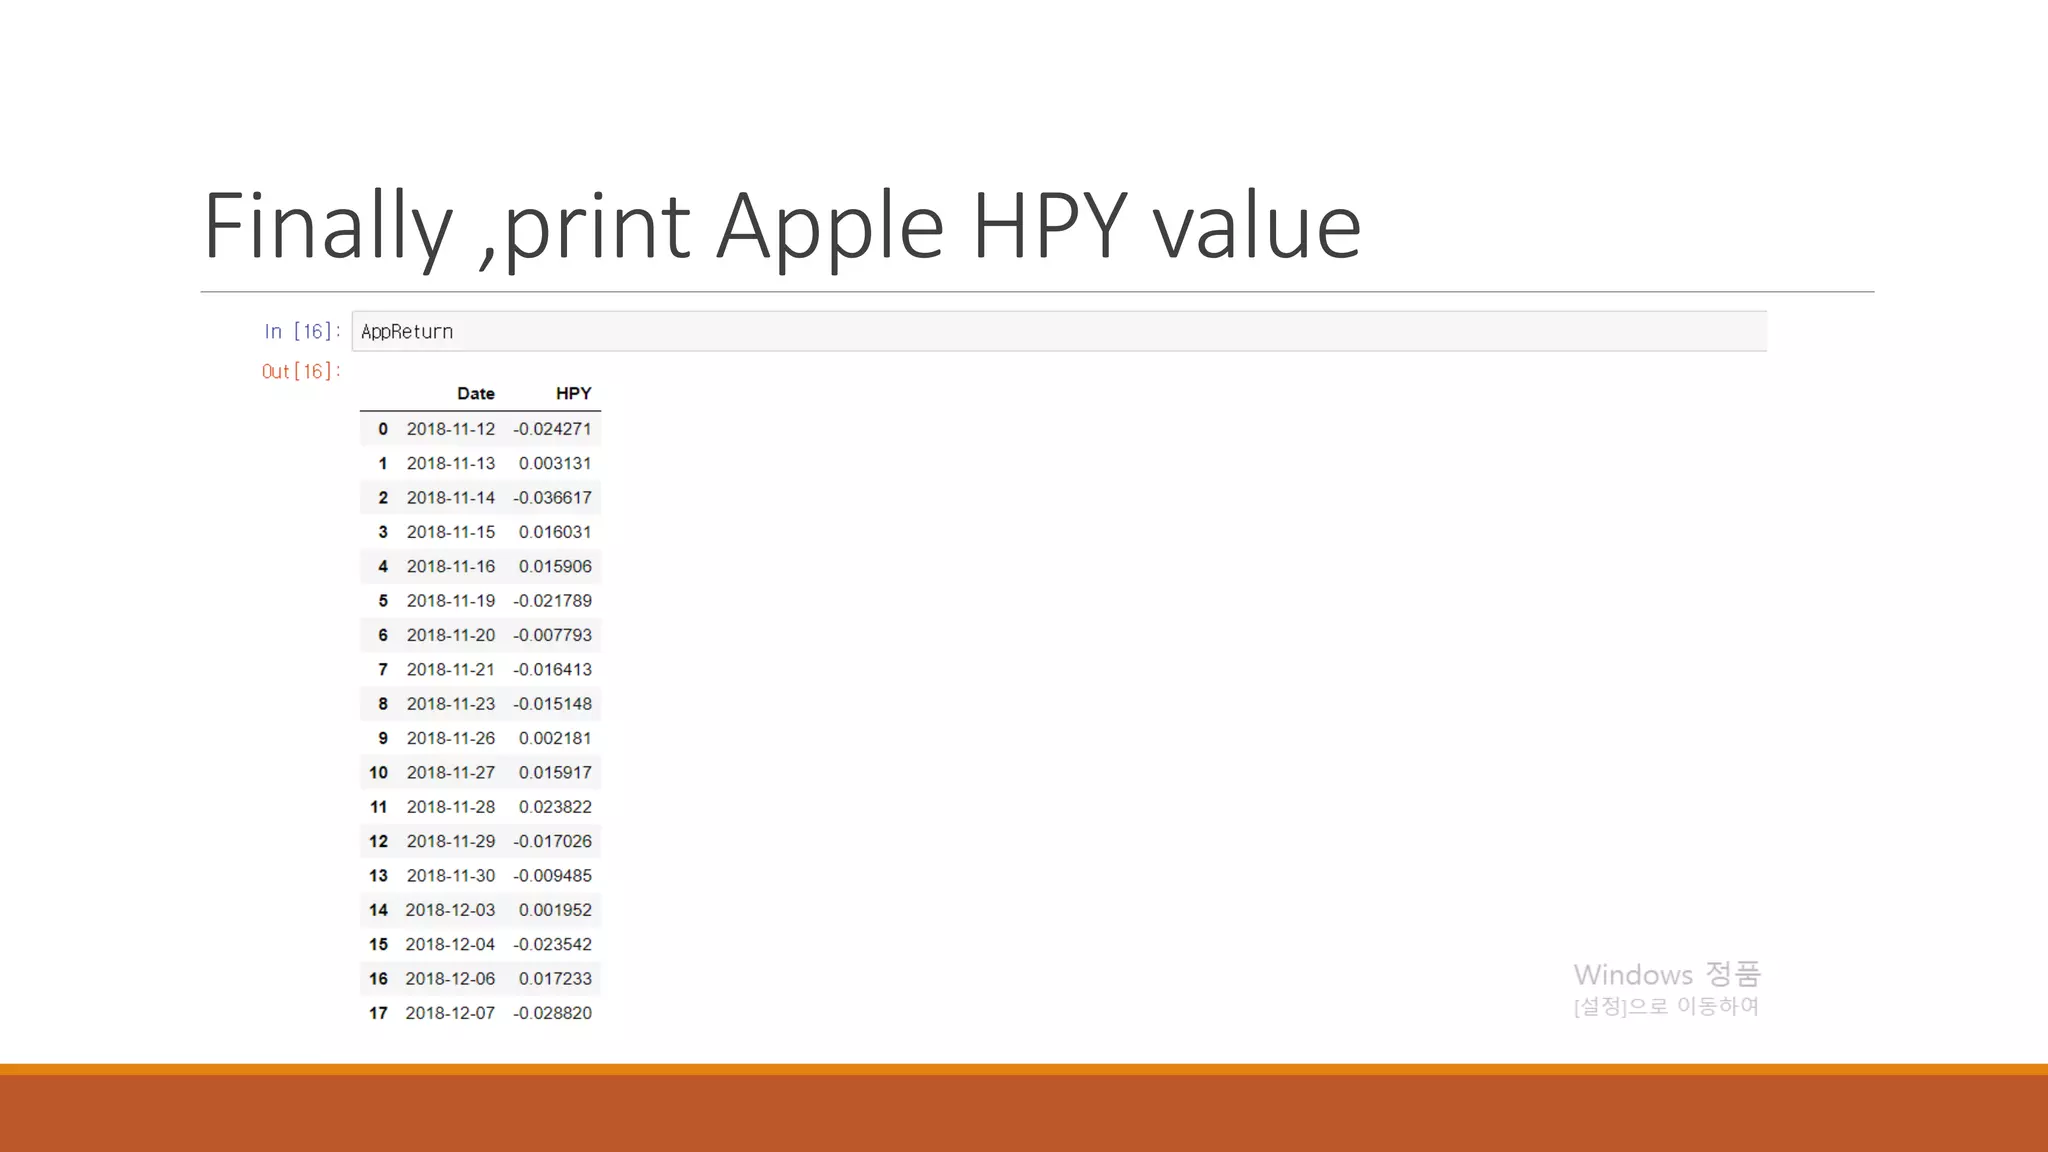
This document discusses using Pandas and Numpy to calculate stock statistics and historical price yield (HPY). It covers importing stock data from Yahoo Finance, refining the data, calculating statistics like mean, variance, and standard deviation using Numpy functions, and combining data to calculate and print the HPY value for Apple stock. The key steps involve understanding Pandas and Numpy, importing and refining stock data, using Numpy functions to calculate statistics, entering the HPY formula, combining date data with a DataFrame, and printing the final HPY value for Apple.


Using Pandas and Numpy to calculate stock statistics and HPY. Introduces Python concepts, including data refinement with Pandas and statistical functions from Numpy.
Discusses key statistics and HPY formulae: mean, variance, and standard deviation essential for stock analysis.
Guides on importing stock data from Yahoo, refining it by filtering relevant columns like Date, Open, and Close.
Utilizes Numpy statistical functions to calculate essential statistics like mean, sum, variance, and cumulative operations.
Details the process of calculating HPY by entering the formula and refining date data for accuracy.
Explains the use of DataFrame function to combine two datasets, essential for effective two-dimensional data representation.
Concludes by printing the calculated HPY value for Apple, showcasing the final result of the analysis.
Ends the presentation with a thank you note and encourages reaching out via email for queries.