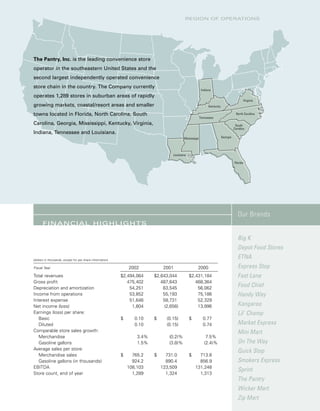
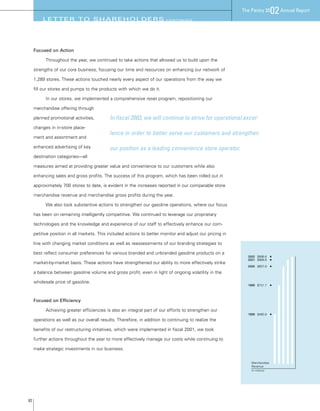
The Pantry, Inc. is the largest convenience store operator in the southeastern United States, operating 1,289 stores across 10 states. In fiscal year 2002, the company focused on operational excellence through strategic investments and initiatives to enhance store performance and gasoline operations. While total revenues declined from $2.6 billion in 2001 to $2.5 billion in 2002 due to lower gasoline prices, the company grew comparable store merchandise sales by 3.4% and gasoline volume by 1.5%. Net income improved to $1.8 million compared to a net loss in 2001, as the company paid down debt and ended the year with $42.2 million in cash.
The Pantry, Inc. 2001 Annual Report summarizes the company's strategic moves in fiscal 2001 to strengthen its future. Despite challenges from rising gas prices and economic downturn, the company streamlined processes, enhanced efficiency, and implemented technology initiatives like new reporting and inventory systems. It acquired 45 stores to strengthen its market position but curtailed aggressive expansion. The Pantry focused on cost cuts, improving merchandise sales, and leveraging new fuel pricing systems to balance profits and volume in a volatile gas market. It positioned itself to capitalize on future growth opportunities once market conditions improve.
PETsMART is a leading retailer of pet supplies with over 500 stores in the US and Canada. In 1999, it had net sales of over $2 billion but an operating loss of $32 million due to losses from selling its UK subsidiary and investing in PETsMART.com. Going forward, PETsMART aims to be the preferred provider for pets' lifetime needs by focusing on "pet enthusiasts" and aligning its business around their needs over the next 3 years, including improving product selection, professional services, customer service, customer experience, and developing a loyalty program. PETsMART believes this strategy will drive operating excellence and strengthen its core business.
The document is Lowe's annual report for 2003. It discusses Lowe's strong financial performance in 2003, with sales increasing 18.1% to $30.8 billion and net earnings growing 27.6% compared to 2002. Lowe's served over 520 million customers in 2003 and opened 130 new stores. The report expresses confidence that demographic and housing market trends will continue to drive growth in home improvement spending.
Monsanto reported record third quarter sales and net income. Sales increased 15% compared to the previous year's third quarter due to increased corn and soybean seed and traits sales in the US and the inclusion of sales from the recently acquired Seminis vegetable seed business. Net income increased significantly due to higher revenues and a prior year write-off related to acquisitions. For the first nine months of the year, sales increased 19% and net income increased significantly, driven by growth in US corn and soybean seed and traits and herbicide sales. Monsanto also confirmed its full year earnings per share guidance.
The Pantry, Inc. achieved strong financial growth in fiscal year 1999 through an aggressive acquisition strategy and enhanced merchandising initiatives. The company acquired 297 stores, grew total revenues 70.5% to $1.678 billion, and expanded its store count to 1,274 locations across 8 Southeastern states. Merchandise same-store sales increased 9.6% and gasoline same-store sales grew 5.9% due to offering customers a broader selection of branded and unbranded fuel. Net income was $10.4 million compared to a loss of $3.3 million in 1998. The company plans to continue its acquisition strategy and increase sales through new merchandising programs.
Gafisa is one of Brazil's largest homebuilders, with a national footprint and a diverse land bank. In 2009, Gafisa saw increases in launches, pre-sales, revenues and EBITDA compared to 2008. For 2010, Gafisa aims to launch between R$4-5 billion in projects, with 40-45% dedicated to affordable housing through Tenda, and expects an EBITDA margin between 18.5-20.5%. Gafisa also completed the acquisition of the remaining shares of Tenda, diversified its brands and geographies, and secured R$600 million in new financing.
This document provides supplemental operating information for Alltel Corporation for 2007. It includes details on controlled areas, customers, penetration rates, average customers, gross and net customer additions, cash costs, revenues, and other metrics. Key details include that as of 2007, Alltel had over 12.7 million customers, controlled nearly 79.4 million POPs, and generated over $7 billion in service revenues for the year.
Dole Food Company's 1998 annual report summarizes the company's operations, financial results, and outlook. The year was challenging due to adverse weather conditions affecting production and economic crises slowing some markets. Despite these difficulties, most core businesses performed well. The report notes two special charges taken in Q4 1998 relating to damage from Hurricane Mitch in Honduras and a citrus freeze in California. It provides an overview of the company's worldwide operations, acquisitions in the flower industry, and positive outlook as business returns to normal in 1999 with the new headquarters facility nearing completion.
Henry Schein is the largest distributor of healthcare products and services to office-based healthcare practitioners in North America and Europe. In 2002, Henry Schein achieved record financial results with net sales of $2.8 billion, operating income of $196 million, and net income of $117 million. The company expects continued growth through increasing penetration of existing customers, gaining new customers, and cross-selling between its business groups that serve the dental, medical, veterinary, and technology markets.
This document is NCR Corporation's 2000 annual report. It summarizes the company's financial performance for 2000, including revenue of $5.959 billion and operating income of $270 million, a 33% increase over 1999. It discusses NCR's key business solutions of retail store automation, financial self service (ATMs), and data warehousing. It also describes organizational changes made in 2000 to position the business for growth, including creating separate operating units for retail/financial and data warehousing.
Nordstrom reported strong financial results for fiscal year 2003, with net sales increasing 8.6% to $6.49 billion and net earnings increasing 169.2% to $242.8 million. The company saw improvements in key metrics like gross profit margin and inventory turnover. Nordstrom aims to further enhance the customer experience through new technologies like touchscreen registers and personal book software. The report discusses Nordstrom's focus on disciplined growth, delivering the right merchandise assortments to each store, and leveraging technology improvements to better serve customers and drive profitable growth.
The Pantry, Inc. is the largest independently operated convenience store chain in the southeastern United States, operating 1,385 stores across 10 states under brands such as The Pantry, Kangaroo Express, Golden Gallon, and Lil' Champ Food Store. In fiscal year 2003, The Pantry saw improved financial performance with earnings per share of $0.82 compared to $0.10 in 2002. Key initiatives included completing a store reset program to boost sales and margins, negotiating new gasoline supply agreements, upgrading 173 stores with new branding, and acquiring 138 Golden Gallon stores.
Chiquita Brands International is a leading marketer and producer of bananas and other fresh produce. In 2004, the company achieved several financial and operational goals including 18% sales growth to $3.1 billion, a 23% increase in operating cash flow to $92 million, and an 11% reduction in total debt. The CEO discusses the company's strategy to strengthen its core banana business, pursue profitable growth through new acquisitions and segments, build a high-performance organization, and improve profitability in North America. Key goals for 2005 include completing the acquisition of Fresh Express to diversify product offerings and integrating the new leadership team to execute the long-term strategy.
Baxter International Inc. reported an 8% increase in net sales from continuing operations for the first quarter of 2005 compared to the same period in 2004. Net income increased 26% to $226 million. Sales growth was driven by an 11% increase in BioScience sales and a 6% rise in Medication Delivery sales, with international sales increasing 13% compared to a 2% growth in US sales. Basic earnings per share from continuing operations grew 16% to $0.36.
Parker is the world's leading manufacturer of motion and control technologies, providing precise engineered solutions across commercial, industrial, and aerospace markets. For fiscal year 1999, Parker reported record sales of $4.96 billion, income from operations of $538.7 million, and net income of $310.5 million, despite a softening in industrial demand. Parker is strategically diversified across industries and geographies, with no single customer accounting for more than 4% of sales, positioning it for continued global growth.
CVS achieved strong financial results in 2000, with record sales, operating profit, and net earnings. CVS is positioned for continued growth by focusing on its vision to be the most customer-focused, innovative, and convenient healthcare retailer. Key factors driving growth in the retail pharmacy industry include the introduction of new drugs, an aging population, and expanding managed care. CVS is well-positioned to capitalize on these opportunities through its expanding network of CVS/pharmacy stores, CVS ProCare specialty pharmacies, PharmaCare pharmacy benefits management business, and CVS.com online pharmacy.
- Tricon Global Restaurants owns KFC, Pizza Hut, and Taco Bell restaurant chains. In 2001, the company saw increases in ongoing operating profit, net income, and earnings per share compared to 2000, though total revenues declined slightly.
- The company aims to improve customer satisfaction ratings by focusing on running great restaurants and improving the customer experience, which it recognizes is an area that needs significant improvement. It plans to train employees to have a "Customer Mania" mindset with the goal of becoming the best in the industry for customer service.
Yum! Brands achieved 13% earnings per share growth in 2005, driven by continued international expansion and strong performance in the US at Taco Bell and KFC. The company's diversified global portfolio helped it weather challenges like high gas prices and avian flu concerns. International markets contributed significantly to growth, with the franchise business achieving double digit sales and profit increases and over 700 new restaurants opening internationally. The company is focused on further developing high growth markets like China, India, Russia, and Europe to drive continued profitable expansion.
#
3 Drive Same Store Sales same store sales growth at Taco Bell and KFC in the U.S.
Growth Through was outstanding. Taco Bell achieved a remarkable
In 1998, CVS experienced tremendous growth and accomplishments across key measures. CVS operated over 4,000 stores, the largest drugstore chain in America. CVS opened a record 382 new stores and remodeled 1,900 Revco stores. CVS acquired the Arbor drugstore chain, making it the market leader in Detroit. CVS filled more prescriptions than any other retailer in America and achieved sales growth of 11.1% to $15.3 billion.
This document is the 1998 annual report of Gannett Co., Inc. It summarizes the company's strong financial performance in 1998, with operating revenues exceeding $5 billion for the first time. It also discusses strategic acquisitions that benefited shareholders, including expanding in New Jersey newspapers. While economic conditions may be uncertain, the company's tradition of consistent fiscal management has served it well.
Parker is a global company that provides motion and control technologies. It is focused on creating technological breakthroughs, serving diversified markets around the world, and achieving new financial goals. Parker reported increased net sales, income from operations, net income, and cash flows from operating activities from 1999 to 2000. The company is positioned for consistent double-digit growth through expanding in core markets and new growth areas around the world. Parker is developing new technologies to advance industries like manufacturing, communication, and biomedical science.
charter communications 1Q_2008_Earnings_Presentationfinance34
Charter Communications reported first quarter 2008 results. Revenue grew 10.5% to $1.56 billion driven by increases in high-speed internet, telephone, and commercial customers. Adjusted EBITDA also increased 10.5% to $545 million. The company added over 302,000 customers during the quarter and nearly doubled telephone customers year-over-year to 1.1 million. Charter aims to continue growing revenue and adjusted EBITDA through bundling video, internet, and telephone services and increasing penetration of triple play packages.
Charter Communications reported strong financial results for the second quarter of 2007, with double-digit revenue and adjusted EBITDA growth driven by increases in high-speed internet and telephone customers. Revenue grew 11% year-over-year to $1.498 billion, while adjusted EBITDA rose 11% to $539 million. The company saw strong growth in its bundled customer base and average revenue per user. Charter also continued the expansion of its advanced services such as HD and DVR set-top boxes.
The document outlines the charter of The Pantry, Inc.'s Corporate Governance and Nominating Committee. The committee assists the board in identifying and evaluating qualified individuals for board membership and ensuring high standards of corporate governance. It is responsible for recommending nominees for board and committee positions, monitoring independence, reviewing governance policies, and overseeing compliance with codes of conduct and public disclosure requirements. The committee has authority to retain outside advisors and performs evaluations of board performance.
- Advanced Micro Devices reported a net loss of $600 million for the quarter ended June 30, 2007, bringing the total net loss for the first half of 2007 to $1.211 billion.
- Revenue increased 11.9% compared to the previous quarter but the gross margin percentage declined from 28.1% to 33.5% due to higher costs.
- Research and development expenses increased 9.5% compared to the previous quarter as the company continued investing in new products.
This document is a proxy statement from Charter Communications providing information about voting at the company's upcoming annual shareholder meeting. It outlines the items to be voted on including electing one Class A/Class B director, ratifying the 1999 Option Plan, and approving the 2001 Incentive Plan. It provides details on shareholder voting eligibility, the director nomination process, and vote requirements for passing each proposal. Shareholders are asked to vote by proxy in advance of the meeting.
- AMD reported net sales of $1.33 billion for Q1 2006, down 28% from $1.84 billion in Q4 2005. Gross margin increased to 58.5% from 46.4% driven by improved product mix.
- Operating income was $258.6 million in Q1 2006 compared to $205.7 million in Q4 2005, as gross margin gains offset lower sales. R&D and marketing expenses remained relatively flat quarter-over-quarter.
- Net income for Q1 2006 was $184.5 million versus $95.6 million in Q4 2005, benefiting from higher operating income and lower interest expenses.
This document is Charter Communications' 2002 Annual Report. It provides financial and operating summaries for the year. Key points include:
- Revenues grew 15% to $4.56 billion while adjusted EBITDA rose 16.4% to $1.796 billion.
- Customer relationships declined to 6.634 million from 6.953 million in 2001. However, revenue generating units rose to 10.422 million.
- High-speed data customers increased significantly to 1.138 million while digital and analog video customers declined slightly.
- The report addresses challenges faced in 2001-2002 including customer losses, financial restatements, and regulatory investigations. However, it emphasizes progress in growing revenues from broadband services
The document provides an overview of The Pantry, Inc., a leading convenience store retailer concentrated in the southeastern United States. It discusses the company's strong market position, growth opportunities, and financial performance. Key points include its focus on attractive southeastern markets, significant scale advantages, benefits from consumer trends toward convenience formats, and ability to generate strong cash flows and earnings growth.
Advanced Micro Devices reported financial results for Q4 2008 and full year 2008. For Q4, revenue declined 35% year-over-year to $1.2 billion, and the company reported a net loss of $1.4 billion. For the full year, revenue declined slightly to $5.8 billion while the net loss widened to $3.1 billion. The Computing Solutions segment experienced significant operating losses for both the quarter and year. Advanced Micro Devices' financial position also weakened, with cash balances declining by over 40% and stockholders' deficit reaching $82 million.
This document outlines the bylaws of The Pantry Inc. regarding meetings of stockholders. It discusses annual meetings, special meetings, notice requirements, quorums, voting procedures, and rules for stockholders to propose business or nominations at annual meetings. Key details include requirements that notice of meetings be given 10-60 days in advance, that a majority of shares constitutes a quorum, and that stockholders must meet certain criteria to propose other business or nominations at annual meetings.
Quest Diagnostics acquired SmithKline Beecham Clinical Laboratories in 1999, making it the clear leader in diagnostic testing in the US. Net income excluding special items was $41.2 million in 1999 compared to $26.9 million in 1998 due to the acquisition. However, after special items related to the acquisition, the company reported a net loss of $3.4 million. The company's strategy is focused on capitalizing on its position in diagnostic testing, becoming a leading provider of medical information by leveraging its large database of test results, and becoming recognized as the quality leader in healthcare services.
This annual report summarizes the financial highlights and strategic goals of Quest Diagnostics for 2007. Some key points:
- Revenues increased 7% to $6.7 billion, operating income was $1.1 billion, and net earnings per share were $2.84.
- The company aims to grow revenues above industry rates, expand operating margins to 20% of revenues, and derive 10% of revenues internationally within 5 years.
- The strategy focuses on putting patients first, driving growth, and investing in people. Diversification efforts include expanding offerings in cancer diagnostics, gene-based testing, and point-of-care testing.
- Information technology is highlighted as a key differentiator
Charter took steps in 2006 to grow customer and stockholder value by aggressively rolling out telephone and bundled service offerings and enhancing customer service capabilities. This helped drive a 10% increase in revenue and 5% increase in adjusted EBITDA for 2006. Charter focused on improving the customer experience, increasing bundled product sales, focusing resources on high-return investments, and improving its balance sheet. Going forward, Charter believes it is well positioned for continued growth in 2007 and beyond with the strategies and momentum built in 2006.
The Pantry Inc. achieved record financial results in fiscal 2000 through strategic acquisitions that added 143 new stores across six states, bringing its total store count to 1,313 locations. The acquisitions strengthened the company's presence in existing markets like North Carolina, South Carolina, Florida, Georgia, and Virginia, and also allowed entry into the Mississippi market through the purchase of 19 Big K stores and 17 Metro Petroleum stores. Looking ahead, The Pantry plans to continue its strategy of growth through acquisitions, with a goal of adding approximately 150 new locations in the coming fiscal year to further expand its retail network across the Southeastern United States.
Charter Communications' 2004 annual report summarizes the company's performance for the year and goals for the future. The company increased its revenues by 3% to $4.977 billion for 2004, though adjusted EBITDA remained flat at $1.926 billion. Charter focused on growing its digital, high-speed internet, and telephone services, adding new customers in each area. Going forward, the company aims to improve customer service and operational execution through its new "Focus on Excellence" initiative to help drive further growth. Charter's leadership is confident that its network infrastructure and product offerings position it for continued expansion of its business.
- Advanced Micro Devices, Inc. (AMD) filed an annual report on Form 10-K with the SEC for the fiscal year ended December 27, 2008.
- In 2008, AMD decided to divest its Digital Television and Handheld business units and completed the sale of its Digital Television business to Broadcom for $141.5 million.
- AMD entered into an agreement to form a manufacturing joint venture called The Foundry Company with Advanced Technology Investment Company to manufacture AMD's semiconductor products in exchange for ownership interests in The Foundry Company and $700 million in cash from ATIC.
This document is the 2002 proxy materials and 2001 financial report for Charter Communications, Inc. It includes information such as the notice of annual meeting, proxy statement, executive compensation details, and financial reports. Shareholders are being asked to vote on the election of one Class A/Class B director and the ratification of the appointment of KPMG LLP as the independent public accountants. The sole holder of Class B shares will vote for the seven other director nominees. A plurality vote is required for the director election and a majority vote is required to ratify the appointment of the public accountants.
The document is a notice of the annual meeting of stockholders of Quest Diagnostics Incorporated to be held on May 4, 2004. The purposes of the meeting are to elect three directors for three-year terms, ratify the selection of PricewaterhouseCoopers LLP as the independent auditor, and transact any other business properly brought before the meeting. Stockholders of record as of the close of business on March 8, 2004 are entitled to vote.
The Pantry is the second largest independently operated convenience store chain in the US. In fiscal 2001, The Pantry focused on implementing strategic moves to strengthen its future, including streamlining processes, enhancing efficiency, and directing resources to improve operations. Key actions taken were curtailing acquisitions, centralizing administrative functions to reduce costs, and implementing technology solutions to better monitor performance and enhance efficiency at the corporate and store levels. While fiscal 2001 proved challenging due to economic conditions, The Pantry is positioned to benefit from its strategic moves once market conditions improve.
The Pantry had a very successful fiscal year 1999, achieving strong growth and financial results. They completed several major acquisitions, expanding their store count to 1,274 stores across 8 states. Total revenues increased 71% to $1.68 billion from fiscal year 1998. Net income was $14 million compared to $4.67 million in 1998. The company's IPO in June 1999 strengthened their balance sheet and allowed them to continue an aggressive acquisition strategy to take advantage of opportunities in the fragmented convenience store industry.
The 2001 annual report discusses Group 1 Automotive's record financial and operational results for the year. Revenues increased 11% to over $3.9 billion while earnings per share grew 38% to $2.59. The company benefited from a diversified revenue mix, with 40% of revenues and 85% of profits coming from areas other than new vehicle sales. Going forward, Group 1 plans to pursue additional acquisitions to take advantage of opportunities in the automotive retailing industry.
The document provides the questions and answers from the Q1 FY06 earnings call for ConAgra Foods. Some key details from the summary include:
- Sales grew for major brands like Butterball but declined for brands like ACT II. Retail Products volume declined 3% while Foodservice increased 4%.
- Depreciation and amortization was $89 million. Capital expenditures were $71 million and net interest expense was $68 million. Corporate expense was $73 million.
- Gross margin was 21.6% and operating margin was 10.9%. The effective tax rate for FY06 is estimated to be 36%.
The Sherwin-Williams Company 2002 Annual Report summarizes the company's financial performance for the year. It discusses the company's four business segments: Paint Stores (63.7% of sales), Consumer (22.7% of sales), Automotive Finishes (8.8% of sales), and International Coatings (4.7% of sales). It also highlights that net sales were $5.18 billion for 2002, income before accounting changes was $310.7 million, and return on sales was 6.0%.
The Sherwin-Williams Company 2002 Annual Report summarizes the company's financial performance for the year. It discusses the company's four business segments: Paint Stores (63.7% of sales), Consumer (22.7% of sales), Automotive Finishes (8.8% of sales), and International Coatings (4.7% of sales). It also highlights that net sales were $5.18 billion for 2002, income before accounting changes was $310.7 million, and net income was $127.6 million. The report indicates Sherwin-Williams has been a leading force in the coatings industry for 137 years.
Groupon has over 190,000 merchants worldwide across over 190 categories, with a salesforce of over 4,800 representatives enabling deals in 175 North American markets and 45 countries. In the first 9 months of 2011, Groupon featured deals from over 190,000 merchants worldwide, sold over 93 million Groupons, and had over 142 million subscribers. Groupon uses free cash flow and consolidated segment operating income as key non-GAAP measures to evaluate performance excluding non-cash expenses.
This document is Gannett Co.'s 2005 annual report. It includes a financial summary showing increases in operating revenues and income from continuing operations compared to 2004. It also includes letters to shareholders from the chairman and CEO discussing leadership changes at Gannett in 2005, acquisitions made to expand the company's reach both within traditional media and new digital platforms, and efforts to measure audience reach across multiple platforms and expand online offerings.
This annual report summarizes the financial performance of Winn-Dixie Stores, Inc. for the 1998 fiscal year. It operated 1,168 supermarkets across 14 states and the Bahamas. Key highlights include total sales of $13.6 billion, earnings per share of $1.33, taxes per share of $2.03, and a return on average equity of 14.7%. The report discusses Winn-Dixie's strategy of focusing on larger store formats and improving customer service to position itself for future success.
This annual report summarizes the financial performance and operations of Winn-Dixie Stores, Inc. for the 1998 fiscal year. Key highlights include sales reaching $13.6 billion, a 3% increase over the previous year, with net earnings of $198.6 million. The company continued expanding its store footprint, opening 84 new stores while enlarging or remodeling another 136 locations. Winn-Dixie also invested in new distribution centers and technology to improve operations and the customer shopping experience.
Group 1 Automotive is a leading automotive retailer that has experienced significant growth since its IPO in 1997. In 2002, Group 1 achieved record financial results for the fifth consecutive year, with revenues increasing 5.5% to $4.2 billion and net income growing 21% to $67.1 million. The company attributes its success to its diverse business model across brands, geographies, and revenue streams. Group 1 aims to continue its acquisition strategy in 2003 to further augment its portfolio and leverage its operating platform.
The Sherwin-Williams Company reported another successful year in 2003. Net sales increased 4.3% to $5.41 billion and income increased 6.9% to $332.1 million. Diluted earnings per share reached a new record high of $2.26, a 10.8% increase over 2002. Cash flow exceeded $550 million for the third consecutive year, allowing investments in capital expenditures, acquisitions, dividend payments, and share repurchases. All operating segments increased sales except Automotive Finishes. The Company added new stores and products, increased market share, and benefited from operational excellence initiatives.
The Sherwin-Williams Company reported another successful year in 2003 with net sales increasing 4.3% to $5.41 billion. Income before the cumulative effect of change in accounting principle grew 6.9% to $332.1 million. Diluted earnings per share set a new record high of $2.26, up 10.8% from the prior year. Cash flow from operations exceeded $550 million for the third consecutive year. The company strengthened its balance sheet, invested in capital expenditures and acquisitions, paid dividends, and repurchased shares. All operating segments increased sales with the exception of the Automotive Finishes segment, which saw a 0.6% increase. The company expects continued growth through
This annual report summarizes Bed Bath & Beyond's financial performance for fiscal year 2000. Some key points:
- Net sales increased 29% to $2.397 billion compared to the previous fiscal year. Net earnings increased 31% to $171.9 million.
- The company opened 70 new stores and expanded 2 others, ending the year with 311 stores total across 43 states.
- Comparable store sales increased 5% and this was the 9th consecutive year of record earnings since the company's IPO in 1992.
Bed Bath & Beyond had a very successful fiscal year 2000 according to their annual report.
1) Net sales increased 29% to $2.4 billion and net earnings increased 31% to $171.9 million.
2) They opened 70 new stores, more than any previous year, expanding their total store count to 311 stores across 43 states.
3) Looking ahead, Bed Bath & Beyond plans to open about 80 new stores in fiscal year 2001 and believes it can ultimately operate over 850 stores in the US, taking advantage of continued strong industry growth and their small market share.
The document provides answers to 19 questions about ConAgra Foods' financial performance in Q1 FY09. Some key details include: brands in Consumer Foods that saw sales growth/declines; unit volume was flat for Consumer Foods; total depreciation was $76M; capital expenditures were $106M; net interest expense was $50M; corporate expense was $97M; dividends paid were $92M; diluted shares outstanding were 470M; gross/operating margins were 20%/10%; net debt was $3.09B; net debt to capital ratio was 39%; effective tax rate was 38%; projected capex for FY09 were $475M; expected net interest expense
This document summarizes several residential and commercial real estate projects in Alfara'a Properties' pipeline for 2008, including projected revenues, profits, and Alfara'a's share of profits. It provides commission rates for various sales roles. Key projects to be launched in Q1 and Q2 2008 are Mulberry Mansions, Jebel Ali Downtown residential and commercial, and JVS Commercial. Larger projects proposed for mid-2008 launch include Waterfront G+50 residential and Marina Commercial residential and commercial. Total projected sales for 2008 are over 3 billion AED.
This document provides Citigroup's quarterly financial data supplement. It includes:
1) Financial summaries of Citigroup's income from continuing operations, net income, earnings per share, capital ratios, assets, and return on equity on a quarterly and annual basis.
2) Breakdowns of income from continuing operations by business segment and region, including Global Consumer, Global Corporate and Investment Bank, Private Client Services, and Global Investment Management.
3) Details on net revenues, income statements, and other financial metrics for Citigroup's business segments.
The supplement shows Citigroup's financial performance remained strong in the fourth quarter of 2003, with income from continuing operations up 96% from
This document summarizes ConAgra Foods' earnings results for fiscal year 2005 (FY05) in a question and answer format. Some key details include:
- FY05 diluted EPS was $1.23, including $0.12 in expenses that impacted comparability.
- Major brands in the Retail Products segment that saw sales growth included ACT II, Banquet, and Blue Bonnet. Brands that saw declines included Armour and Butterball.
- Retail Products volume increased 2% while Foodservice Products volume decreased 2% in Q4.
- Total depreciation and amortization was approximately $351 million for FY05 and $90 million for Q4. Capital expenditures
This document provides supplemental information for investors regarding Monsanto Company, including forward-looking statements and selected financial highlights from 2005-2008. Key points include that Monsanto is the world's leading agriculture company focused on seeds and traits, with 2008 net sales of $11.3 billion. Financial highlights show significant growth in net income, earnings per share, EBIT, and free cash flow over the period. The document also provides a reconciliation of non-GAAP earnings per share and notes that approximately half of Monsanto's 2008 net sales came from North America.
Charter Communications held an earnings call presentation on May 3, 2007 to discuss their quarterly results and outlook. The presentation included the following:
1) Charter reported strong momentum in the first quarter of 2007 with the highest revenue, adjusted EBITDA, and RGU growth in several years driven by increased bundling of services and growth in value-added services.
2) Bundled customers increased to 41% of total customers in the first quarter of 2007 compared to 34% in the prior year. Telephone services passed increased significantly year-over-year and telephone customers more than doubled.
3) Financial results showed 10.7% revenue growth and 13.2% adjusted EBITDA growth year-
Charter Communications held an earnings call presentation on May 3, 2007 to discuss their first quarter 2007 results. The presentation included the following key points:
1) Charter experienced strong momentum in the first quarter of 2007 with the highest revenue, adjusted EBITDA, and RGU growth in over four years driven by increased bundling of services and growth in value-added services.
2) Bundling of video, internet, and telephone services increased customer penetration and ARPU, with bundled customers rising to 41% of total customers in the first quarter of 2007 compared to 34% in the first quarter of 2006.
3) Telephone services continued to show strong growth with homes passed increasing 86% compared to the
Charter Communications reported financial results for the second quarter of 2007 that showed double-digit revenue and adjusted EBITDA growth compared to the second quarter of 2006. Revenue grew 11% due to increases in high-speed internet, telephone, and commercial business, while adjusted EBITDA rose 11%. The company added 166,300 total RGUs in the quarter, up 47% year-over-year, driven by growth in digital video, high-speed internet, and telephone customers. Bundled customers grew 17.7% and now make up 42% of total customers.
charter communications 4Q2007_Earnings_Presentation_vFINALfinance34
This document is the transcript from Charter Communications' 4th quarter and full year 2007 earnings call. It includes:
1) Charter Communications reported consistent revenue and adjusted EBITDA growth in the 4th quarter and full year 2007, driven by strategies to increase bundling penetration and improve customer experience.
2) The company grew revenue from high-speed internet and telephone services through customer growth and increasing ARPU. Bundling phone with cable services drove faster growth and improved customer retention.
3) Charter reduced its debt maturities through 2012 to $367 million and expects adequate liquidity through 2009 to continue investing in growth opportunities and improving service.
charter communications 4Q2007_Earnings_Presentation_vFINALfinance34
This document summarizes Charter Communications' 4th quarter and full year 2007 earnings call. It discusses the company's consistent revenue and adjusted EBITDA growth over the past five quarters. Key highlights include double-digit annual revenue growth driven by increases in high-speed internet and telephone customers. The company has focused on strategies like bundling multiple services and improving the customer experience to generate sustainable growth.
charter communications 1Q_2008_Earnings_Presentationfinance34
Charter Communications reported first quarter 2008 results. Revenue grew 10.5% to $1.56 billion driven by strong growth in high-speed internet, telephone, and commercial customers. Adjusted EBITDA also increased 10.5% to $545 million. The company added over 302,000 customers during the quarter and nearly doubled telephone customers year-over-year. Charter aims to continue growing revenue and adjusted EBITDA through bundling video, internet, and telephone services and increasing penetration of triple play customers.
charter communications 2Q_2008_Earnings_Presentation_FINALfinance34
Charter Communications reported second quarter 2008 earnings. Revenue grew 8.9% year-over-year to $1.623 billion driven by balance of rate and volume increases. Adjusted EBITDA increased 10.1% year-over-year to $591 million and the margin expanded 40 basis points to 36.4%. Total customer relationships grew 6% year-over-year with a focus on bundling video, internet, and telephone services and increasing penetration of advanced offerings.
charter communications 2Q_2008_Earnings_Presentation_FINALfinance34
Charter Communications held its second quarter 2008 earnings call on August 5, 2008. The presentation included forward-looking statements and discussed Charter's second quarter 2008 financial results. Key highlights included 8.9% revenue growth and 10.1% adjusted EBITDA growth. Charter saw increases in video, high-speed internet, and telephone customers. Bundled customer penetration reached 50% in the second quarter.
charter communications 3Q_2008_Earnings_Presentation_vFINALfinance34
Charter Communications held its third quarter 2008 earnings call on November 6, 2008. The document provides a cautionary statement regarding forward-looking statements made on the call. It notes that while Charter believes its plans, intentions and expectations are reasonable, actual results could differ materially due to risks and uncertainties. It lists some key risk factors that could cause results to differ from forward-looking statements.
charter communications 3Q_2008_Earnings_Presentation_vFINALfinance34
Charter Communications held its third quarter 2008 earnings call on November 6, 2008. The document provides a cautionary statement regarding forward-looking statements made on the call. It notes that while Charter believes its plans, intentions and expectations are reasonable, actual results could differ materially due to risks and uncertainties. The document lists some key risk factors that could cause actual results to differ from forward-looking statements.
This document is a proxy statement from Charter Communications providing information about the company's upcoming annual shareholder meeting. It details that shareholders will vote on the election of one Class A/Class B director and provides information about voting procedures. The sole nominee for the Class A/Class B director position is Ronald L. Nelson. The proxy statement also provides details about the meeting such as the voting eligibility requirements, proxy voting instructions, how to attend the meeting, and who is paying for the solicitation of proxies.
This document is a proxy statement from Charter Communications providing information for its upcoming annual shareholder meeting. It summarizes that shareholders will vote on one director nominee, Ronald L. Nelson, to serve as the Class A/Class B director on the board. It provides details on voting procedures and requirements. The other six board members will be elected solely by the Class B shareholder, Paul Allen.
Charter's broadband network provides the capacity to deliver high-speed internet access, digital video services, and interactive programming to millions of customers. Upgrading systems to broadband allows Charter to offer customers more choices through new digital services while generating new revenue streams. Charter is well-positioned for continued growth and success as the demand for broadband services increases and more applications are developed that utilize the network's massive bandwidth.
Charter Communications is the fourth largest cable television operator in the United States, serving over 6 million customers across 11 regions. The company believes that cable broadband will be the primary means of delivering new services like video, data, and voice to homes and businesses. Charter aims to deliver the full potential of broadband and provide superior customer service. The company has grown through 32 acquisitions since 1994 and successfully integrates new systems by empowering local managers and improving technology and marketing.
- The document is Charter Communications' 2001 proxy materials and 2000 financial report. It includes information about the upcoming annual shareholder meeting such as voting procedures, director nominees, and proposals to be voted on.
- Shareholders will vote on the election of one Class A/Class B director, ratification of the 1999 Option Plan, and approval of the 2001 Incentive Plan.
- The proxy statement provides details on voting procedures, who is eligible to vote, what votes are required to pass each item, and how to complete and submit proxy cards.
Charter Communications exceeded its ambitious financial goals and customer growth targets for 2000. The company integrated millions of new customers and thousands of employees from acquisitions, while accelerating its rollout of digital cable, high-speed internet, and video on demand services. Charter's aggressive expansion strategy has positioned it as an industry leader, with operating cash flow and customer growth significantly outpacing competitors. Going forward, Charter will continue investing in its broadband network and pursuing new acquisition opportunities to further its vision of delivering advanced interactive services to homes and businesses.
Charter Communications had a very successful year in 2000:
1) They exceeded their ambitious financial goals, achieving significant revenue and cash flow growth through acquisitions and expansion of their broadband network and advanced services.
2) They reached over 1 million digital cable customers, accelerated their broadband network buildout, and were recognized as industry leaders in key performance metrics.
3) Looking ahead, Charter plans to continue growing organically and through acquisitions to attract more customers and capitalize on their technological lead in interactive digital services delivered over their high-speed broadband network.
This document is the proxy statement and financial report from Charter Communications for 2002. It provides information on the annual shareholder meeting, including the election of one Class A/Class B director by the combined vote of Class A and B shareholders. It also includes details on ratifying the appointment of KPMG LLP as the independent auditor. Additional sections provide information on executive compensation, ownership of shares, related party transactions, and the financial report for 2001.
Charter Communications experienced significant growth and transformation in 2001. It ended the year with over 2.1 million digital cable customers and 607,700 high-speed cable modem customers. Charter also expanded its interactive television offerings and modernized its network monitoring and customer service centers. Going forward, Charter aims to fully leverage its high-speed broadband network to deliver digital video, high-speed internet, and interactive television services.
Charter Communications had strong growth in 2001, adding over 2.1 million digital cable customers and over 600,000 high-speed internet customers. The company continued expanding its network and improving customer service centers. Charter provides digital video, high-speed internet, and interactive television services using its broadband network, enhancing customers' entertainment and access to information. The company saw revenues increase 14% and operating cash flow increase nearly 11% from 2000 to 2001.
The Universal Account Number (UAN) by EPFO centralizes multiple PF accounts, simplifying management for Indian employees. It streamlines PF transfers, withdrawals, and KYC updates, providing transparency and reducing employer dependency. Despite challenges like digital literacy and internet access, UAN is vital for financial empowerment and efficient provident fund management in today's digital age.
Independent Study - College of Wooster Research (2023-2024) FDI, Culture, Glo...AntoniaOwensDetwiler
"Does Foreign Direct Investment Negatively Affect Preservation of Culture in the Global South? Case Studies in Thailand and Cambodia."
Do elements of globalization, such as Foreign Direct Investment (FDI), negatively affect the ability of countries in the Global South to preserve their culture? This research aims to answer this question by employing a cross-sectional comparative case study analysis utilizing methods of difference. Thailand and Cambodia are compared as they are in the same region and have a similar culture. The metric of difference between Thailand and Cambodia is their ability to preserve their culture. This ability is operationalized by their respective attitudes towards FDI; Thailand imposes stringent regulations and limitations on FDI while Cambodia does not hesitate to accept most FDI and imposes fewer limitations. The evidence from this study suggests that FDI from globally influential countries with high gross domestic products (GDPs) (e.g. China, U.S.) challenges the ability of countries with lower GDPs (e.g. Cambodia) to protect their culture. Furthermore, the ability, or lack thereof, of the receiving countries to protect their culture is amplified by the existence and implementation of restrictive FDI policies imposed by their governments.
My study abroad in Bali, Indonesia, inspired this research topic as I noticed how globalization is changing the culture of its people. I learned their language and way of life which helped me understand the beauty and importance of cultural preservation. I believe we could all benefit from learning new perspectives as they could help us ideate solutions to contemporary issues and empathize with others.
Enhancing Asset Quality: Strategies for Financial Institutionsshruti1menon2
Ensuring robust asset quality is not just a mere aspect but a critical cornerstone for the stability and success of financial institutions worldwide. It serves as the bedrock upon which profitability is built and investor confidence is sustained. Therefore, in this presentation, we delve into a comprehensive exploration of strategies that can aid financial institutions in achieving and maintaining superior asset quality.
Optimizing Net Interest Margin (NIM) in the Financial Sector (With Examples).pdfshruti1menon2
NIM is calculated as the difference between interest income earned and interest expenses paid, divided by interest-earning assets.
Importance: NIM serves as a critical measure of a financial institution's profitability and operational efficiency. It reflects how effectively the institution is utilizing its interest-earning assets to generate income while managing interest costs.
Economic Risk Factor Update: June 2024 [SlideShare]Commonwealth
May’s reports showed signs of continued economic growth, said Sam Millette, director, fixed income, in his latest Economic Risk Factor Update.
For more market updates, subscribe to The Independent Market Observer at https://blog.commonwealth.com/independent-market-observer.
OJP data from firms like Vicinity Jobs have emerged as a complement to traditional sources of labour demand data, such as the Job Vacancy and Wages Survey (JVWS). Ibrahim Abuallail, PhD Candidate, University of Ottawa, presented research relating to bias in OJPs and a proposed approach to effectively adjust OJP data to complement existing official data (such as from the JVWS) and improve the measurement of labour demand.
New Visa Rules for Tourists and Students in Thailand | Amit Kakkar Easy VisaAmit Kakkar
Discover essential details about Thailand's recent visa policy changes, tailored for tourists and students. Amit Kakkar Easy Visa provides a comprehensive overview of new requirements, application processes, and tips to ensure a smooth transition for all travelers.
A toxic combination of 15 years of low growth, and four decades of high inequality, has left Britain poorer and falling behind its peers. Productivity growth is weak and public investment is low, while wages today are no higher than they were before the financial crisis. Britain needs a new economic strategy to lift itself out of stagnation.
Scotland is in many ways a microcosm of this challenge. It has become a hub for creative industries, is home to several world-class universities and a thriving community of businesses – strengths that need to be harness and leveraged. But it also has high levels of deprivation, with homelessness reaching a record high and nearly half a million people living in very deep poverty last year. Scotland won’t be truly thriving unless it finds ways to ensure that all its inhabitants benefit from growth and investment. This is the central challenge facing policy makers both in Holyrood and Westminster.
What should a new national economic strategy for Scotland include? What would the pursuit of stronger economic growth mean for local, national and UK-wide policy makers? How will economic change affect the jobs we do, the places we live and the businesses we work for? And what are the prospects for cities like Glasgow, and nations like Scotland, in rising to these challenges?
Fabular Frames and the Four Ratio ProblemMajid Iqbal
Digital, interactive art showing the struggle of a society in providing for its present population while also saving planetary resources for future generations. Spread across several frames, the art is actually the rendering of real and speculative data. The stereographic projections change shape in response to prompts and provocations. Visitors interact with the model through speculative statements about how to increase savings across communities, regions, ecosystems and environments. Their fabulations combined with random noise, i.e. factors beyond control, have a dramatic effect on the societal transition. Things get better. Things get worse. The aim is to give visitors a new grasp and feel of the ongoing struggles in democracies around the world.
Stunning art in the small multiples format brings out the spatiotemporal nature of societal transitions, against backdrop issues such as energy, housing, waste, farmland and forest. In each frame we see hopeful and frightful interplays between spending and saving. Problems emerge when one of the two parts of the existential anaglyph rapidly shrinks like Arctic ice, as factors cross thresholds. Ecological wealth and intergenerational equity areFour at stake. Not enough spending could mean economic stress, social unrest and political conflict. Not enough saving and there will be climate breakdown and ‘bankruptcy’. So where does speculative design start and the gambling and betting end? Behind each fabular frame is a four ratio problem. Each ratio reflects the level of sacrifice and self-restraint a society is willing to accept, against promises of prosperity and freedom. Some values seem to stabilise a frame while others cause collapse. Get the ratios right and we can have it all. Get them wrong and things get more desperate.
5 Tips for Creating Standard Financial ReportsEasyReports
Well-crafted financial reports serve as vital tools for decision-making and transparency within an organization. By following the undermentioned tips, you can create standardized financial reports that effectively communicate your company's financial health and performance to stakeholders.
South Dakota State University degree offer diploma Transcriptynfqplhm
办理美国SDSU毕业证书制作南达科他州立大学假文凭定制Q微168899991做SDSU留信网教留服认证海牙认证改SDSU成绩单GPA做SDSU假学位证假文凭高仿毕业证GRE代考如何申请南达科他州立大学South Dakota State University degree offer diploma Transcript
Abhay Bhutada, the Managing Director of Poonawalla Fincorp Limited, is an accomplished leader with over 15 years of experience in commercial and retail lending. A Qualified Chartered Accountant, he has been pivotal in leveraging technology to enhance financial services. Starting his career at Bank of India, he later founded TAB Capital Limited and co-founded Poonawalla Finance Private Limited, emphasizing digital lending. Under his leadership, Poonawalla Fincorp achieved a 'AAA' credit rating, integrating acquisitions and emphasizing corporate governance. Actively involved in industry forums and CSR initiatives, Abhay has been recognized with awards like "Young Entrepreneur of India 2017" and "40 under 40 Most Influential Leader for 2020-21." Personally, he values mindfulness, enjoys gardening, yoga, and sees every day as an opportunity for growth and improvement.
1. The Pantry, Inc.
enhanced selection
competitively positioned
operational excellence
improved efficiency intelligent information
strong brands
Focused on Action
prudent investments
advanced technologies
unmatched convenience superior service
2002 Annual Report
2. REGION OF OPERATIONS
The Pantry, Inc. is the leading convenience store
operator in the southeastern United States and the
second largest independently operated convenience
store chain in the country. The Company currently
operates 1,289 stores in suburban areas of rapidly
growing markets, coastal/resort areas and smaller
towns located in Florida, North Carolina, South
Carolina, Georgia, Mississippi, Kentucky, Virginia,
Indiana, Tennessee and Louisiana.
Our Brands
FINANCIAL HIGHLIGHTS
Big K
Depot Food Stores
ETNA
(dollars in thousands, except for per share information)
Express Stop
2002 2001 2000
Fiscal Year
Fast Lane
Total revenues $2,494,064 $2,643,044 $2,431,184
Gross profit 475,402 487,643 468,364
Food Chief
Depreciation and amortization 54,251 63,545 56,062
Handy Way
Income from operations 53,852 55,193 75,186
Interest expense 51,646 58,731 52,329
Kangaroo
Net income (loss) 1,804 (2,656) 13,996
Earnings (loss) per share: Lil' Champ
Basic $ 0.10 $ (0.15) $ 0.77
Market Express
Diluted 0.10 (0.15) 0.74
Comparable store sales growth: Mini Mart
Merchandise 3.4% (0.2)% 7.5%
On The Way
Gasoline gallons 1.5% (3.8)% (2.4)%
Average sales per store:
Quick Stop
Merchandise sales $ 765.2 $ 731.0 $ 713.8
Smokers Express
Gasoline gallons (in thousands) 924.2 890.4 856.9
EBITDA 108,103 123,509 131,248
Sprint
Store count, end of year 1,289 1,324 1,313
The Pantry
Wicker Mart
Zip Mart
3. 02 Annual Report
The Pantry 20
LETTER TO SHAREHOLDERS
Dear Shareholder,
In fiscal 2002, The Pantry continued to take the necessary actions to effectively strengthen
its business and further enhance its position as a leading operator of convenience stores in the
southeastern United States.
During the year, we remained “Focused on Action,” a strategy that has allowed us to
make important strides throughout our business as well as our ongoing efforts to achieve
operational excellence. In fiscal 2002, we acted decisively, taking steps to enhance the
performance of our stores, to more effectively manage our gasoline operations and to further
strengthen the processes and systems that support our vast store network. Importantly,
we achieved progress in each of these areas while continuing to effectively manage our costs.
We have only just begun to realize the benefits of the many actions taken over the past year
and expect to achieve even greater efficiencies and progress in the year ahead.
Financial Performance
In fiscal 2002, we acted decisively, taking steps to
While year-over-year revenue
enhance the performance of our stores, to more was lower, in large part due to a 13.8
percent decline in the average retail
effectively manage our gasoline operations and to
price of gasoline and a reduction in
store count, our focus on action
further strengthen the processes and systems that
allowed us to generate positive
support our vast store network. results on several fronts.
Despite a challenging retail
environment, we reported an increase of 3.4 percent in comparable store merchandise
revenues and a 1.5 percent increase in comparable store gasoline volume. In addition, during
the year we paid down our debt by $40 million, ending the year with $42.2 million in cash
and no outstanding borrowings under our revolving credit facility.
Total revenues for fiscal 2002 were $2.5 billion versus $2.6 billion in the previous year.
Earnings rose to $1.8 million, or $0.10 per share, compared to fiscal 2001 net loss of $2.7
million, or $(0.15) per share. Adjusted earnings for fiscal 2002 were $2.4 million, or $0.13
per share, compared to adjusted earnings of $10.2 million, or $0.56 per share, in fiscal 2001.
Fiscal 2002 EBITDA was $108.1 million compared to $123.5 million in fiscal 2001. The decline
in adjusted earnings and EBITDA was almost entirely due to a two-cent decline in gasoline
margin per gallon and the corresponding decline in gasoline gross profit of $20.8 million.
01
4. 02 Annual Report
The Pantry 20
LETTER TO SHAREHOLDERS CONTINUED
Focused on Action
Throughout the year, we continued to take actions that allowed us to build upon the
strengths of our core business, focusing our time and resources on enhancing our network of
1,289 stores. These actions touched nearly every aspect of our operations from the way we
fill our stores and pumps to the products with which we do it.
In our stores, we implemented a comprehensive reset program, repositioning our
merchandise offering through
In fiscal 2003, we will continue to strive for operational excel-
planned promotional activities,
changes in in-store place-
lence in order to better serve our customers and strengthen
ment and assortment and
enhanced advertising of key our position as a leading convenience store operator.
destination categories—all
measures aimed at providing greater value and convenience to our customers while also
enhancing sales and gross profits. The success of this program, which has been rolled out in
approximately 700 stores to date, is evident in the increases reported in our comparable store
merchandise revenue and merchandise gross profits during the year.
We also took substantive actions to strengthen our gasoline operations, where our focus
has been on remaining intelligently competitive. We continued to leverage our proprietary
technologies and the knowledge and experience of our staff to effectively enhance our com-
petitive position in all markets. This included actions to better monitor and adjust our pricing in
line with changing market conditions as well as reassessments of our branding strategies to
best reflect consumer preferences for various branded and unbranded gasoline products on a
2002 $998.6
2001 $968.6
market-by-market basis. These actions have strengthened our ability to more effectively strike
2000 $907.6
a balance between gasoline volume and gross profit, even in light of ongoing volatility in the
wholesale price of gasoline.
1999 $731.7
Focused on Efficiency
Achieving greater efficiencies is also an integral part of our efforts to strengthen our
1998 $460.8
operations as well as our overall results. Therefore, in addition to continuing to realize the
benefits of our restructuring initiatives, which were implemented in fiscal 2001, we took
further actions throughout the year to more effectively manage our costs while continuing to
make strategic investments in our business.
Merchandise
Revenue
(in millions)
02
5. During the year, we closely assessed the performance of each and every store we
operate in order to ensure optimal performance across the network. In doing so, we identified
and closed 38 underperforming locations. This process not only allowed us to save on over-
head and administrative costs, it also enabled us to more effectively allocate our resources.
Importantly, in fiscal 2002, we directed our funds to further upgrading our existing locations,
2002 1,171.9
including technology enhancements that will allow us to better monitor inventory levels, sales
2001 1,142.4
2000 1,062.4
and margins. These actions included enhancements to our gasoline management systems,
the adoption of in-store scanners in approximately 25 percent of our locations as well as the
1999 855.7
development and rollout of a store-based computer-training program for employees.
Further, we leveraged our relationships with suppliers, including those that provide us
with merchandise and gasoline, as well as service vendors to reach more favorable pricing
agreements. Taken together, these actions will not only allow us to strengthen the bottom line,
1998 466.8
they will enable us to continue to enhance our long-term competitive position.
Focused on the Future
We are optimistic about our business and our prospects as we enter a new year. While
Gasoline
we expect ongoing economic and geopolitical uncertainties to continue, we believe that the
Gallons
(in millions)
actions we have taken over the past year will yield positive results.
In fiscal 2003, we will continue to strive for operational excellence in order to better
serve our customers and strengthen our position as a leading convenience store operator. We
remain committed to being intelligently competitive in our gasoline operations and to further
enhancing our in-store performance, which we expect will drive increased traffic to our pumps
and our stores.
By remaining “Focused on Action,” we are confident that we are well positioned to
provide greater value to our customers, employees and shareholders alike. We thank all of
you for your ongoing support and look forward to the year ahead.
Sincerely,
Peter J. Sodini President and Chief Executive Officer
03
6. The Pantry’s ability to maintain our leadership position year after year
is the result of our efforts to ensure our customers have access to the
best selection of products and services at the very best prices.
Convenience
Brands
Value
Selection
04
7. 02 Annual Report
The Pantry 20
REVIEW OF OPERATIONS
Taking Action
The Pantry continues to take the necessary actions to provide value and convenience
through everything we do. This includes offering customers a vast assortment of merchandise
and in-store services as well as a broad selection of premium branded and unbranded gasoline
products. Our focus, however, is not simply on giving customers access to the products and
services they want, but also ensuring they get them at the most competitive prices. It is this
commitment that remains the cornerstone of our business and continues to enhance our posi-
tion as the leading convenience store operator in the southeastern United States.
Enhancing Our Selection
Being the destination of choice for our customers requires that we continually assess
and adjust the products and services we offer in line with their ever-changing needs. Through-
out fiscal 2002, we did just that. We took substantive actions to further enhance our in-store
merchandise offering as well as our pricing in order to attract more customers and, in turn,
strengthen our results.
In doing so, we implemented a com-
The Pantry’s ongoing commitment to providing con- prehensive store-repositioning program.
Convenience venience to our customers remains the cornerstone
This effort included a broad range of actions
of our strategy and our ongoing success.
touching nearly every aspect of our in-store
operations including the products we offer
Our extensive selection of merchandise and ancillary as well as our approach to selling them. We
Selection services continues to drive traffic to our vast store
took the necessary steps to enhance our
network throughout the Southeast.
merchandise mix, which already includes a
wide selection of brand name and private
The Pantry offers customers the broadest range
label goods such as snack foods, soft drinks,
Brands of brand name snack foods, soft drinks and fresh
beer and cigarettes, and reformatted our
food products.
merchandising placement to give greater
prominence to high-demand products and
We continue to strive to bring value to our customers
high-margin impulse purchases.
Value by providing them with high-quality products at the
We also focused on strengthening our
most competitive prices.
competitive position by instituting a number
of planned promotional activities—many of which were supported by our suppliers—and
enhancing advertising of key destination categories. By the end of fiscal 2002, we completed
this process in some 700 of our stores and expect to finish assessing and resetting the
remainder of our locations by April 2003.
In our efforts to enhance our merchandise offering, we also expanded our fresh food
selection and other in-store services. We continued to upgrade and add quick service restau-
rants and fresh food programs in a number of selected markets. This included strengthening
our offering of core fast food categories such as coffee, fountain and frozen drinks, fresh sand-
wiches and our grilling stations. Today, we offer customers approximately 20 proprietary and
national brands including favorites such as Subway, Hardee’s, Aunt M’s, Krystals and Church’s.
Further, we continued to grow our selection of ancillary products and services, bringing
even higher levels of convenience to Pantry shoppers. Throughout our locations, we offered
05
8. 02 Annual Report
The Pantry 20
REVIEW OF OPERATIONS CONTINUED
customers greater access to ATMs, money orders, lottery tickets as well as a broad range of
pre-paid solutions including phone cards and cellular services and accessories. Taken together,
these enhancements have strengthened our ability to offer customers the best selection of
products and services at the most competitive prices.
Becoming More Competitive
Throughout fiscal 2002, we also remained focused on strengthening our competitive
position in our gasoline operations. And, while we could not exercise control over factors such
as ongoing volatility in the wholesale price of gasoline, which greatly impacted our perform-
ance, we took decisive actions to more effectively manage those aspects of our operations
over which we do have control.
By remaining intelligently competitive, we are able to
Our strategy in this segment is to
Competitive
offer customers the right selection of gasoline prod-
be intelligently competitive. This means ucts at the right prices throughout all key markets.
leveraging our resources including our
technologies and collective experience to
Installing and maintaining state-of-the-art technology at
effectively strike a balance between the
Technology
our pumps ensures our customers an easy and conven-
volume of gasoline we sell and the prices ient fueling experience that keeps them coming back.
at which we do it. Critical to this process is
understanding the needs and preferences
Through our strong relationships with high-quality
of our customers, ensuring we offer the
Partnerships
partners, we are better positioned to offer our cus-
tomers a broad range of premium brands and products.
right selection of competitively priced
branded or unbranded gasoline products for
In addition to accepting major commercial and petro-
each location as well as our ability to effec-
leum company credit cards, The Pantry’s Rapid Fuel
Programs
tively monitor the markets in which we
Card program provides yet another easy and conven-
operate—right down to knowing even our ient form of payment for our loyal customers.
smallest competitors and how they work.
During the year, we took a number of important steps to enhance our performance in all
of these respects. Together with outside consultants, we began a comprehensive review of
the logistics of our gasoline operations as well as our branding strategies in key markets.
Our aim was to optimize our performance and strengthen our bottom line. We did this
by working to better rationalize our gasoline offering according to consumer preferences, con-
solidating the brands we provide, expanding our proprietary Kangaroo brand into appropriate
locations and leveraging the size and strength of our network to renegotiate our contracts with
suppliers and partners.
Further, we continued to monitor market conditions and the actions of our competitors
to continue to drive traffic to our locations. In fiscal 2002, we kept a close eye on pricing—ours
as well as that of the competition. This information, which was gathered on a daily basis, was
then used to assess our market position and make necessary pricing adjustments at each and
every location.
While challenging market conditions persist, we continue our commitment to being intel-
ligently competitive and to taking the necessary steps to more effectively and efficiently meet
the needs of our customers.
06
9. Partnerships
Programs
Technology
Competitive
With gasoline sales serving as the single greatest driver of traffic to our stores,
we maintain a sharp focus on meeting the needs of our customers
throughout our fueling locations.
07
10. 02 Annual Report
The Pantry 20
REVIEW OF OPERATIONS CONTINUED
Pursuing Operational Excellence
Our efforts to continue to better serve our customers and enhance our leadership posi-
tion throughout the Southeast go hand in hand with our commitment to achieving operational
excellence. Throughout fiscal 2002, our strategy was to strengthen our existing operations—
both at our stores and pumps as well as at the corporate level. This entailed assessing every
aspect of our operations including the performance of each of our locations, the effectiveness
of the systems and the technologies we use and our overall efficiency in terms of managing
our costs.
In evaluating the profitability of each of our stores, we closed 38 underperforming loca-
tions in fiscal 2002. This allowed us to eliminate the costs associated with maintaining these
stores and enabled us to direct our resources and efforts towards enhancing our operations
and results in those locations where we are seeing solid results.
In upgrading our existing locations, we focused on making additional technology
enhancements in order to strengthen our efficiency on several fronts. In our gasoline opera-
tions, we continued to fine tune our in-ground gasoline inventory management system, which
we developed and rolled out during fiscal 2000 and fiscal 2001, to more effectively monitor
and reduce our inventory levels and achieve
significant working capital benefits.
Achieving the highest levels of efficiency throughout
Efficiency
Similarly, in our stores, we continued our business enables us to better serve our cus-
tomers and continue to enhance our results.
to add technology systems to enhance our
performance. During the year, we developed
an in-store computer-based training program The Pantry’s efforts to achieve operational excellence
Excellence
are evidenced in our ongoing efforts to strengthen
for our associates, which we expect will
every aspect of our business.
increase productivity and efficiency. Further,
we rolled out new scanning systems to
approximately 25 percent of our locations. We believe this will allow us to better control inven-
tory levels and pricing and ultimately strengthen our ability to increase sales and margins.
While we believe that making ongoing investments in our operations is critical to our
ability to achieve operation excellence, we are also focused on ensuring we are doing every-
thing we can to reduce and manage our costs when and where possible. In addition to con-
tinuing to realize the benefits of our restructuring efforts in fiscal 2001, which included the
elimination of duplicative administrative functions and the closure of our Florida support
center, we also continued to take steps to further reduce costs associated with labor and
other variable store expenses.
Designed by Curran & Connors, Inc. / www.curran-connors.com
Importantly, we reassessed our relationships with suppliers and eliminated a number
of lesser ones in favor of those partners—in gasoline and merchandising—with whom we
believe we have more beneficial relationships. Further, by reducing the number of suppliers
with whom we work, we were able to strike more favorable purchasing and marketing agree-
ments. We applied this same principle to maintenance and other service providers to achieve
even further savings.
These actions have significantly advanced our goal of achieving operational excellence
and we remain dedicated to continuing to take the necessary steps to further strengthen our
performance and results as we go forward.
08
11. CORPORATE DIRECTORY
Directors Financial Information David M. Zaborski
Vice President, Marketing
Forms 10-K and 10-Q are available
Peter J. Sodini
without charge. Gregory J. Tornberg
President and Chief Executive Officer
Direct requests to: Vice President, Gasoline Marketing
Todd W. Halloran
Daniel J. Kelly
Principal
Vice President and Chief Financial Officer
Freeman Spogli & Co. Executive Office
The Pantry, Inc.
Jon D. Ralph(2) Post Office Box 1410 The Pantry Inc.
Sanford, North Carolina 27330
Principal 1801 Douglas Drive
Phone: 919-774-6700
Freeman Spogli & Co. Sanford, North Carolina 27330
Fax: 919-774-3329 Phone: 919-774-6700
Charles P. Rullman(2) Fax: 919-774-3329
Principal
Freeman Spogli & Co. Internet
Transfer Agent
Byron E. Allumbaugh(1) Additional information on The Pantry, Inc.
Consultant is available on the World Wide Web at: Wachovia Bank, NA
www.thepantry.com Equity Services
Peter M. Starrett
Charlotte, North Carolina
Consultant
Executive Officers
Thomas M. Murnane
Independent Accountants
Consultant
Peter J. Sodini
Deloitte & Touche LLP
President and Chief Executive Officer
William M. Webster III (1)
Raleigh, North Carolina
Private Investor
Steven J. Ferreira
Senior Vice President, Administration and
Hubert E. Yarborough III(1)
Strategic Planning Annual Meeting
The Yarborough Group of South Carolina LLC
Daniel J. Kelly The annual meeting of stockholders will be
Board Committees:
Vice President, Chief Financial Officer and held on Tuesday, March 25, 2003 at 10:00 AM
(1) Audit Committee
Corporate Secretary Eastern Standard Time at the Sheraton Imperial
(2) Compensation Committee
Hotel, 4700 Emperor Boulevard, I-40 at Exit 282
Joseph A. Krol (Page Road), Durham, North Carolina 27730
Vice President, Operations
(approximately 3 miles from RDU airport).
12. The Pantry, Inc.
1801 Douglas Drive
Sanford, North Carolina 27330
Phone: 919-774-6700
Fax: 919-774-3329