Download to read offline


![r=.350 word count r=.365 MaxEnt
[cscw’12] Tracking Gross Community Happiness from Tweets](https://image.slidesharecdn.com/psychomapswww13-130521171905-phpapp02/85/Psychological-Maps-2-0-www-2013-11-320.jpg)
![social media
environment
sports
health Royal wedding
Spanish/Portuguese
celebrity gossips
Talk of the City [ICWSM’12]](https://image.slidesharecdn.com/psychomapswww13-130521171905-phpapp02/85/Psychological-Maps-2-0-www-2013-12-320.jpg)


![“I’ve been living in London for the past 35 years and I
felt like a tourist. There were so many places I had no
clue where they were. It is frustrating to get a score
of 200 [out of 1000]!
”](https://image.slidesharecdn.com/psychomapswww13-130521171905-phpapp02/85/Psychological-Maps-2-0-www-2013-31-320.jpg)

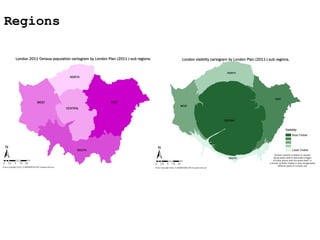


![Psychological Maps 2.0 [www 2013]](https://image.slidesharecdn.com/psychomapswww13-130521171905-phpapp02/85/Psychological-Maps-2-0-www-2013-53-320.jpg)
![Psychological Maps 2.0 [www 2013]](https://image.slidesharecdn.com/psychomapswww13-130521171905-phpapp02/85/Psychological-Maps-2-0-www-2013-54-320.jpg)

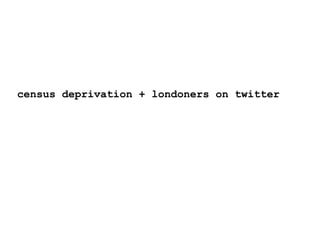
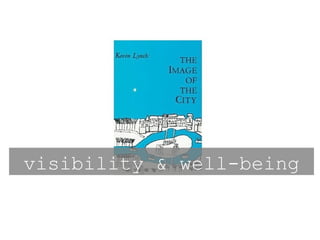
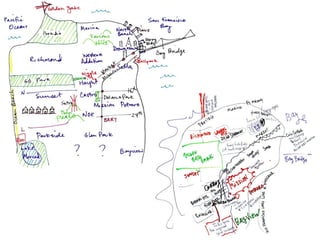
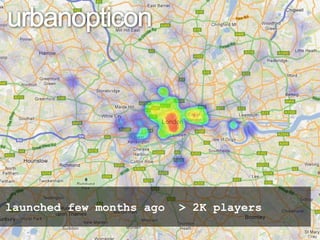
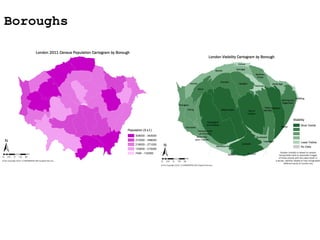
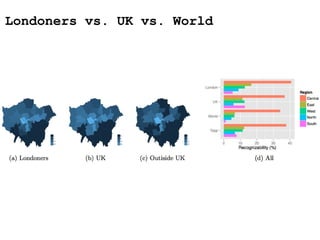
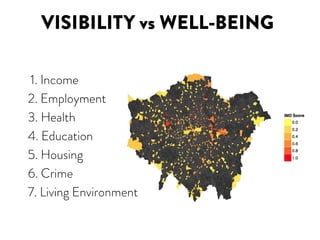
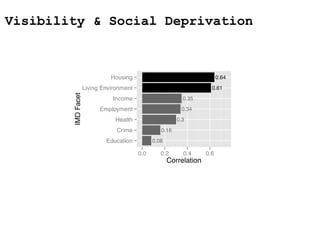
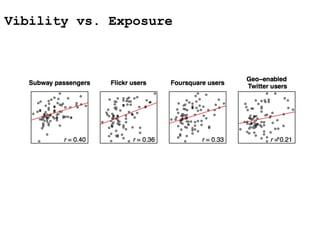
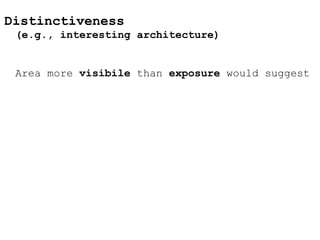
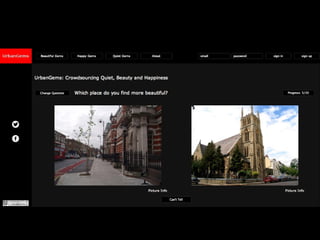
Psychological Maps 2.0 is a web-based project that aims to map London using social media data and citizen participation. By tracking tweets and having London residents play an online game to test their knowledge of different areas, the project seeks to better understand visibility, social deprivation, and subjective well-being across different London neighborhoods in a data-driven way. Over 2,000 people from varied demographics have already participated, providing insights into how visibility relates to factors like architecture, exposure in media, and socioeconomic status.


![MobiRate [Ubicomp 2008]](https://cdn.slidesharecdn.com/ss_thumbnails/quercia08mobirate-1222120543454473-9-thumbnail.jpg?width=640&height=640&fit=bounds)


